PreprintCited by 34Machine Learning in HealthcareRadiomics and Machine Learning in Medical ImagingBreast Cancer Treatment Studies

The DOI matches its Crossref record; 1 of the 1 references it cites were found in a registry or an index.

Pretrained transformers applied to clinical studies improve predictions of treatment efficacy and associated biomarkers

Open access

Preprint — published as 10.1038/s41467-025-57181-2

Abstract

Cancer treatment has made significant advancements in recent decades, leading to improved outcomes and quality of life for many patients. Despite the array of available therapies, including targeted, hormone, and checkpoint blockade immunotherapy, many patients experience treatment failure or eventual resistance. Attempts to predict the efficacy of therapies, particularly immuno-oncology therapies, have suffered from limited accuracy and difficulties in identifying molecular and other determinants of response. Improving treatment prediction alone is insufficient to create clinically meaningful research tools; additional prerequisites for this goal involve accommodating small data sets, effectively handling sparse features, integrating diverse clinical data, addressing missing measurements, ensuring interpretability, and extracting valuable biological insights for both clinical context and further research. Multimodal deep-learning models offer a promising avenue to surmount these challenges by leveraging their capacity and flexibility to learn from expansive and varied clinical and molecular data sets. Similar to their application in natural language and other domains, deep-learning models can uncover complex relationships within data that are pertinent to survival and treatment response. In this study, we introduce an explainable transformer-based deep-learning framework that addresses these challenges. This framework yields predictions of survival outcomes, as quantified by concordance index, that surpass the performance of state-of-the-art methods such as Cox proportional hazards, survival random forest, and tumor mutation burden, across diverse independent data sets. We developed the clinical transformer, a deep neural-network survival prediction framework that capitalizes on the flexibility of the deep-learning model, including training strategies like gradual and transfer learning, to maximize the use of available data to enhance survival predictions and generate actionable biological insights. Finally, we illustrate the future potential of the clinical transformer’s generative capability in early-stage clinical studies. By perturbing molecular features associated with immune checkpoint inhibition treatment in immunotherapy-naive patient profiles, we identified a subset of patients who may benefit from immunotherapy. These findings were subsequently validated across three independent immunotherapy treatment cohorts. We anticipate that this research will empower the scientific community to further harness data for the benefit of patients.

Overview

The claims and statistics of this paper haven’t been checked yet.

Run the check — free, no account needed. It reads the open-access text and checks the sources it cites.

A few free checks a day · papers already verified open instantly · results are public

Integrity signals

Registry

Crossref · 10.1101/2023.09.12.23295357

Cites

1 of 1 references verified0 citation errors · 0 not checkable

Statistics

Figures

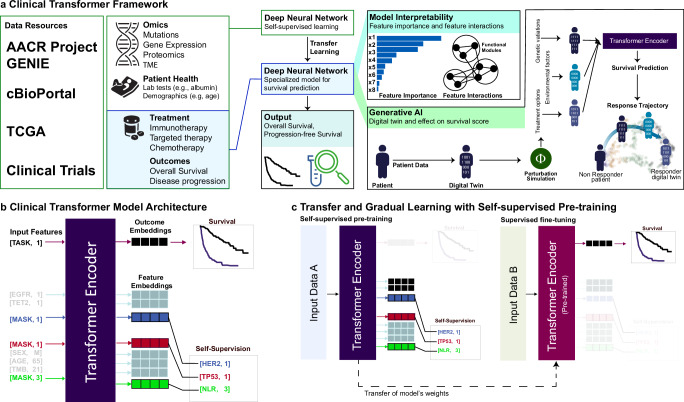
Fig. 1 Overview of the Clinical Transformer framework. a Framework capabilities and analysis overview of the Clinical Transformer to process data to insights. Model interpretability is extracted by using the output embeddings to generate functional modules (group or input features) that are associated with the outcome. The Clinical Transformer is shown as a generative model to recreate a patient’s trajectory of response, using patient embeddings with a perturbation-based approach. Embeddings can also generate synthetic data restricted by certain conditions. b Input data are represented by [Key, Value] pairs, where the key is the feature name and the value corresponds to the numerical score of the feature (e.g., [Age, 20] represents a patient with an age of 20 years). Feature names and values are embedded and fed to a transformer encoder architecture without positional encoding. The special input token [TASK, 1] is added in front of every input sample, and the output of this token is used to predict patient survival or classification outcomes. The special token [MASK] is used for performing the pretraining stage, in which the model is asked to predict the masked token names (corresponding to the masked features). c The Clinical Transformer trained in self-supervised mode uses dataset A to train over a masked-prediction task in which input features are randomly ignored and used as labels. Thus, the objective of the model is to predict the feature name of the ignored input features. After pretraining, the weights of the model can be used to fine-tune into a specialized task such as responder prediction or survival analysis. When input data A are different from input data B, it refers to transfer learning, whereas if the same data are used for both tasks (data A = data B), it is called gradual learning, as the model first learns about the data in an unsupervised way and then specializes on a specific task over the same dataset (e.g., survival prediction).
Fig. 1 Overview of the Clinical Transformer framework. a Framework capabilities and analysis overview of the Clinical Transformer to process data to insights. Model interpretability is extracted by using the output embeddings to generate functional modules (group or input features) that are associated with the outcome. The Clinical Transformer is shown as a generative model to recreate a patient’s trajectory of response, using patient embeddings with a perturbation-based approach. Embeddings can also generate synthetic data restricted by certain conditions. b Input data are represented by [Key, Value] pairs, where the key is the feature name and the value corresponds to the numerical score of the feature (e.g., [Age, 20] represents a patient with an age of 20 years). Feature names and values are embedded and fed to a transformer encoder architecture without positional encoding. The special input token [TASK, 1] is added in front of every input sample, and the output of this token is used to predict patient survival or classification outcomes. The special token [MASK] is used for performing the pretraining stage, in which the model is asked to predict the masked token names (corresponding to the masked features). c The Clinical Transformer trained in self-supervised mode uses dataset A to train over a masked-prediction task in which input features are randomly ignored and used as labels. Thus, the objective of the model is to predict the feature name of the ignored input features. After pretraining, the weights of the model can be used to fine-tune into a specialized task such as responder prediction or survival analysis. When input data A are different from input data B, it refers to transfer learning, whereas if the same data are used for both tasks (data A = data B), it is called gradual learning, as the model first learns about the data in an unsupervised way and then specializes on a specific task over the same dataset (e.g., survival prediction).CC BY · PubMed Central
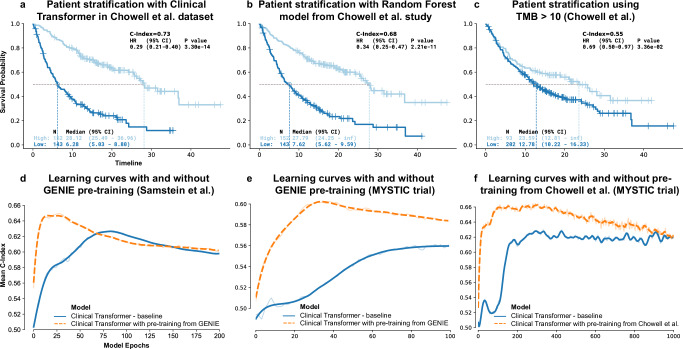
Fig. 2 Clinical Transformer performance and impact of pretraining. a Kaplan-Meier (KM) curves of the Clinical Transformer applied to the Chowell et al.3 dataset, using the median survival score to stratify patients into high and low populations. b KM curves of Chowell et al.3 random forest model used in the testing dataset (using Chowell et al. optimal pan-cancer cutoff = 0.238). c KM curves for evaluating TMB score in the Chowell et al.3 dataset (cutoff = 10 mutations per megabase [mut/mb]). P-values for HR in (a–c) reported from a Wald statistical test. d Learning curves of the Clinical Transformer (C-index vs. training epochs), evaluated on the 10 testing splits from the Samstein et al.33 pan-cancer dataset, with and without using GENIE data for model pretraining. e Learning curves of the Clinical Transformer, evaluated on the 10 testing splits from the MYSTIC dataset, with and without using GENIE data for model pretraining. f Learning curves of the Clinical Transformer, evaluated on the 10 testing splits from the MYSTIC dataset, with and without using the Chowell et al. 3 dataset for model pretraining. Source data are provided in the SourceData file.
Fig. 2 Clinical Transformer performance and impact of pretraining. a Kaplan-Meier (KM) curves of the Clinical Transformer applied to the Chowell et al.3 dataset, using the median survival score to stratify patients into high and low populations. b KM curves of Chowell et al.3 random forest model used in the testing dataset (using Chowell et al. optimal pan-cancer cutoff = 0.238). c KM curves for evaluating TMB score in the Chowell et al.3 dataset (cutoff = 10 mutations per megabase [mut/mb]). P-values for HR in (a–c) reported from a Wald statistical test. d Learning curves of the Clinical Transformer (C-index vs. training epochs), evaluated on the 10 testing splits from the Samstein et al.33 pan-cancer dataset, with and without using GENIE data for model pretraining. e Learning curves of the Clinical Transformer, evaluated on the 10 testing splits from the MYSTIC dataset, with and without using GENIE data for model pretraining. f Learning curves of the Clinical Transformer, evaluated on the 10 testing splits from the MYSTIC dataset, with and without using the Chowell et al. 3 dataset for model pretraining. Source data are provided in the SourceData file.CC BY · PubMed Central
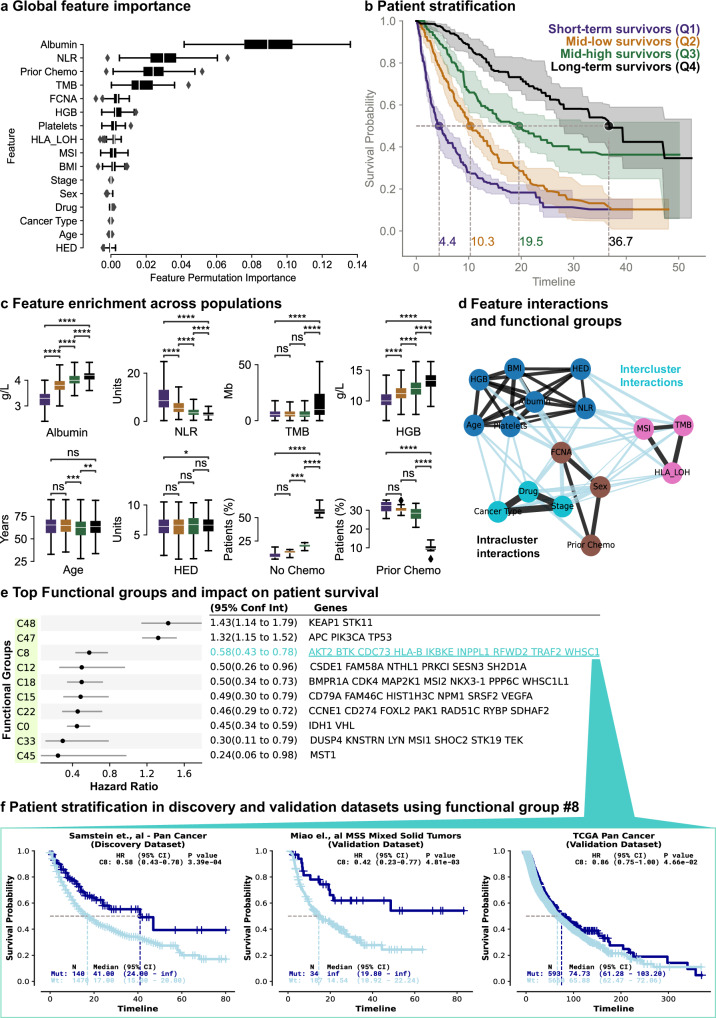
Fig. 3 Patient stratification and model interpretability. a Global feature permutation importance from the Clinical Transformer applied to the Chowell et al.3 dataset. N = 10 permutation test data splits. b KM curves (on 80% train splits) for different population groups defined by four quantile cutoffs from Clinical Transformer survival scores (Q1: n = 241, Q2: n = 304, Q3: n = 330, Q4: n = 303). Dotted lines: median survival time and probability from the 10 models on the train splits. c Raw feature value enrichment in the four populations used to stratify the patients (from the 10 models on 20% test splits; n = 296). Numerical features: y-axis in units of each variable; binary features: y-axis is proportion of patients. Bonferroni-corrected two-sided t test P value: ns, 5.00e-02 < P ≤ 1.00e + 00; *, 1.00e-02 < P ≤ 5.00e-02; **, 1.00e-03 < P ≤ 1.00e-02; ***, 1.00e-04 < P ≤ 1.00e-03; ****, P ≤ 1.00e-04. d, Feature interaction graph derived from cosine interaction scores. Each color depicts one of the four functional groups identified when clustering the feature pairwise cosine similarities in the test sets. Black lines: intracluster interactions; light blue lines: intercluster interactions; line thickness: cosine similarity magnitude. e CoxPH HR (error bars: 95% CI) stratifying by each of the top 10 functional groups in the Samstein et al.33 dataset. Functional group displayed genes capped at 10 for visualization purposes. f KM curves of patients possessing at least 1 mutation in group C8 (Mut) vs. no mutation (Wt), in the discovery dataset (Samstein et al.), and two independent validation datasets (Miao et al.73 and TCGA). Boxplots in (a, c): centerline, median; box limits, quartile 1 and 3; box whiskers, 1.5× interquartile range; diamonds, outliers. Shaded region or error bars in (b, e): 95% confidence interval. HR p-values in (f) from Wald statistical test. Chemo, chemotherapy; MSS, microsatellite stable. Source data are provided in the SourceData file.
Fig. 3 Patient stratification and model interpretability. a Global feature permutation importance from the Clinical Transformer applied to the Chowell et al.3 dataset. N = 10 permutation test data splits. b KM curves (on 80% train splits) for different population groups defined by four quantile cutoffs from Clinical Transformer survival scores (Q1: n = 241, Q2: n = 304, Q3: n = 330, Q4: n = 303). Dotted lines: median survival time and probability from the 10 models on the train splits. c Raw feature value enrichment in the four populations used to stratify the patients (from the 10 models on 20% test splits; n = 296). Numerical features: y-axis in units of each variable; binary features: y-axis is proportion of patients. Bonferroni-corrected two-sided t test P value: ns, 5.00e-02 < P ≤ 1.00e + 00; *, 1.00e-02 < P ≤ 5.00e-02; **, 1.00e-03 < P ≤ 1.00e-02; ***, 1.00e-04 < P ≤ 1.00e-03; ****, P ≤ 1.00e-04. d, Feature interaction graph derived from cosine interaction scores. Each color depicts one of the four functional groups identified when clustering the feature pairwise cosine similarities in the test sets. Black lines: intracluster interactions; light blue lines: intercluster interactions; line thickness: cosine similarity magnitude. e CoxPH HR (error bars: 95% CI) stratifying by each of the top 10 functional groups in the Samstein et al.33 dataset. Functional group displayed genes capped at 10 for visualization purposes. f KM curves of patients possessing at least 1 mutation in group C8 (Mut) vs. no mutation (Wt), in the discovery dataset (Samstein et al.), and two independent validation datasets (Miao et al.73 and TCGA). Boxplots in (a, c): centerline, median; box limits, quartile 1 and 3; box whiskers, 1.5× interquartile range; diamonds, outliers. Shaded region or error bars in (b, e): 95% confidence interval. HR p-values in (f) from Wald statistical test. Chemo, chemotherapy; MSS, microsatellite stable. Source data are provided in the SourceData file.CC BY · PubMed Central
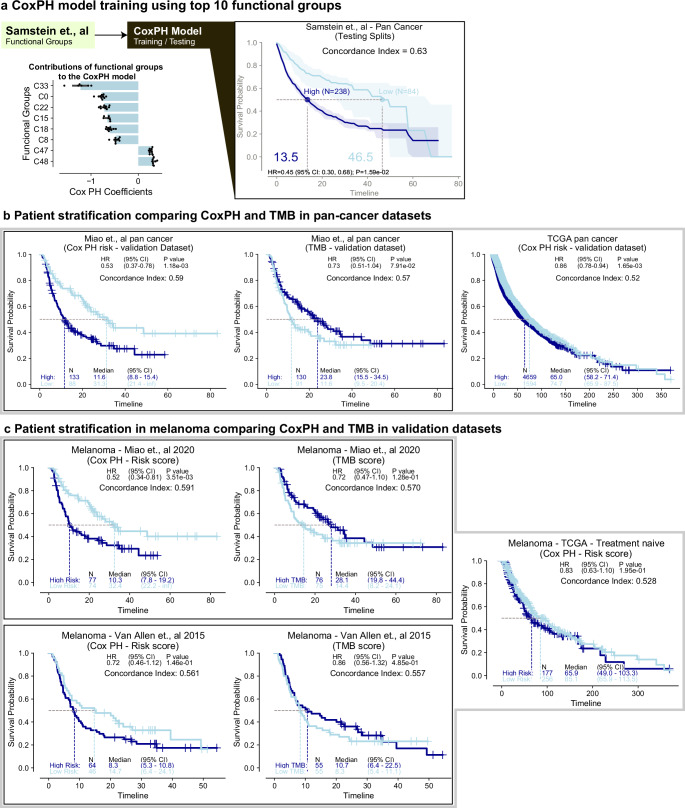
Fig. 4 Using top functional groups to yield a simple and interpretable linear model. a CoxPH model trained on top 10 functional groups derived from Clinical Transformer trained on Samstein et al.33 discovery dataset. Bar plot (mean) depicts distribution of each CoxPH coefficient across only the train splits where the coefficient p-value < 0.05 (Wald test); black dots: individual data points; KM curves of patients from test splits of the 10 models for Samstein et al.33 discovery dataset, stratified by median training set risk score (partial hazard) from the CoxPH model. b KM curves of independent pan-cancer validation datasets, stratified by the CoxPH (trained on Samstein et al. top 10 functional groups) median training set risk score or by TMB in Miao et al.73. IO-treated or TCGA treatment-naïve patients. c, KM curves of independent, melanoma-only validation datasets, stratified by CoxPH (trained on Samstein et al. top 10 functional groups) median training set risk score or by TMB in IO-treated (Miao et al., Van Allen et al.), or treatment-naive (TCGA) patients. Shaded region or error bars in (a): 95% confidence interval. HR p-values in (b, c) from Wald statistical test. TMB cutoff in (b, c) = 10 mut/mb. Source data are provided in the SourceData file.
Fig. 4 Using top functional groups to yield a simple and interpretable linear model. a CoxPH model trained on top 10 functional groups derived from Clinical Transformer trained on Samstein et al.33 discovery dataset. Bar plot (mean) depicts distribution of each CoxPH coefficient across only the train splits where the coefficient p-value < 0.05 (Wald test); black dots: individual data points; KM curves of patients from test splits of the 10 models for Samstein et al.33 discovery dataset, stratified by median training set risk score (partial hazard) from the CoxPH model. b KM curves of independent pan-cancer validation datasets, stratified by the CoxPH (trained on Samstein et al. top 10 functional groups) median training set risk score or by TMB in Miao et al.73. IO-treated or TCGA treatment-naïve patients. c, KM curves of independent, melanoma-only validation datasets, stratified by CoxPH (trained on Samstein et al. top 10 functional groups) median training set risk score or by TMB in IO-treated (Miao et al., Van Allen et al.), or treatment-naive (TCGA) patients. Shaded region or error bars in (a): 95% confidence interval. HR p-values in (b, c) from Wald statistical test. TMB cutoff in (b, c) = 10 mut/mb. Source data are provided in the SourceData file.CC BY · PubMed Central
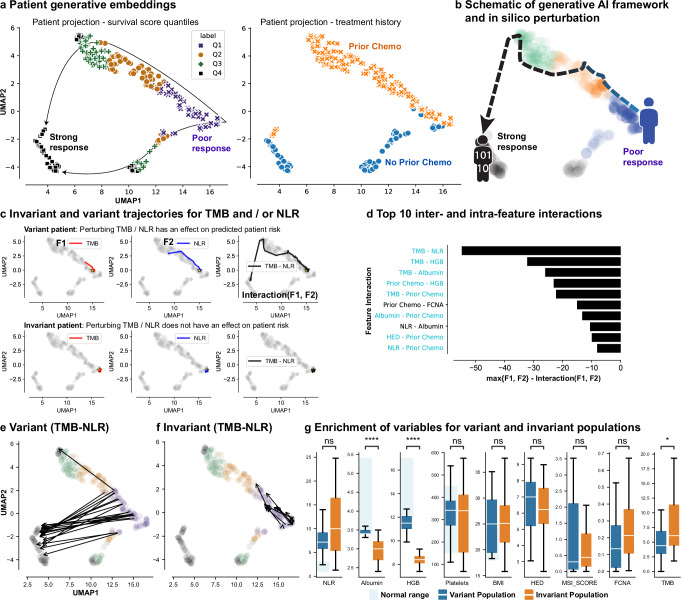
Fig. 5 Impact of functional groups on patient response to IO treatment. a Two-dimensional projection of patient embeddings with UMAP labeled by response of patient populations (left) and by prior chemotherapy (‘chemo,’ right). Each point in the UMAP plane is a patient’s embeddings projection. b Schematic of generative AI framework and expected survival trajectory in the latent space of patients under perturbation. c (variant patient) Response trajectory for a patient who, under perturbation of the top feature interaction (TMB-NLR), moved from poor-response to super-response. (invariant patient) Response trajectory of patient for whom perturbing TMB-NLR interaction does not affect their risk. Yellow star denotes patient starting location in UMAP plane. d Top inter- and intra-feature interactions using the generative module and measuring the impact of perturbing one and two features at a time and calculating the maximum effect of the perturbation for individual and paired features. Interaction values are single point estimates and shaded bars are used to visually represent their magnitude. Blue interaction pairs: intercluster interactions; black interaction pairs: intracluster interactions. e Example of the variant population where patients’ survival scores change upon TMB and NLR perturbations. f Example of the invariant population where patients’ survival scores are mostly unchanged upon TMB and NLR perturbations. g Distribution of clinical and molecular features, as compared across the variant (n = 21) and invariant populations (n = 21). Bonferroni-corrected two-sided t test P value: ns, 5.00e-02 < P ≤ 1.00e + 00; *, 1.00e-02 < P ≤ 5.00e-02; **, 1.00e-03 < P ≤ 1.00e-02; ***, 1.00e-04 < P ≤ 1.00e-03; ****, P ≤ 1.00e-04). Boxplots: centerline, median; box limits, quartile 1 and 3; box whiskers, 1.5x interquartile range; diamonds, outliers; dots, data points. Source data are provided in the SourceData file.
Fig. 5 Impact of functional groups on patient response to IO treatment. a Two-dimensional projection of patient embeddings with UMAP labeled by response of patient populations (left) and by prior chemotherapy (‘chemo,’ right). Each point in the UMAP plane is a patient’s embeddings projection. b Schematic of generative AI framework and expected survival trajectory in the latent space of patients under perturbation. c (variant patient) Response trajectory for a patient who, under perturbation of the top feature interaction (TMB-NLR), moved from poor-response to super-response. (invariant patient) Response trajectory of patient for whom perturbing TMB-NLR interaction does not affect their risk. Yellow star denotes patient starting location in UMAP plane. d Top inter- and intra-feature interactions using the generative module and measuring the impact of perturbing one and two features at a time and calculating the maximum effect of the perturbation for individual and paired features. Interaction values are single point estimates and shaded bars are used to visually represent their magnitude. Blue interaction pairs: intercluster interactions; black interaction pairs: intracluster interactions. e Example of the variant population where patients’ survival scores change upon TMB and NLR perturbations. f Example of the invariant population where patients’ survival scores are mostly unchanged upon TMB and NLR perturbations. g Distribution of clinical and molecular features, as compared across the variant (n = 21) and invariant populations (n = 21). Bonferroni-corrected two-sided t test P value: ns, 5.00e-02 < P ≤ 1.00e + 00; *, 1.00e-02 < P ≤ 5.00e-02; **, 1.00e-03 < P ≤ 1.00e-02; ***, 1.00e-04 < P ≤ 1.00e-03; ****, P ≤ 1.00e-04). Boxplots: centerline, median; box limits, quartile 1 and 3; box whiskers, 1.5x interquartile range; diamonds, outliers; dots, data points. Source data are provided in the SourceData file.CC BY · PubMed Central
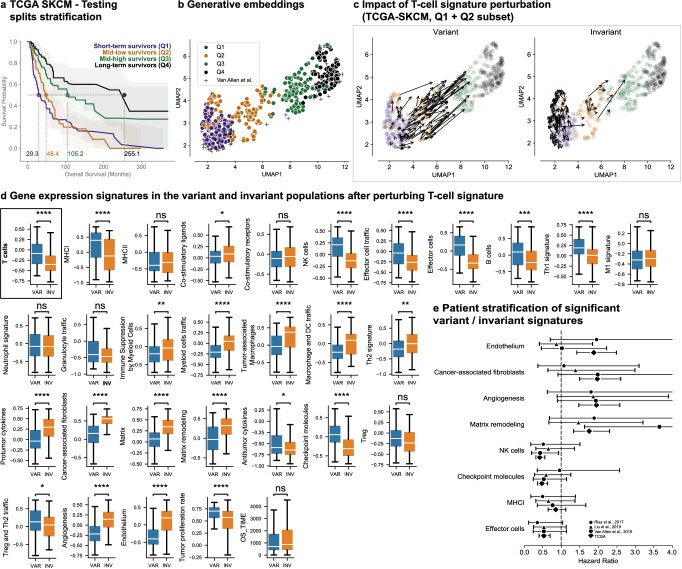
Fig. 6 Clinical Transformer and TME on SKCM data. a Survival stratification of SKCM patients from TCGA. Patients are grouped into quartiles from the Clinical Transformer survival score. The solid line represents the mean survival time across the 10 testing splits. Shaded regions represent the 95% confidence interval. b UMAP projection of patient embeddings in the TCGA SKCM dataset. c Effect of T-cell perturbations (variant and invariant populations) in TCGA SKCM dataset exclusive to patients in the Q1 and Q2 populations. The size and direction of the arrows reflect the effect and directionality, respectively, of the perturbation. d Distribution of TME signatures for the variant (n = 115) and invariant (n = 115) populations as an effect of T-cell perturbations. Bonferroni-corrected two-sided t test P value: ns, 5.00e-02 < P ≤ 1.00e + 00; *, 1.00e-02 < P ≤ 5.00e-02; **, 1.00e-03 < P ≤ 1.00e-02; ***, 1.00e-04 < P ≤ 1.00e-03; ****, P ≤ 1.00e-04). Boxplots: centerline, median; box limits, quartile 1 and 3; box whiskers, 1.5x interquartile range; diamonds, outliers; dots, data points. VAR, variant population; INV, invariant population. e CoxPH HR (error bars: 95% CI) of top gene signatures associated with response and resistance in TCGA and IO-treated populations. N for each comparison can be found in Supplementary Table 6. Source data are provided in the SourceData file.
Fig. 6 Clinical Transformer and TME on SKCM data. a Survival stratification of SKCM patients from TCGA. Patients are grouped into quartiles from the Clinical Transformer survival score. The solid line represents the mean survival time across the 10 testing splits. Shaded regions represent the 95% confidence interval. b UMAP projection of patient embeddings in the TCGA SKCM dataset. c Effect of T-cell perturbations (variant and invariant populations) in TCGA SKCM dataset exclusive to patients in the Q1 and Q2 populations. The size and direction of the arrows reflect the effect and directionality, respectively, of the perturbation. d Distribution of TME signatures for the variant (n = 115) and invariant (n = 115) populations as an effect of T-cell perturbations. Bonferroni-corrected two-sided t test P value: ns, 5.00e-02 < P ≤ 1.00e + 00; *, 1.00e-02 < P ≤ 5.00e-02; **, 1.00e-03 < P ≤ 1.00e-02; ***, 1.00e-04 < P ≤ 1.00e-03; ****, P ≤ 1.00e-04). Boxplots: centerline, median; box limits, quartile 1 and 3; box whiskers, 1.5x interquartile range; diamonds, outliers; dots, data points. VAR, variant population; INV, invariant population. e CoxPH HR (error bars: 95% CI) of top gene signatures associated with response and resistance in TCGA and IO-treated populations. N for each comparison can be found in Supplementary Table 6. Source data are provided in the SourceData file.CC BY · PubMed Central

Verification

Claims the paper makes

The claims and statistics of this paper haven’t been checked yet.

Run the check — free, no account needed. It reads the open-access text and checks the sources it cites.

A few free checks a day · papers already verified open instantly · results are public

Self-check

Percentages, sums and reported differences re-computed from the paper’s own numbers.

The self-check needs the paper’s full text.

Citations

Cites

Research works printed but not linked: 59

  1. 10.1038/nrd.2016.32 · DOI
  2. 10.1038/nrc.2016.56 · DOI
  3. 2022, Improved prediction of immune checkpoint blockade efficacy across multiple cancer types, Nature Biotechnology, 40, 499, 10.1038/s41587-021-01070-8 · DOI
  4. 2022, Multimodal integration of radiology, pathology and genomics for prediction of response to PD-(L) 1 blockade in patients with non-small cell lung cancer, Nature cancer, 3, 1151, 10.1038/s43018-022-00416-8 · DOI · Paper page
  5. Swanson, K. , Wu, E. , Zhang, A. , Alizadeh, A.A. & Zou, J . From patterns to patients: Advances in clinical machine learning for cancer diagnosis, prognosis, and treatment. Cell (2023). · DOI · Paper page
  6. 10.1038/s41586-019-1730-1 · DOI · Paper page
  7. 10.1038/s41591-021-01450-2 · DOI
  8. 10.1056/NEJMoa1501824 · DOI · Paper page
  9. 10.1016/S1470-2045(20)30445-9 · DOI · Paper page
  10. 10.1056/NEJMoa1910231 · DOI · Paper page
  11. Vaswani, A. et al. in 31st Conference on Neural Information Processing Systems 6000-6010 (Long Beach, CA; 2017).
  12. 2020, Language models are few-shot learners, Advances in neural information processing systems, 33, 1877
  13. 2022, Training language models to follow instructions with human feedback, Advances in Neural Information Processing Systems, 35, 27730
  14. Caron, M. et al. in Proceedings of the IEEE/CVF international conference on computer vision 9650–9660 (2021).
  15. 2020, Improved protein structure prediction using potentials from deep learning, Nature, 577, 706, 10.1038/s41586-019-1923-7 · DOI · Paper page
  16. Ni, B. , Kaplan, D.L. & Buehler, M.J . Generative design of de novo proteins based on secondary-structure constraints using an attention-based diffusion model. Chem (2023). · DOI
  17. 2022, ProtGPT2 is a deep unsupervised language model for protein design, Nature communications, 13, 4348, 10.1038/s41467-022-32007-7 · DOI · Paper page
  18. 10.1016/j.neucom.2021.03.091 · DOI · Paper page
  19. Devlin, J. , Chang, M.-W. , Lee, K. & Toutanova, K . Bert: Pre-training of deep bidirectional transformers for language understanding. arXiv preprint arXiv:1810.04805 (2018). · arXiv
  20. 2022, AACR Project GENIE: 100,000 cases and beyond, Cancer Discovery, 12, 2044, 10.1158/2159-8290.CD-21-1547 · DOI
  21. 10.1001/jama.1982.03320430047030 · DOI · Paper page
  22. 10.1016/j.annonc.2020.07.002 · DOI
  23. 10.1016/j.immuni.2018.03.023 · DOI · Paper page
  24. 10.1038/s41588-018-0312-8 · DOI · Paper page
  25. Ma, X. , Long, L. , Moon, S. , Adamson, B.J. & Baxi, S.S . Comparison of population characteristics in real-world clinical oncology databases in the US: Flatiron Health, SEER, and NPCR. MedRxiv, 2020.2003. 2016.20037143 (2020). · DOI
  26. Park, J.C. , Ashok, A. , Liu, C. & Kang, H. Real-World Experience of NTRK Fusion– Positive Thyroid Cancer. JCO Precision Oncology 6 (2022). · DOI
  27. 2020, Explainability for artificial intelligence in healthcare: a multidisciplinary perspective, BMC medical informatics and decision making, 20, 1
  28. 2020, From local explanations to global understanding with explainable AI for trees, Nature machine intelligence, 2, 56, 10.1038/s42256-019-0138-9 · DOI · Paper page
  29. Adebayo, J. et al. Sanity checks for saliency maps. Advances in neural information processing systems 31 (2018).
  30. Molnar, C. et al. in xxAI-Beyond Explainable AI: International Workshop, Held in Conjunction with ICML 2020, July 18, 2020, Vienna, Austria, Revised and Extended Papers 39–68 (Springer, 2022). · DOI · Paper page
  31. 2001, Random forests, Machine learning, 45, 5, 10.1023/A:1010933404324 · DOI · Paper page
  32. 10.1126/science.aaa1348 · DOI · Paper page
  33. Xie, S. , Chen, D. , Zhang, R. & Xue, H. Deep features analysis with attention networks. arXiv preprint arXiv:1901.10042 (2019). · arXiv
  34. Vashishth, S. , Upadhyay, S. , Tomar, G.S. & Faruqui, M. Attention interpretability across nlp tasks. arXiv preprint arXiv:1909.11218 (2019). · arXiv
  35. Vig, J. & Belinkov, Y. Analyzing the structure of attention in a transformer language model. arXiv preprint arXiv:1906.04284 (2019). · DOI · Paper page
  36. Jain, S. & Wallace, B.C. Attention is not explanation. arXiv preprint arXiv:1902.10186 (2019). · arXiv
  37. Rigotti, M. , Miksovic, C. , Giurgiu, I. , Gschwind, T. & Scotton, P. in International Conference on Learning Representations (2022).
  38. Chefer, H. , Gur, S. & Wolf, L. in Proceedings of the IEEE/CVF Conference on Computer Vision and Pattern Recognition 782–791 (2021). · DOI · Paper page
  39. 2022, Pre-treatment serum albumin and mutational burden as biomarkers of response to immune checkpoint blockade, npj Precision Oncology, 6, 23, 10.1038/s41698-022-00267-7 · DOI
  40. Rizzo, A. , Ricci, A.D. & Brandi, G . PD-L1, TMB, MSI, and other predictors of response to immune checkpoint inhibitors in biliary tract cancer. Cancers 13, 558 (2021). · DOI
  41. 10.1093/annonc/mdz134 · DOI
  42. Palmeri, M. et al. Real-world application of tumor mutational burden-high (TMB-high) and microsatellite instability (MSI) confirms their utility as immunotherapy biomarkers. ESMO open 7, 100336 (2022). · DOI
  43. 10.1016/j.lungcan.2022.06.010 · DOI
  44. 10.1136/esmoopen-2020-000706 · DOI
  45. Wohlhieter, C.A. et al. Concurrent mutations in STK11 and KEAP1 promote ferroptosis protection and SCD1 dependence in lung cancer. Cell reports 33, 108444 (2020). · DOI
  46. 10.1038/s41588-018-0200-2 · DOI · Paper page
  47. 10.1126/science.aad0095 · DOI · Paper page
  48. Lan, Z. , et al. in arXiv (2020).
  49. Kojima, T. , Gu, S.S. , Reid, M. , Matsuo, Y. & Iwasawa, Y. Large language models are zero-shot reasoners. arXiv preprint arXiv:2205.11916 (2022). · arXiv
  50. Ethayarajh, K. How contextual are contextualized word representations? comparing the geometry of BERT, ELMo, and GPT-2 embeddings. arXiv preprint arXiv:1909.00512 (2019). · DOI · Paper page
  51. McInnes, L. , Healy, J. & Melville, J. Umap: Uniform manifold approximation and projection for dimension reduction. arXiv preprint arXiv:1802.03426 (2018). · DOI · Paper page
  52. 10.1038/nbt.4314 · DOI · Paper page
  53. 10.1016/J.CCELL.2021.04.014 · DOI · Paper page
  54. 10.1038/s41591-019-0654-5 · DOI · Paper page
  55. 10.1016/j.cell.2017.09.028 · DOI · Paper page
  56. Katzman, J.L. et al. DeepSurv: personalized treatment recommender system using a Cox proportional hazards deep neural network. BMC Med Res Methodol 18, 24 (2018). · DOI · Paper page
  57. Yousefi, S. et al. Predicting clinical outcomes from large scale cancer genomic profiles with deep survival models. Sci Rep 7, 11707 (2017). · DOI
  58. 2021, Transformer-based deep survival analysis, Proc Mach Learn Res, 146, 132
  59. 2020, Hypothesis-free deep survival learning applied to the tumour microenvironment in gastric cancer, The Journal of Pathology: Clinical Research, 6, 273

Metadata

Authors
Arango-Argoty, G., Kipkogei, E., Stewart, R., Patra, A., Kagiampakis, I., & Jacob, E.
Affiliations
  • AstraZeneca (United States) (US)
  • AstraZeneca (United Kingdom) (GB)
Corresponding author
  • Arango-Argoty, Gustavo
  • Jacob, Etai
Venue
Nature Communications
Publisher
openRxiv
Published
2023-09-13
Volume
16
Issue
1
Pages
2101-2101
ISSN
2041-1723 (ISSN-L)
OpenAlex
W4408071852
Cited by
34
References
1
Citations by year
2026: 22 · 2025: 10 · 2024: 2
FWCI
12.69
Type
journal article
Language
en
Open access
Licence
cc-by
Locations
  • Nature Communications (publishedVersion, cc-by)
  • medRxiv (acceptedVersion)
  • Research Square (acceptedVersion, cc-by)
  • PubMed Central (publishedVersion, cc-by)
  • PubMed (publishedVersion)
  • RePEc: Research Papers in Economics (submittedVersion)
  • DOAJ (DOAJ: Directory of Open Access Journals) (submittedVersion, cc-by-sa)
Funders
AstraZeneca
Topics
  • Physical Sciences › Computer Science › Artificial Intelligence › Machine Learning in Healthcare
  • Health Sciences › Medicine › Radiology, Nuclear Medicine and Imaging › Radiomics and Machine Learning in Medical Imaging
  • Life Sciences › Biochemistry, Genetics and Molecular Biology › Cancer Research › Breast Cancer Treatment Studies
Keywords
pre-trained transformer models, tumor response prediction, treatment resistance, survival prediction, biomarkers, self-supervised learning, transfer learning, explainable deep learning, missing data, in silico perturbation, immunotherapy response
MeSH terms
Deep Learning, Humans, Immunotherapy, Neoplasms, Biomarkers, Tumor, Treatment Outcome

About these checks

Registry, retraction, Cites and statistics results are computed, not judged, with one exception: a printed reference that no index lists is read once by a model before it counts as a citation error. Claims are extracted by a model and kept only when their quote appears verbatim in the text; each cited source is then checked, with a model’s help, for whether it says what the claim relies on. Those verdicts can be wrong — read the claim’s quote and the cited source before relying on one.

Statistics and arithmetic are recomputed, not judged.

Confidence bands are shown only for fields calibrated on our annotated test set. None is calibrated yet, so no band is shown.

What counts as a claim ›How we measure confidence ›How we check this ›

Are you an author, or do you see a problem with this page? Request a review