PreprintCited by 28Genetics, Aging, and Longevity in Model OrganismsMuscle Physiology and DisordersNutrition and Health in Aging

The DOI matches its Crossref record; the references it cites are not checked yet.

Age-related changes in human skeletal muscle transcriptome and proteome are more affected by chronic inflammation and physical inactivity than primary aging

Open access

Preprint — published as 10.1111/acel.14098 · Paper page

Abstract

Evaluation of the influence of primary and secondary aging on the manifestation of molecular and cellular hallmarks of aging is a challenging and currently unresolved issue. Our study represents the first demonstration of the distinct role of primary aging and chronic inflammation/physical inactivity – the most important drivers of secondary aging, in the regulation of transcriptomic and proteomic profiles in human skeletal muscle. To achieve this purpose, young healthy people (n=15), young (n=8) and older (n=37) patients with knee/hip osteoarthritis, a model to study the effect of long-term inactivity and chronic inflammation on the vastus lateralis muscle, were included in the study. It was revealed that widespread and substantial age-related changes in gene expression in older patients relative to young healthy people (∼4,000 genes regulating mitochondrial function, proteostasis, cell membrane, secretory and immune response) were related to the long-term physical inactivity and chronic inflammation rather than primary aging. Primary aging contributed mainly to the regulation of genes (∼200) encoding nuclear proteins (regulators of DNA repair, RNA processing, and transcription), mitochondrial proteins (genes encoding respiratory enzymes, mitochondrial complex assembly factors, regulators of cristae formation and mitochondrial reactive oxygen species production), as well as regulators of proteostasis. It was found that proteins associated with aging were regulated mainly at the post-transcriptional level. The set of putative primary aging genes and their potential transcriptional regulators can be used as a resource for further targeted studies investigating the role of individual genes and related transcription factors in the emergence of a senescent cell phenotype.

Overview

The claims and statistics of this paper haven’t been checked yet.

Run the check — free, no account needed. It reads the open-access text and checks the sources it cites.

A few free checks a day · papers already verified open instantly · results are public

Integrity signals

Registry

Crossref · 10.1101/2023.12.01.569524

Cites

Statistics

Figures

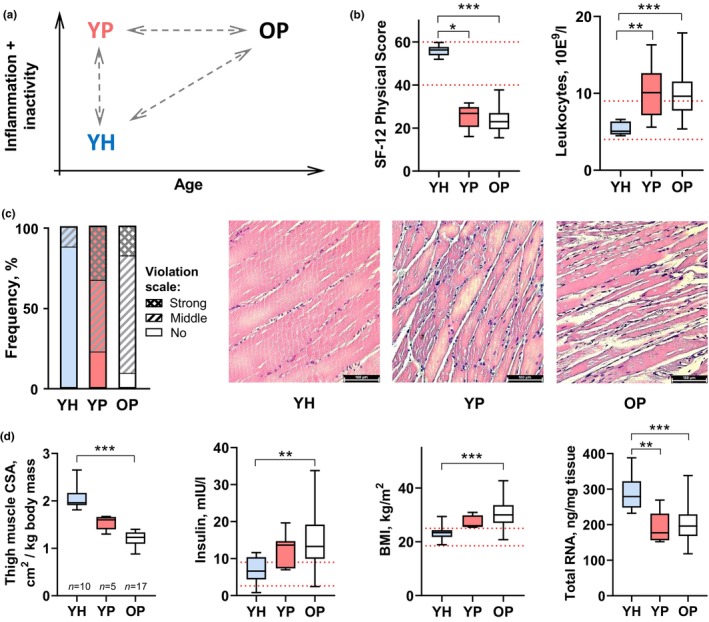
FIGURE 1 Pathology‐ and age‐related physiological changes in young (YP) and older (OP) patients with advanced‐stage, symptomatic knee osteoarthritis compared to young healthy (YH) individuals. (a) Design of the study. (b) Both patient groups demonstrate a substantial decrease in physical status and an increase in the blood leukocyte level, a marker of inflammation. (c, d) In patients, chronic physical inactivity and inflammation led to a comparable violation in the muscle fiber structure (c), a progressive decrease in the specific cross‐sectional area of thigh muscles (CSA), an increase in the baseline insulin level and body mass index [BMI] (markers of metabolic disorders), as well as to a comparable decrease in the total RNA content in M. vastus lateralis (see also Figure S1). The red dotted lines indicate the normal range. YH: n = 15, YP: n = 8, OP: n = 37. *, **, and ***: p < 0.05, <0.01, and <0.001, respectively.
FIGURE 1 Pathology‐ and age‐related physiological changes in young (YP) and older (OP) patients with advanced‐stage, symptomatic knee osteoarthritis compared to young healthy (YH) individuals. (a) Design of the study. (b) Both patient groups demonstrate a substantial decrease in physical status and an increase in the blood leukocyte level, a marker of inflammation. (c, d) In patients, chronic physical inactivity and inflammation led to a comparable violation in the muscle fiber structure (c), a progressive decrease in the specific cross‐sectional area of thigh muscles (CSA), an increase in the baseline insulin level and body mass index [BMI] (markers of metabolic disorders), as well as to a comparable decrease in the total RNA content in M. vastus lateralis (see also Figure S1). The red dotted lines indicate the normal range. YH: n = 15, YP: n = 8, OP: n = 37. *, **, and ***: p < 0.05, <0.01, and <0.001, respectively.CC BY · PubMed Central
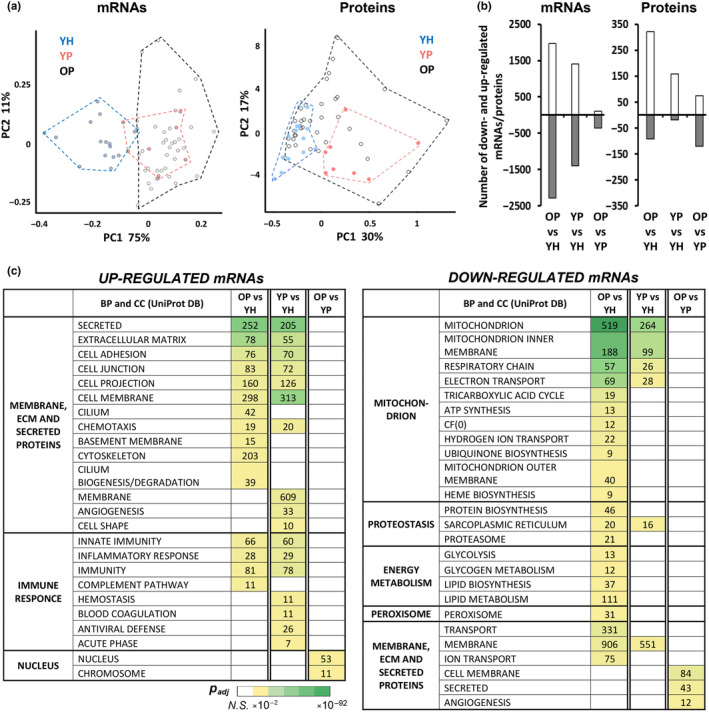
FIGURE 2 Chronic inflammation and physical inactivity are key drivers of age‐related changes in the skeletal muscle transcriptome in older patients relative to young healthy people. (a) Principal component analysis showed that the transcriptomic and proteomic profiles in young healthy people (YH) were markedly different compared to young patients (YP), while the proteomic profiles in young (YP) and older patients (OP) were much more similar. (b) Number of differentially expressed mRNAs and proteins for each comparison. (c) Function enrichment analysis revealed that chronic inflammation and physical inactivity were key drivers of age‐related changes in the skeletal muscle transcriptome. BP and CC, biological processes and cellular components, respectively; the heat map shows the significance level (NS, nonsignificant; see also Table S2). YH: n = 15, YP: n = 8, OP: n = 37.
FIGURE 2 Chronic inflammation and physical inactivity are key drivers of age‐related changes in the skeletal muscle transcriptome in older patients relative to young healthy people. (a) Principal component analysis showed that the transcriptomic and proteomic profiles in young healthy people (YH) were markedly different compared to young patients (YP), while the proteomic profiles in young (YP) and older patients (OP) were much more similar. (b) Number of differentially expressed mRNAs and proteins for each comparison. (c) Function enrichment analysis revealed that chronic inflammation and physical inactivity were key drivers of age‐related changes in the skeletal muscle transcriptome. BP and CC, biological processes and cellular components, respectively; the heat map shows the significance level (NS, nonsignificant; see also Table S2). YH: n = 15, YP: n = 8, OP: n = 37.CC BY · PubMed Central
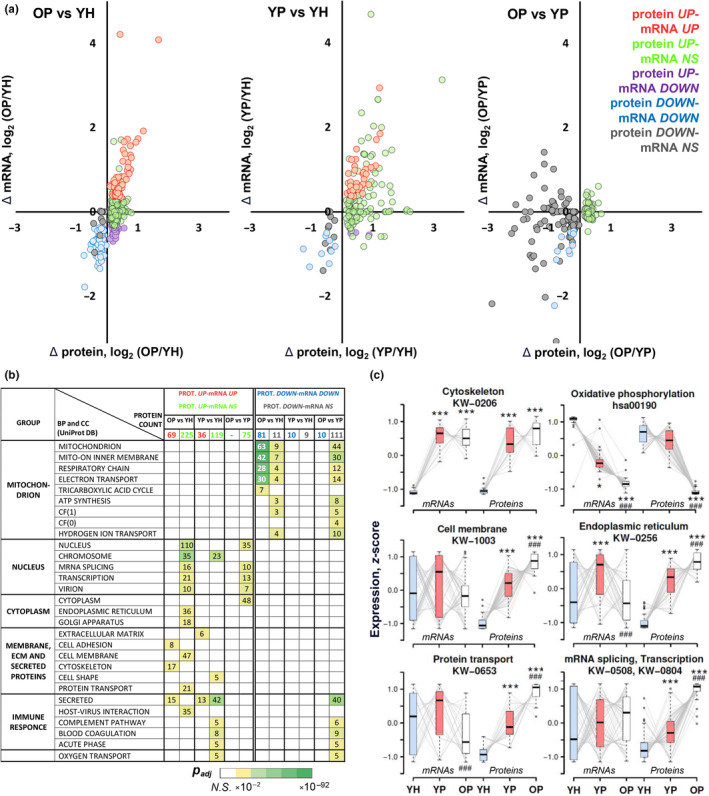
FIGURE 3 Proteins with different functions are differently regulated at the mRNA level, while aging‐related protein changes in patients are regulated mainly at the post‐transcriptional level. (a) Changes in the content of highly abundant proteins are weakly regulated at the mRNA level, especially in the patient groups (OP vs. YP). Different colors represent the protein regulation pattern at the mRNA level. NS – nonsignificant. (b) Function enrichment analysis revealed specific proteomic changes for each comparison. BP and CC, biological processes and cellular components, respectively; the heat map shows the significance level (NS – nonsignificant; see also Table S4). (c) Analysis of the intergroup expression trajectory (YH‐YP‐OP) of differentially expressed proteins belonging to some enriched functional categories and their mRNAs showed that pathology‐ and age‐related changes in the abundance of protein with various functions were differently regulated at the mRNA expression level. Normalized expression (z‐score) for each protein/mRNA, as well as the name and ID of functional categories, are indicated. * – difference from YH, # – difference from YP: one and three symbols – p < 0.05 and <0.001, respectively. YH: n = 15, YP: n = 8, OP: n = 37.
FIGURE 3 Proteins with different functions are differently regulated at the mRNA level, while aging‐related protein changes in patients are regulated mainly at the post‐transcriptional level. (a) Changes in the content of highly abundant proteins are weakly regulated at the mRNA level, especially in the patient groups (OP vs. YP). Different colors represent the protein regulation pattern at the mRNA level. NS – nonsignificant. (b) Function enrichment analysis revealed specific proteomic changes for each comparison. BP and CC, biological processes and cellular components, respectively; the heat map shows the significance level (NS – nonsignificant; see also Table S4). (c) Analysis of the intergroup expression trajectory (YH‐YP‐OP) of differentially expressed proteins belonging to some enriched functional categories and their mRNAs showed that pathology‐ and age‐related changes in the abundance of protein with various functions were differently regulated at the mRNA expression level. Normalized expression (z‐score) for each protein/mRNA, as well as the name and ID of functional categories, are indicated. * – difference from YH, # – difference from YP: one and three symbols – p < 0.05 and <0.001, respectively. YH: n = 15, YP: n = 8, OP: n = 37.CC BY · PubMed Central
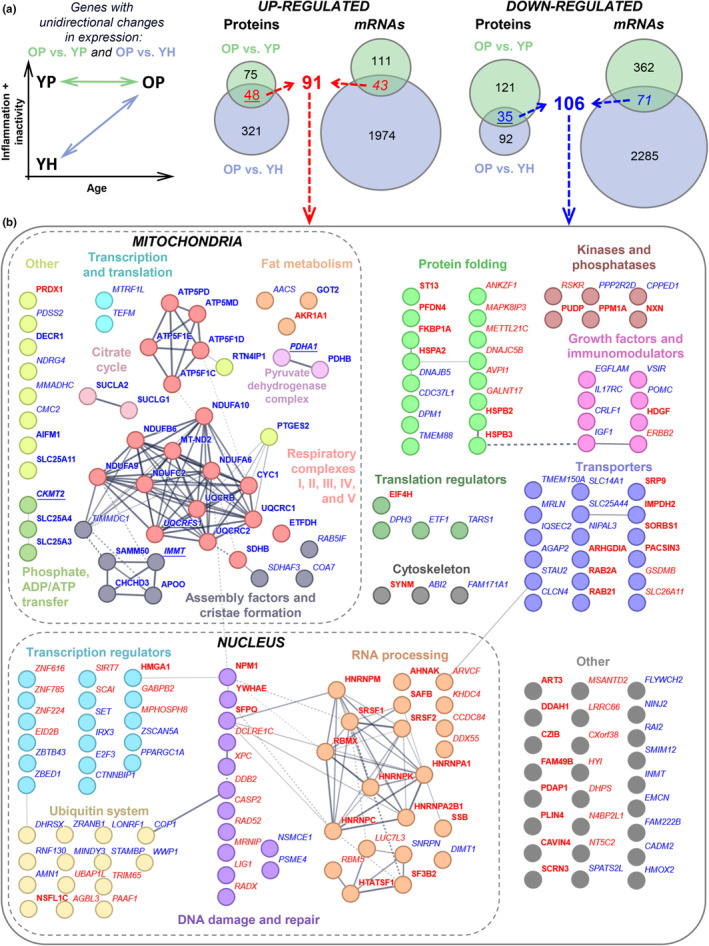
FIGURE 4 Genes associated with primary aging. (a) Genes associated with primary aging were identified as proteins (as well mRNAs) that unidirectionally change expression in both OP vs. YP and OP vs. YH (YH: n = 15, YP: n = 8, OP: n = 37). (b) Functions of primary aging associated genes. Analysis of protein–protein interactions and search of the GO and KEGG BRITE databases revealed the major functional groups of proteins, including proteins interacting with each other. Proteins and mRNAs are shown in italics and bold, respectively: underlining indicates changes in both mRNA and protein level. Up‐ and down‐regulated proteins or mRNAs are shown in red and blue, respectively (see also Table S5). Thicker edges indicate higher protein–protein interaction scores.
FIGURE 4 Genes associated with primary aging. (a) Genes associated with primary aging were identified as proteins (as well mRNAs) that unidirectionally change expression in both OP vs. YP and OP vs. YH (YH: n = 15, YP: n = 8, OP: n = 37). (b) Functions of primary aging associated genes. Analysis of protein–protein interactions and search of the GO and KEGG BRITE databases revealed the major functional groups of proteins, including proteins interacting with each other. Proteins and mRNAs are shown in italics and bold, respectively: underlining indicates changes in both mRNA and protein level. Up‐ and down‐regulated proteins or mRNAs are shown in red and blue, respectively (see also Table S5). Thicker edges indicate higher protein–protein interaction scores.CC BY · PubMed Central
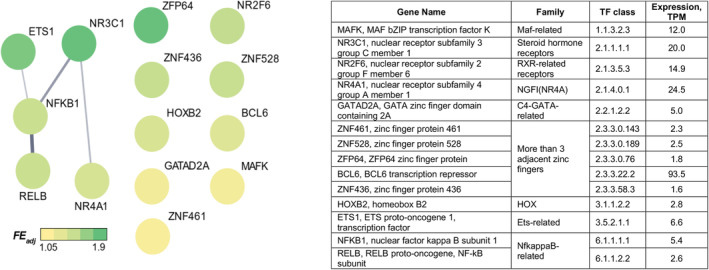
FIGURE 5 Transcriptional factors associated with down‐regulated primary aging genes (mRNAs). The heat map shows adjacent fold enrichment (FEadj, statistically corrected odds ratios with a confidence interval of 99%) for transcription factor binding site frequency in individual promoters of primary aging genes relative to that of random genes showing no differential expression (see also Table S6). Thicker edges indicate higher protein–protein interaction scores.
FIGURE 5 Transcriptional factors associated with down‐regulated primary aging genes (mRNAs). The heat map shows adjacent fold enrichment (FEadj, statistically corrected odds ratios with a confidence interval of 99%) for transcription factor binding site frequency in individual promoters of primary aging genes relative to that of random genes showing no differential expression (see also Table S6). Thicker edges indicate higher protein–protein interaction scores.CC BY · PubMed Central

Verification

Claims the paper makes

The claims and statistics of this paper haven’t been checked yet.

Run the check — free, no account needed. It reads the open-access text and checks the sources it cites.

A few free checks a day · papers already verified open instantly · results are public

Self-check

Percentages, sums and reported differences re-computed from the paper’s own numbers.

The self-check needs the paper’s full text.

Citations

The citation lists haven’t been fetched yet

References 57 · Cited by 28

Research works printed but not linked: 53

  1. 10.1073/pnas.2001788117 · DOI
  2. 10.1186/s13059-020-01990-9 · DOI · Paper page
  3. 1988, Age-related changes in the skeletal muscle cells, Z Gerontol, 21, 83
  4. 10.18632/aging.100702 · DOI · Paper page
  5. 10.1186/s12891-020-03236-y · DOI
  6. 10.1038/s42003-021-01723-z · DOI · Paper page
  7. 10.1113/jphysiol.2011.211888 · DOI · Paper page
  8. Busse, E. W . (1969). Theories of aging. In E. W. Busse , Pfeiffer,E. (Ed.), Behaviour and adaptation in later life (pp. 11-32). Boston: Little, Brown.
  9. 10.1113/jphysiol.2014.279034 · DOI
  10. 10.1152/ajpcell.00014.2015 · DOI
  11. 10.1038/s41586-019-1365-2 · DOI · Paper page
  12. 10.1093/nar/gkz555 · DOI · Paper page
  13. 10.1111/acel.12604 · DOI
  14. 10.1007/s11357-023-00750-4 · DOI
  15. 10.1002/jcsm.12272 · DOI
  16. 10.1113/JP282887 · DOI
  17. 10.7554/eLife.71624 · DOI · Paper page
  18. 10.1111/febs.16337 · DOI
  19. Guimarães, D. , Barrios, N. , de Oliveira, A. , Rizo-Roca, D. , Jollet, M. , Smith, J. , … Silveira, L. (2023). The orphan nuclear receptor Nr2f6 impairs skeletal muscle oxidative capacity and regulates muscle mass in mice. bioRxiv.
  20. 10.1113/JP284142 · DOI
  21. 10.1007/s10522-023-10070-x · DOI
  22. 10.1016/j.celrep.2021.109971 · DOI
  23. 10.1016/j.mad.2006.11.008 · DOI · Paper page
  24. 10.1159/000365947 · DOI · Paper page
  25. 10.1113/JP283836 · DOI
  26. 10.1111/j.1474-9726.2010.00666.x · DOI · Paper page
  27. 10.1038/sj.onc.1202306 · DOI
  28. 10.1002/jcsm.12753 · DOI
  29. 10.2337/db08-0349 · DOI · Paper page
  30. 10.1111/acel.12499 · DOI
  31. 10.1038/ncb3527 · DOI
  32. 10.1016/j.cell.2022.11.001 · DOI · Paper page
  33. 10.1186/s40246-022-00399-8 · DOI
  34. 2020, Regulation of Proteins in Human Skeletal Muscle: The Role of Transcription, Sci.Rep, 10, 3514, 10.1038/s41598-020-60578-2 · DOI
  35. 10.1152/japplphysiol.00830.2016 · DOI
  36. 10.1016/j.celrep.2017.05.054 · DOI · Paper page
  37. 10.1016/j.cell.2016.11.052 · DOI · Paper page
  38. 10.1016/j.mehy.2014.12.003 · DOI
  39. 10.18632/aging.202648 · DOI
  40. 10.2147/CIA.S104674 · DOI · Paper page
  41. 10.1016/j.arr.2010.03.004 · DOI · Paper page
  42. 10.1016/0306-9877(80)90079-1 · DOI
  43. 10.1186/s13395-015-0059-1 · DOI
  44. 10.1152/japplphysiol.00067.2006 · DOI
  45. 10.1080/15476286.2021.1875647 · DOI
  46. 10.1016/j.cell.2023.05.002 · DOI · Paper page
  47. 10.7554/eLife.49874 · DOI
  48. 10.1073/pnas.1916414117 · DOI
  49. 10.1111/j.1474-9726.2009.00481.x · DOI · Paper page
  50. 2019, A deep proteome and transcriptome abundance atlas of 29 healthy human tissues, Mol.Syst.Biol, 15, e8503, 10.15252/msb.20188503 · DOI · Paper page
  51. 10.1097/00005650-199603000-00003 · DOI · Paper page
  52. 10.1073/pnas.0911570106 · DOI · Paper page
  53. 10.1093/bioinformatics/btu640 · DOI

Metadata

Authors
Kurochkina, N. S., Orlova, M. A., Vigovskiy, M. A., Zgoda, V. G., Vepkhvadze, T. F., Vavilov, N. E., Makhnovskii, P. A., Grigorieva, O. A., Boroday, Y. R., Philippov, V. V., Lednev, E. M., Efimenko, A. Y., & Popov, D. V.
Affiliations
  • Russian Academy of Sciences (RU)
  • Lomonosov Moscow State University (RU)
  • Institute of Biomedical Chemistry (RU)
Corresponding author
Efimenko, Anastasia Yu.
Venue
Aging Cell
Publisher
openRxiv
Published
2023-12-04
Volume
23
Issue
4
Pages
e14098-e14098
ISSN
1474-9718 (ISSN-L)
OpenAlex
W4392000166
Cited by
28
References
57
Citations by year
2026: 6 · 2025: 16 · 2024: 6
FWCI
3.39
Type
journal article
Language
en
Open access
Licence
cc-by
Locations
  • Aging Cell (publishedVersion, cc-by)
  • bioRxiv (Cold Spring Harbor Laboratory) (acceptedVersion, cc-by-nc-nd)
  • PubMed Central (publishedVersion, cc-by)
  • PubMed (publishedVersion)
Funders
  • Russian Science Foundation (21-15-00405)
  • Lomonosov Moscow State University
Topics
  • Life Sciences › Biochemistry, Genetics and Molecular Biology › Aging › Genetics, Aging, and Longevity in Model Organisms
  • Life Sciences › Biochemistry, Genetics and Molecular Biology › Molecular Biology › Muscle Physiology and Disorders
  • Health Sciences › Medicine › Physiology (medical) › Nutrition and Health in Aging
Keywords
primary aging, secondary aging, skeletal muscle, transcriptome, proteome, chronic inflammation, physical inactivity, osteoarthritis, vastus lateralis, mitochondrial function, proteostasis, post-transcriptional regulation, senescence, hallmarks of aging, gene expression
MeSH terms
Aged, Humans, Inflammation, Muscle, Skeletal, Proteome, Proteomics, Sedentary Behavior, Transcriptome

About these checks

Registry, retraction, Cites and statistics results are computed, not judged, with one exception: a printed reference that no index lists is read once by a model before it counts as a citation error. Claims are extracted by a model and kept only when their quote appears verbatim in the text; each cited source is then checked, with a model’s help, for whether it says what the claim relies on. Those verdicts can be wrong — read the claim’s quote and the cited source before relying on one.

Statistics and arithmetic are recomputed, not judged.

Confidence bands are shown only for fields calibrated on our annotated test set. None is calibrated yet, so no band is shown.

What counts as a claim ›How we measure confidence ›How we check this ›

Are you an author, or do you see a problem with this page? Request a review

How to cite

Cite CoChat for the checks on this page, and the paper for its own findings.

This page
CoChat. (2026). Citation check: Age-related changes in human skeletal muscle transcriptome and proteome are more affected by chronic inflammation and physical inactivity than primary aging. https://app.cochat.ai/papers/10.1101/2023.12.01.569524
The paper
Kurochkina, N. S., Orlova, M. A., Vigovskiy, M. A., Zgoda, V. G., Vepkhvadze, T. F., Vavilov, N. E., Makhnovskii, P. A., Grigorieva, O. A., Boroday, Y. R., Philippov, V. V., Lednev, E. M., Efimenko, A. Y., & Popov, D. V. (2023). Age-related changes in human skeletal muscle transcriptome and proteome are more affected by chronic inflammation and physical inactivity than primary aging. Aging Cell. https://doi.org/10.1101/2023.12.01.569524