Student or educator? Sign up with your school email and get 6 months of Pro free.
PreprintCited by 1Bacterial Genetics and BiotechnologyAntibiotic Resistance in BacteriaBacteriophages and microbial interactions

The DOI matches its Crossref record; 1 of the 1 references it cites were found in a registry or an index.

Type I partition-related proteins enhance conjugative transfer through transcriptional activation and oriT region binding

Open access

Preprint — published as 10.1128/mbio.01600-25 · Paper page

Abstract

Plasmid partitioning and bacterial conjugation are critical processes ensuring plasmid maintenance and dissemination, respectively, within bacterial populations. Although traditionally regarded as distinct phenomena, these two processes are increasingly recognized as interconnected. While partitioning ensures plasmid inheritance during cell division, its potential influence on conjugative transfer remains poorly understood. A major impediment to understanding their interplay is that partition systems are often essential for plasmid stability, making it difficult to distinguish their direct effects on conjugation. In this study, we addressed this challenge using a mini-conjugative plasmid derived from the Pseudomonas putida NAH7 plasmid. This engineered plasmid, containing all conjugation-related genes, was cloned into an E. coli-compatible vector. Additionally, the par genes from NAH7 were expressed from a separate plasmid to investigate their roles in conjugative transfer. Our results revealed that the par gene cluster plays a significant role in enhancing the conjugative transfer of the mini-conjugative plasmid. Specifically, ParB, a centromere-binding protein, functions as a transcriptional activator of conjugation-related genes with binding parS NAH site. In contrast, ParR, a KorA homolog, was not found to enhance transcription directly but binds extensively to the oriT region. This binding probably facilitates the recruitment or stabilization of the relaxosome, thereby enhancing conjugation efficiency. Together, these findings unveil a previously unappreciated role for partition proteins in stimulating bacterial conjugation, providing new insights into how plasmids coordinate vertical and horizontal dissemination, highlighting that these processes can occur simultaneously within bacterial communities.

Overview

The claims and statistics of this paper haven’t been checked yet.

Run the check — free, no account needed. It reads the open-access text and checks the sources it cites.

A few free checks a day · papers already verified open instantly · results are public

Integrity signals

Registry

Crossref · 10.1101/2025.01.22.634284

Cites

1 of 1 references verified0 citation errors · 0 not checkable

Statistics

Figures

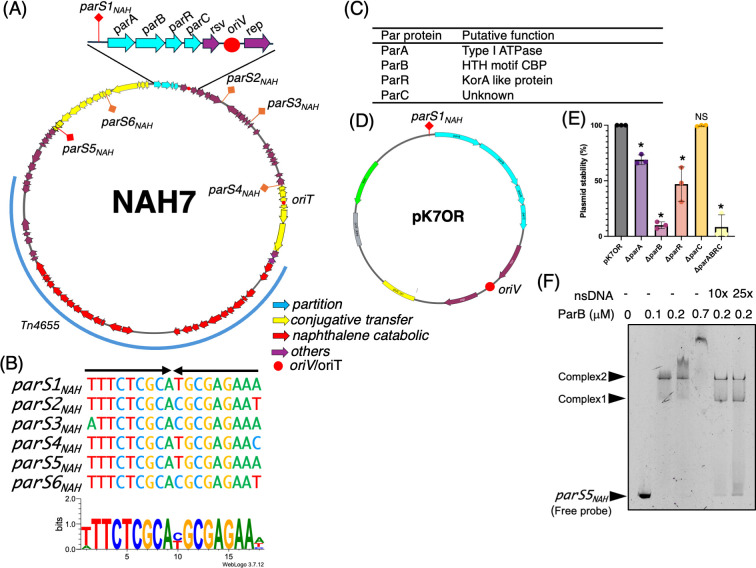
Fig 1 Overview of NAH7 plasmid partition system and characterization of parS sites and Par proteins. (A) Circular map of NAH7. Partitioning genes (parA, parB, parR, and parC) are indicated in cyan, conjugative transfer-related genes are indicated in yellow, naphthalene catabolic genes are shown in red, and other genes are shown in purple. The origin of replication (oriV) and origin of transfer (oriT) are marked with red circles. Six inverted repeat sequences, designated parS1NAH through parS6NAH, are distributed across the plasmid (marked in orange or red). (B) Alignment of the identified parSNAH sites. parSNAH sequences are shown with similarities highlighted, indicating conserved nucleotide patterns, parS1NAH and parS5NAH are perfect inverted repeat sequences, while the other parSNAH sites (parS2NAH through parS4NAH, parS6NAH) contain up to two mismatches. The sequence logo was generated using parS1NAH to parS6NAH with WebLogo (28). (C) Summary table listing the putative functions of the NAH7 partition proteins, based on predictions from InterPro analysis (Fig. S1). (D) Plasmid map of pK7OR, derived from pK18mob, highlighting key genetic elements. The plasmid features the parS1NAH site located upstream of the parA, parB, parR, and parC genes (cyan arrows). The oriV (red circle), resolvase, and rep genes (purple arrows) together support plasmid replication, ensuring its maintenance in host cells. The Km gene (green arrow) provides kanamycin resistance for selection. (E) Plasmid stability assay for pK7OR, with deletions of individual par genes (ΔparA, ΔparB, ΔparR, and ΔparC) and all four par genes, conducted in P. putida KT2440. Stability was measured as the percentage of plasmid-harboring (KmR) colonies out of 100 colonies after 24 hours of growth in non-selective conditions (approximately 10 generations). The assay was performed in three independent biological replicates. The average values were plotted with individual data points, and standard deviations are represented as error bars. Statistical analyses were performed by ordinary one-way ANOVA with Dunnett’s multiple comparisons test, comparing each deletion mutant with pK7OR (*P < 0.005). “NS” denotes no significant difference. (F) Electrophoretic mobility shift assay showing the binding of ParB-His protein to the parS5NAH DNA fragment. Each lane contains an 82 nM FAM-labeled parS5NAH DNA fragment. The final concentrations of ParB-His are shown in the figure. Non-specific competitor DNA (salmon sperm DNA [nsDNA]) was added at concentrations 10-fold and 25-fold higher than the FAM-labeled parS5 DNA fragment. Samples were electrophoresed on a 15% polyacrylamide gel at 200 V for 90 minutes using Tris-glycine buffer. Complex 1 and Complex 2 represent the major shifted bands, while parS5NAH represents the free probe.
Fig 1 Overview of NAH7 plasmid partition system and characterization of parS sites and Par proteins. (A) Circular map of NAH7. Partitioning genes (parA, parB, parR, and parC) are indicated in cyan, conjugative transfer-related genes are indicated in yellow, naphthalene catabolic genes are shown in red, and other genes are shown in purple. The origin of replication (oriV) and origin of transfer (oriT) are marked with red circles. Six inverted repeat sequences, designated parS1NAH through parS6NAH, are distributed across the plasmid (marked in orange or red). (B) Alignment of the identified parSNAH sites. parSNAH sequences are shown with similarities highlighted, indicating conserved nucleotide patterns, parS1NAH and parS5NAH are perfect inverted repeat sequences, while the other parSNAH sites (parS2NAH through parS4NAH, parS6NAH) contain up to two mismatches. The sequence logo was generated using parS1NAH to parS6NAH with WebLogo (28). (C) Summary table listing the putative functions of the NAH7 partition proteins, based on predictions from InterPro analysis (Fig. S1). (D) Plasmid map of pK7OR, derived from pK18mob, highlighting key genetic elements. The plasmid features the parS1NAH site located upstream of the parA, parB, parR, and parC genes (cyan arrows). The oriV (red circle), resolvase, and rep genes (purple arrows) together support plasmid replication, ensuring its maintenance in host cells. The Km gene (green arrow) provides kanamycin resistance for selection. (E) Plasmid stability assay for pK7OR, with deletions of individual par genes (ΔparA, ΔparB, ΔparR, and ΔparC) and all four par genes, conducted in P. putida KT2440. Stability was measured as the percentage of plasmid-harboring (KmR) colonies out of 100 colonies after 24 hours of growth in non-selective conditions (approximately 10 generations). The assay was performed in three independent biological replicates. The average values were plotted with individual data points, and standard deviations are represented as error bars. Statistical analyses were performed by ordinary one-way ANOVA with Dunnett’s multiple comparisons test, comparing each deletion mutant with pK7OR (*P < 0.005). “NS” denotes no significant difference. (F) Electrophoretic mobility shift assay showing the binding of ParB-His protein to the parS5NAH DNA fragment. Each lane contains an 82 nM FAM-labeled parS5NAH DNA fragment. The final concentrations of ParB-His are shown in the figure. Non-specific competitor DNA (salmon sperm DNA [nsDNA]) was added at concentrations 10-fold and 25-fold higher than the FAM-labeled parS5 DNA fragment. Samples were electrophoresed on a 15% polyacrylamide gel at 200 V for 90 minutes using Tris-glycine buffer. Complex 1 and Complex 2 represent the major shifted bands, while parS5NAH represents the free probe.CC BY · PubMed Central
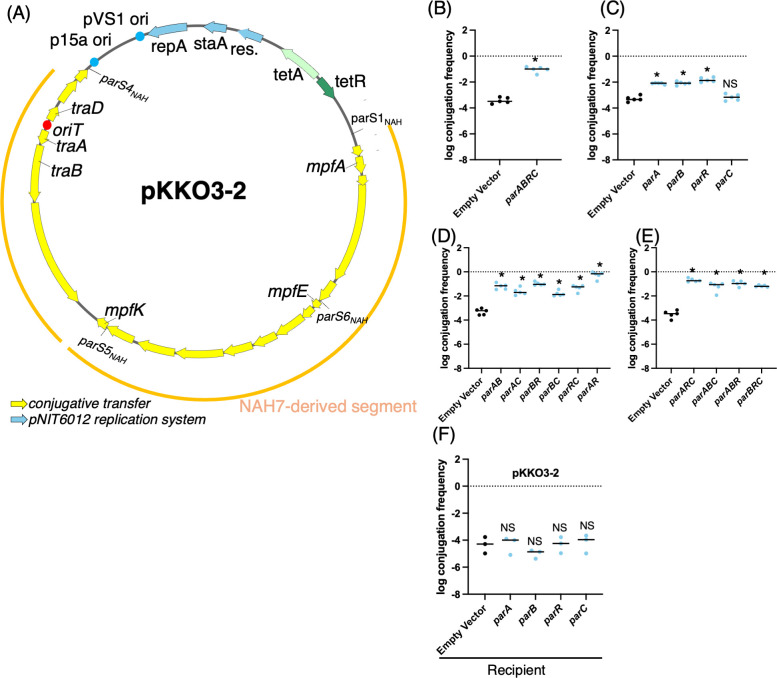
Fig 2 Effects of par genes on conjugative transfer of pKKO3-2. (A) Plasmid map of pKKO3-2. The yellow segments represent genes involved in conjugative transfer derived from NAH7, and the blue arrows represent the pNIT6012 replication system. The locations of four parSNAH sites are shown. (B–E) Conjugative transfer frequency of pKKO3-2 with the expression of different par genes from a pUC18 vector in donor cells. Panel (B) shows the effect of expressing all four par genes (parA, parB, parR, and parC) together, while panels (C–E) represent the effects of expressing different single par genes, as well as various combinations of two or three par genes. (F) Conjugative transfer frequency of pKKO3-2 with the expression of individual par genes from a pUC18 vector in recipient cells. Overnight-grown donor and recipient cells were mixed 1:1 and subjected to solid mating on LB agar containing IPTG at 30°C for 6 hours, after which CFUs on selective plates were counted. Conjugation frequency is shown on a log scale as the number of transconjugants per donor cell (Tc/D). Each experiment was performed at least five times independently. Error bars represent the standard deviation from biological replicates, and individual data points are shown. Statistical analysis for panel (B) was performed using an unpaired two-tailed t-test, while panels (C–F) were analyzed by ordinary one-way ANOVA followed by Dunnett’s multiple comparisons test relative to the strain harboring an empty vector. Asterisks (*P < 0.0001) indicate significant differences compared to Ev. “NS” denotes no significant difference.
Fig 2 Effects of par genes on conjugative transfer of pKKO3-2. (A) Plasmid map of pKKO3-2. The yellow segments represent genes involved in conjugative transfer derived from NAH7, and the blue arrows represent the pNIT6012 replication system. The locations of four parSNAH sites are shown. (B–E) Conjugative transfer frequency of pKKO3-2 with the expression of different par genes from a pUC18 vector in donor cells. Panel (B) shows the effect of expressing all four par genes (parA, parB, parR, and parC) together, while panels (C–E) represent the effects of expressing different single par genes, as well as various combinations of two or three par genes. (F) Conjugative transfer frequency of pKKO3-2 with the expression of individual par genes from a pUC18 vector in recipient cells. Overnight-grown donor and recipient cells were mixed 1:1 and subjected to solid mating on LB agar containing IPTG at 30°C for 6 hours, after which CFUs on selective plates were counted. Conjugation frequency is shown on a log scale as the number of transconjugants per donor cell (Tc/D). Each experiment was performed at least five times independently. Error bars represent the standard deviation from biological replicates, and individual data points are shown. Statistical analysis for panel (B) was performed using an unpaired two-tailed t-test, while panels (C–F) were analyzed by ordinary one-way ANOVA followed by Dunnett’s multiple comparisons test relative to the strain harboring an empty vector. Asterisks (*P < 0.0001) indicate significant differences compared to Ev. “NS” denotes no significant difference.CC BY · PubMed Central
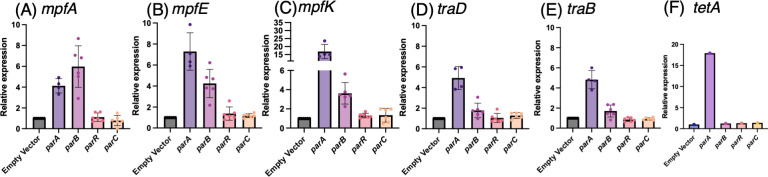
Fig 3 Relative expression levels of conjugative transfer genes in E. coli strains harboring the pKKO3-2 plasmid with individual par gene expression. (A–F) Gene expression levels were quantified using qRT-PCR. The graphs show the relative expression of (A) mpfA, (B) mpfE, (C) mpfK, (D) traD, (E) traB, and (F) tetA. The relative expression values are normalized to the empty vector strain, which is set as 1. The data represent the mean, with each dot corresponding to an independent biological replicate, and individual data points are shown. Error bars indicate standard deviation. For RNA extraction, cultures expressing each par gene were spotted onto IPTG-containing Lysogeny Broth agar plates and incubated before harvesting. RNA samples were treated with DNase I, and reverse transcription was performed using random primers. qRT-PCR was carried out using standard cycling conditions. Specific primer pairs were used to amplify each target gene, and expression levels were normalized to gyrA.
Fig 3 Relative expression levels of conjugative transfer genes in E. coli strains harboring the pKKO3-2 plasmid with individual par gene expression. (A–F) Gene expression levels were quantified using qRT-PCR. The graphs show the relative expression of (A) mpfA, (B) mpfE, (C) mpfK, (D) traD, (E) traB, and (F) tetA. The relative expression values are normalized to the empty vector strain, which is set as 1. The data represent the mean, with each dot corresponding to an independent biological replicate, and individual data points are shown. Error bars indicate standard deviation. For RNA extraction, cultures expressing each par gene were spotted onto IPTG-containing Lysogeny Broth agar plates and incubated before harvesting. RNA samples were treated with DNase I, and reverse transcription was performed using random primers. qRT-PCR was carried out using standard cycling conditions. Specific primer pairs were used to amplify each target gene, and expression levels were normalized to gyrA.CC BY · PubMed Central
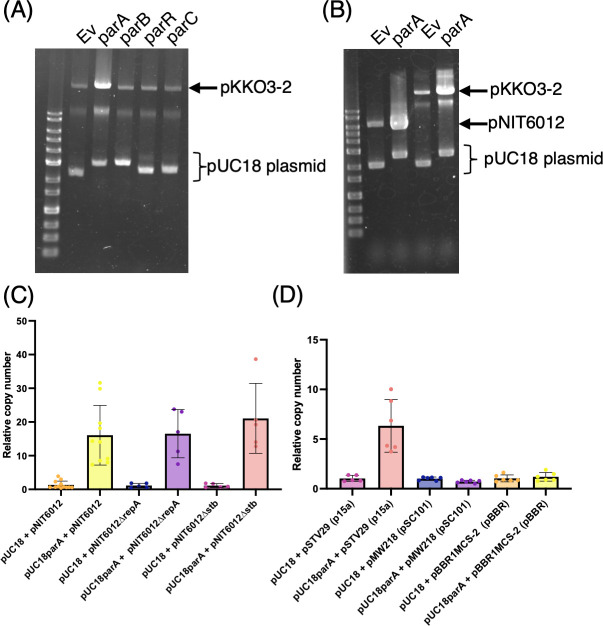
Fig 4 ParA specifically increases the copy number of p15A-based plasmids in E. coli. (A and B) Agarose gel electrophoresis of plasmid preparations from E. coli strains. (A) shows plasmid profiles for E. coli carrying pKKO3-2 and pUC18 derivatives expressing individual par genes (parA, parB, parR, or parC), as indicated above each lane. (B) shows plasmid profiles for E. coli harboring pNIT6012- and pUC18-based expression constructs. Positions of pKKO3-2, pNIT6012, and pUC18 plasmids are indicated. (C and D) Quantification of plasmid copy number by quantitative PCR. Relative plasmid copy number was calculated using gyrA as the internal chromosomal control and specific regions on each plasmid. Bars represent the average values from independent replicates, and error bars indicate standard deviations. The number of biological replicates is shown as individual dots. Detailed methods are described in Materials and Methods. Briefly, cells were grown on Lysogeny Broth agar plates with IPTG induction, and DNA was extracted by boiling the harvested cells.
Fig 4 ParA specifically increases the copy number of p15A-based plasmids in E. coli. (A and B) Agarose gel electrophoresis of plasmid preparations from E. coli strains. (A) shows plasmid profiles for E. coli carrying pKKO3-2 and pUC18 derivatives expressing individual par genes (parA, parB, parR, or parC), as indicated above each lane. (B) shows plasmid profiles for E. coli harboring pNIT6012- and pUC18-based expression constructs. Positions of pKKO3-2, pNIT6012, and pUC18 plasmids are indicated. (C and D) Quantification of plasmid copy number by quantitative PCR. Relative plasmid copy number was calculated using gyrA as the internal chromosomal control and specific regions on each plasmid. Bars represent the average values from independent replicates, and error bars indicate standard deviations. The number of biological replicates is shown as individual dots. Detailed methods are described in Materials and Methods. Briefly, cells were grown on Lysogeny Broth agar plates with IPTG induction, and DNA was extracted by boiling the harvested cells.CC BY · PubMed Central
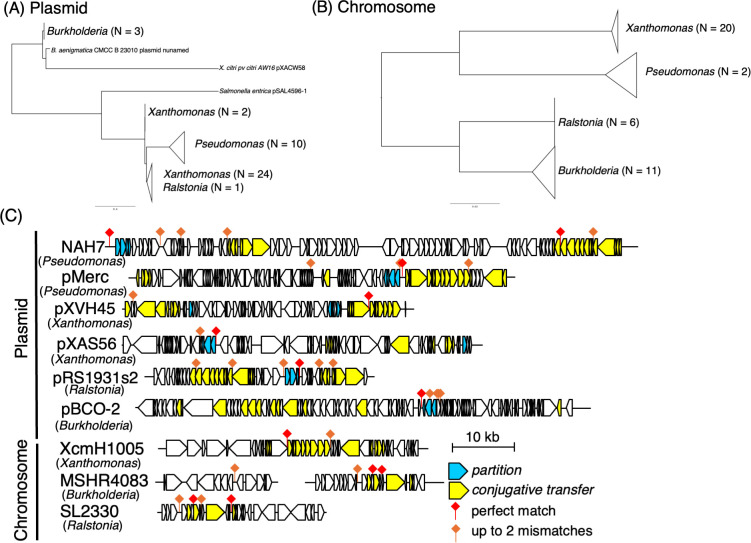
Fig 5 Phylogenetic analysis and distribution of parSNAH sequences in plasmid and chromosomal sequences. (A and B) Phylogenetic trees of sequences containing parS NAH sites. The sequences with perfect matches to parS NAH were identified through BLAST searches. The plasmid-associated tree (A) was constructed based on amino acid sequences of relaxase proteins, while the chromosomal tree (B) was constructed using 16S rRNA gene sequences. Multiple sequence alignments were performed using MAFFT, and phylogenetic trees were visualized with FigTree. In panel A, the number of plasmid sequences belonging to each genus is shown in parentheses. In panel B, collapsed clades represent groups of chromosomal 16S rRNA sequences from the same genus; the number of sequences within each group is indicated. This analysis highlights the phylogenetic diversity of parS NAH-associated elements across genera. (C) Schematic representation of the genomic context surrounding parS1NAH sequences and those with up to two nucleotide mismatches in selected plasmids and chromosomal regions. The parS1NAH sites are indicated by red diamonds (perfect matches) and orange diamonds (up to two mismatches). Genes involved in partitioning (cyan) and conjugative transfer (yellow) are highlighted. The schematic represents the approximate locations of these elements within the 10 kb genomic regions surrounding the parS1NAH sites. For plasmids, the entire sequence length is represented, while for chromosomes, only the surrounding regions containing the repeat sequences are shown. Specifically, for chromosomal sequences: XcmH1005 (GenBank: CP013004) represents positions 187,208–227,688. MSHR4083 (GenBank: CP017050) represents positions 1,091,874–1,109,185 and 1,954,109–1,971,627. SL2330 (GenBank: CP022794) represents positions 594,289–620,391.
Fig 5 Phylogenetic analysis and distribution of parSNAH sequences in plasmid and chromosomal sequences. (A and B) Phylogenetic trees of sequences containing parS NAH sites. The sequences with perfect matches to parS NAH were identified through BLAST searches. The plasmid-associated tree (A) was constructed based on amino acid sequences of relaxase proteins, while the chromosomal tree (B) was constructed using 16S rRNA gene sequences. Multiple sequence alignments were performed using MAFFT, and phylogenetic trees were visualized with FigTree. In panel A, the number of plasmid sequences belonging to each genus is shown in parentheses. In panel B, collapsed clades represent groups of chromosomal 16S rRNA sequences from the same genus; the number of sequences within each group is indicated. This analysis highlights the phylogenetic diversity of parS NAH-associated elements across genera. (C) Schematic representation of the genomic context surrounding parS1NAH sequences and those with up to two nucleotide mismatches in selected plasmids and chromosomal regions. The parS1NAH sites are indicated by red diamonds (perfect matches) and orange diamonds (up to two mismatches). Genes involved in partitioning (cyan) and conjugative transfer (yellow) are highlighted. The schematic represents the approximate locations of these elements within the 10 kb genomic regions surrounding the parS1NAH sites. For plasmids, the entire sequence length is represented, while for chromosomes, only the surrounding regions containing the repeat sequences are shown. Specifically, for chromosomal sequences: XcmH1005 (GenBank: CP013004) represents positions 187,208–227,688. MSHR4083 (GenBank: CP017050) represents positions 1,091,874–1,109,185 and 1,954,109–1,971,627. SL2330 (GenBank: CP022794) represents positions 594,289–620,391.CC BY · PubMed Central
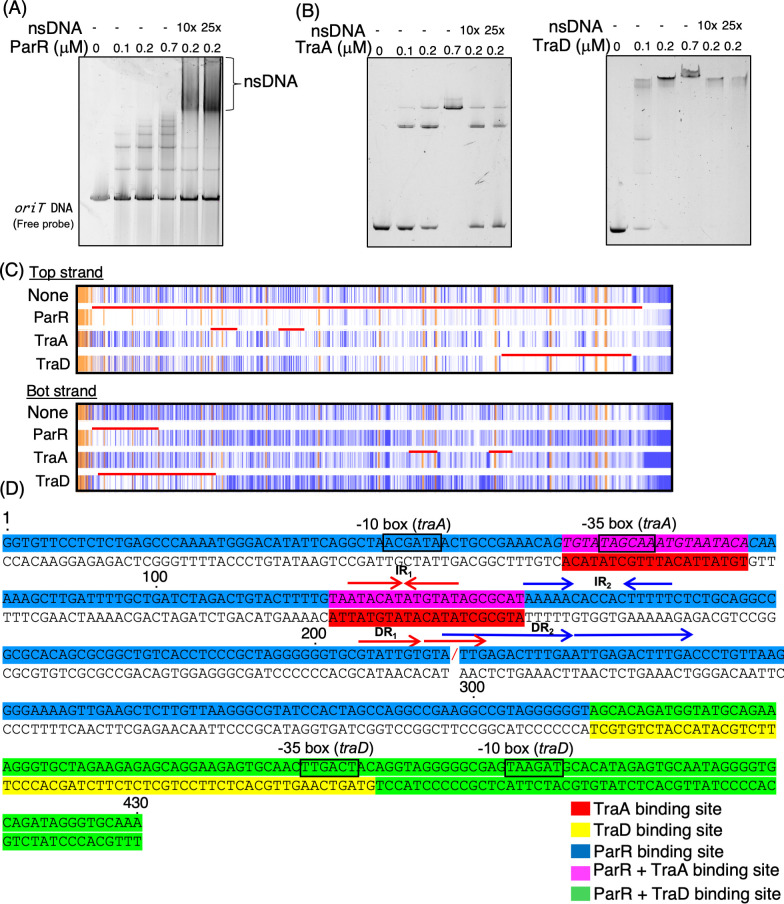
Fig 6 Protein-DNA interactions of ParR, TraA, and TraD with oriT DNA. (A and B) EMSA demonstrating the binding of ParR-Strep, TraA-His, and TraD-His proteins to oriT DNA fragments. (A) EMSA using SYBR Gold staining. A 15 nM oriT DNA fragment was incubated with ParR-Strep at increasing concentrations (0, 0.1, 0.2, and 0.7 µM), with or without the addition of salmon sperm DNA as a non-specific competitor (10× or 25× relative to the labeled probe). Samples were incubated at 30°C for 5 minutes and resolved on a 15% native polyacrylamide gel in Tris-glycine buffer. The gel was stained with SYBR Gold and visualized using the FLAS-T1500 system. (B and C) EMSA using 5′-FAM-labeled oriT DNA probe (45 nM) and TraA-His or TraD-His at indicated concentrations (0, 0.1, 0.2, and 0.7 µM) with or without non-specific competitor DNA (10× or 25×). Gels were imaged directly by detecting FAM fluorescence without post-staining. The lower band represents free (unbound) oriT DNA probe. The “oriT DNA” represents the free DNA probe. (C) DNase I footprinting assay results showing the protection pattern on oriT DNA by ParR-Strep, TraA-His, and TraD-His proteins. The assay was conducted using FAM-labeled oriT DNA fragments to identify the binding regions on both the top and bottom strands. The orange regions represent internal standard markers (GeneScan 500 LIZ size standard), while the blue lines indicate the FAM-labeled oriT DNA fragments obtained after DNase I treatment. DNase I-protected regions indicate protein-DNA interaction sites, with the red line highlighting specific binding regions compared to the “None” control. The data were analyzed using TraceViewer, with corresponding peak data available in Fig. S4 and S5 (D) Sequence analysis of the oriT region, highlighting the binding sites for ParR, TraA, and TraD proteins. This panel was created based on footprinting analysis (B) and G + A ladder data from Fig. S4 and S5. Specific binding sites are color-coded as follows: ParR binding sites are indicated in blue, TraA binding sites in red, and TraD binding sites in orange. Overlapping binding sites between ParR and TraA are shown in purple, while those shared by ParR and TraD are marked in green. “/” indicates the nic site. The -10 and -35 boxes are indicated, representing promoter regions relevant to the transcriptional regulation of conjugative transfer genes. Important IR and DR sequences identified in previous studies as significant for their functions are also annotated.
Fig 6 Protein-DNA interactions of ParR, TraA, and TraD with oriT DNA. (A and B) EMSA demonstrating the binding of ParR-Strep, TraA-His, and TraD-His proteins to oriT DNA fragments. (A) EMSA using SYBR Gold staining. A 15 nM oriT DNA fragment was incubated with ParR-Strep at increasing concentrations (0, 0.1, 0.2, and 0.7 µM), with or without the addition of salmon sperm DNA as a non-specific competitor (10× or 25× relative to the labeled probe). Samples were incubated at 30°C for 5 minutes and resolved on a 15% native polyacrylamide gel in Tris-glycine buffer. The gel was stained with SYBR Gold and visualized using the FLAS-T1500 system. (B and C) EMSA using 5′-FAM-labeled oriT DNA probe (45 nM) and TraA-His or TraD-His at indicated concentrations (0, 0.1, 0.2, and 0.7 µM) with or without non-specific competitor DNA (10× or 25×). Gels were imaged directly by detecting FAM fluorescence without post-staining. The lower band represents free (unbound) oriT DNA probe. The “oriT DNA” represents the free DNA probe. (C) DNase I footprinting assay results showing the protection pattern on oriT DNA by ParR-Strep, TraA-His, and TraD-His proteins. The assay was conducted using FAM-labeled oriT DNA fragments to identify the binding regions on both the top and bottom strands. The orange regions represent internal standard markers (GeneScan 500 LIZ size standard), while the blue lines indicate the FAM-labeled oriT DNA fragments obtained after DNase I treatment. DNase I-protected regions indicate protein-DNA interaction sites, with the red line highlighting specific binding regions compared to the “None” control. The data were analyzed using TraceViewer, with corresponding peak data available in Fig. S4 and S5 (D) Sequence analysis of the oriT region, highlighting the binding sites for ParR, TraA, and TraD proteins. This panel was created based on footprinting analysis (B) and G + A ladder data from Fig. S4 and S5. Specific binding sites are color-coded as follows: ParR binding sites are indicated in blue, TraA binding sites in red, and TraD binding sites in orange. Overlapping binding sites between ParR and TraA are shown in purple, while those shared by ParR and TraD are marked in green. “/” indicates the nic site. The -10 and -35 boxes are indicated, representing promoter regions relevant to the transcriptional regulation of conjugative transfer genes. Important IR and DR sequences identified in previous studies as significant for their functions are also annotated.CC BY · PubMed Central
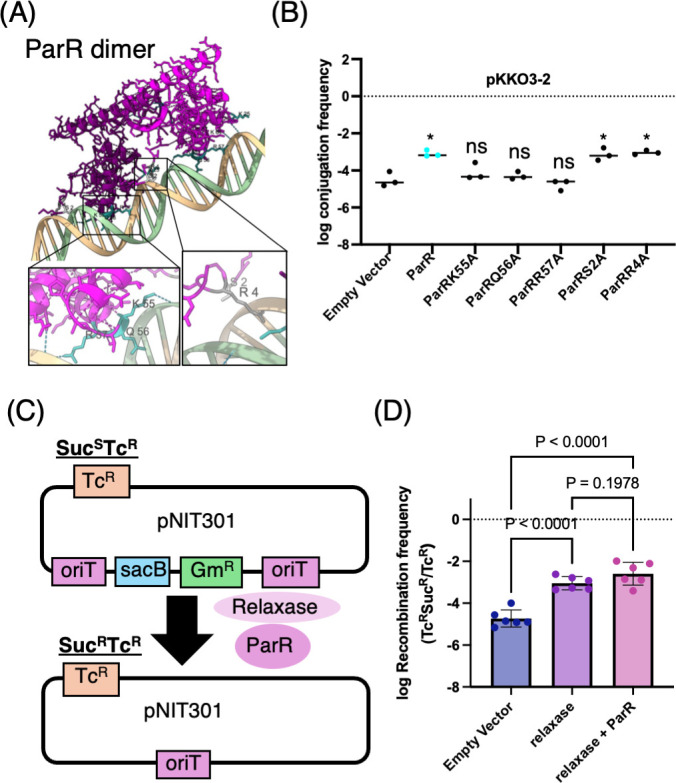
Fig 7 DNA binding by ParR is required for conjugation activation and may assist recombination. (A) Predicted structure of the ParR dimer bound to double-stranded oriT DNA, generated using AlphaFold3. Close-up views highlight residues K55, Q56, and R57 regions, which are predicted to form hydrogen bonds with DNA, and control residues S2 and R4, which are not involved in direct DNA interaction. (B) Effect of point mutations in ParR on conjugative transfer frequency of pKKO3-2. Plasmid transfer assays were performed in E. coli expressing wild-type or mutant ParR proteins. Alanine substitutions of K55, Q56, or R57 abolished the enhancement effect, while S2A and R4A mutants retained activity. Statistical significance was determined by one-way ANOVA followed by Dunnett’s multiple comparisons test (P < 0.05; ns, not significant). (C) Schematic diagram of the site-specific recombination assay using the pNIT301 plasmid, which contains two oriT sites flanking the sacB and GmR cassettes. Recombination between oriT sites excises this region, converting the strain from SucSTcR to SucRTcR. (D) EC100 cells harboring pNIT301 and either pUC18, pUC18­traC, or pKKTH0051 were induced with IPTG to express the respective proteins. After overnight culture, the numbers of tetracycline‐resistant (Tcʳ) and tetracycline-sucrose-resistant (TcSucʳ) colonies were determined. The oriT–oriT recombination frequency based on the recovery of SucR TcR colonies was quantified. Bars represent means ± SD; P-values were determined by one-way ANOVA with Tukey’s test.
Fig 7 DNA binding by ParR is required for conjugation activation and may assist recombination. (A) Predicted structure of the ParR dimer bound to double-stranded oriT DNA, generated using AlphaFold3. Close-up views highlight residues K55, Q56, and R57 regions, which are predicted to form hydrogen bonds with DNA, and control residues S2 and R4, which are not involved in direct DNA interaction. (B) Effect of point mutations in ParR on conjugative transfer frequency of pKKO3-2. Plasmid transfer assays were performed in E. coli expressing wild-type or mutant ParR proteins. Alanine substitutions of K55, Q56, or R57 abolished the enhancement effect, while S2A and R4A mutants retained activity. Statistical significance was determined by one-way ANOVA followed by Dunnett’s multiple comparisons test (P < 0.05; ns, not significant). (C) Schematic diagram of the site-specific recombination assay using the pNIT301 plasmid, which contains two oriT sites flanking the sacB and GmR cassettes. Recombination between oriT sites excises this region, converting the strain from SucSTcR to SucRTcR. (D) EC100 cells harboring pNIT301 and either pUC18, pUC18­traC, or pKKTH0051 were induced with IPTG to express the respective proteins. After overnight culture, the numbers of tetracycline‐resistant (Tcʳ) and tetracycline-sucrose-resistant (TcSucʳ) colonies were determined. The oriT–oriT recombination frequency based on the recovery of SucR TcR colonies was quantified. Bars represent means ± SD; P-values were determined by one-way ANOVA with Tukey’s test.CC BY · PubMed Central
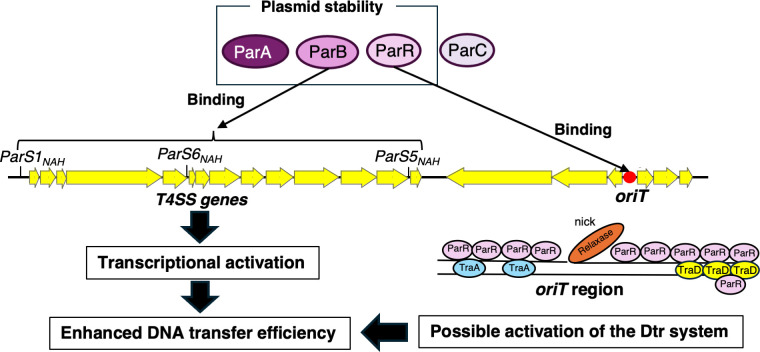
Fig 8 Proposed model of Par proteins in conjugative transfer enhancement in the NAH7 system. This model illustrates the functional roles of ParA, ParB, ParR, and ParC proteins in plasmid stability and conjugative transfer in the NAH7 system. ParA, ParB, and ParR contribute to maintaining plasmid stability within host cells. ParB binds specifically to parSNAH sites (parS1NAH, parS5NAH, and parS6NAH), which are located near the T4SS genes (yellow arrows). The binding of ParB to parS sites results in the transcriptional activation of T4SS-related genes, promoting the assembly of the T4SS and thus enhancing DNA transfer efficiency. At the oriT region, ParR binds specifically, potentially aiding in the recruitment of conjugative machinery and interacting with relaxase and T4SS components, such as TraA and TraD. This interaction may help facilitate the initiation of DNA transfer, promoting the Dtr system during conjugation.
Fig 8 Proposed model of Par proteins in conjugative transfer enhancement in the NAH7 system. This model illustrates the functional roles of ParA, ParB, ParR, and ParC proteins in plasmid stability and conjugative transfer in the NAH7 system. ParA, ParB, and ParR contribute to maintaining plasmid stability within host cells. ParB binds specifically to parSNAH sites (parS1NAH, parS5NAH, and parS6NAH), which are located near the T4SS genes (yellow arrows). The binding of ParB to parS sites results in the transcriptional activation of T4SS-related genes, promoting the assembly of the T4SS and thus enhancing DNA transfer efficiency. At the oriT region, ParR binds specifically, potentially aiding in the recruitment of conjugative machinery and interacting with relaxase and T4SS components, such as TraA and TraD. This interaction may help facilitate the initiation of DNA transfer, promoting the Dtr system during conjugation.CC BY · PubMed Central

Verification

Claims the paper makes

The claims and statistics of this paper haven’t been checked yet.

Run the check — free, no account needed. It reads the open-access text and checks the sources it cites.

A few free checks a day · papers already verified open instantly · results are public

Self-check

Percentages, sums and reported differences re-computed from the paper’s own numbers.

The self-check needs the paper’s full text.

Citations

Cites

Show all 1 references

Research works printed but not linked: 47

  1. 10.1111/1574-6976.12085 · DOI · Paper page
  2. Waksman G . 2019. From conjugation to T4S systems in Gram-negative bacteria: a mechanistic biology perspective. EMBO Rep 20. · DOI
  3. 10.1111/mmi.14507 · DOI
  4. 10.1006/jmbi.1997.1082 · DOI
  5. 10.1038/s41579-023-00974-3 · DOI
  6. 10.1111/mmi.14670 · DOI
  7. Bouet JY , Funnell BE . 2019. Plasmid Localization and Partition in Enterobacteriaceae. EcoSal Plus 8. · DOI
  8. 10.1016/j.plasmid.2011.08.003 · DOI
  9. 10.1016/j.plasmid.2023.102694 · DOI
  10. Baxter JC , Funnell BE . 2014. Plasmid Partition Mechanisms. Microbiol Spectr 2. · DOI
  11. 10.1016/j.plasmid.2008.02.001 · DOI
  12. 10.1128/AEM.03541-15 · DOI
  13. Tisma M , Kaljevic J , Gruber S , Le TBK , Dekker C. 2024. Connecting the dots: key insights on ParB for chromosome segregation from single-molecule studies. FEMS Microbiol Rev 48. · DOI
  14. 2016, Conjugative DNA Transfer Is Enhanced by Plasmid R1 Partitioning Proteins, Front Mol Biosci, 3, 32
  15. 10.1099/mic.0.2008/017939-0 · DOI
  16. 10.1101/2024.09.03.610885:2024.09.03.610885 · DOI
  17. Kishida K , Inoue K , Ohtsubo Y , Nagata Y , Tsuda M . 2017. Host Range of the Conjugative Transfer System of IncP-9 Naphthalene-Catabolic Plasmid NAH7 and Characterization of Its oriT Region and Relaxase. Appl Environ Microbiol 83. · DOI
  18. Kishida K , Nonoyama S , Lukas T , Kawahara S , Kudo K , Nagata Y , Ohtsubo Y , Tsuda M . 2019. Conjugative Transfer of IncP-9 Catabolic Plasmids Requires a Previously Uncharacterized Gene, mpfK, Whose Homologs Are Conserved in Various MPF(T)-Type Plasmids. Appl Environ Microbiol 85. · DOI
  19. Sakuda A , Suzuki-Minakuchi C , Okada K , Nojiri H. 2018. Conjugative Selectivity of Plasmids Is Affected by Coexisting Recipient Candidates. mSphere 3. · DOI
  20. 10.1111/1574-6968.12188 · DOI
  21. 10.1128/JB.00709-08 · DOI
  22. 10.1128/AEM.02571-13 · DOI
  23. 10.1007/978-4-431-54520-0_5 · DOI
  24. 10.1094/MPMI.2000.13.2.232 · DOI
  25. 10.1128/mra.00394-22 · DOI
  26. 10.1128/JB.00185-06 · DOI
  27. 10.1371/journal.pgen.1004171 · DOI
  28. 10.3389/fmicb.2020.01125 · DOI
  29. 10.1128/mBio.01629-21 · DOI
  30. 2022, IncFV plasmid pED208: Sequence analysis and evidence for translocation of maintenance/leading region proteins through diverse type IV secretion systems, Plasmid, 123-124, 102652, 10.1016/j.plasmid.2022.102652 · DOI
  31. 10.1128/mbio.01629-21 · DOI
  32. 10.1128/JB.183.3.1022-1031.2001 · DOI
  33. McLean TC , Balaguer-Perez F , Chandanani J , Thomas CM , Aicart-Ramos C , Burick S , Olinares PDB , Gobbato G , Mundy JE , Chait BT . 2024. Molecular switching of a DNA-sliding clamp to a repressor mediates long-range gene silencing. bioRxiv:2024.02.16.579611. · DOI
  34. 10.1128/mbio.02143-23 · DOI
  35. 10.1111/mmi.15147 · DOI
  36. 10.1038/sj.emboj.7601696 · DOI
  37. 10.1016/0378-1119(87)90149-1 · DOI
  38. 10.1016/0378-1119(83)90040-9 · DOI
  39. 1992, DNA sequencing by the chemical method, Current Protocols in Molecular Biology, 17, 7.5. 1
  40. 10.1038/srep41769 · DOI
  41. 10.1038/S41586-024-07487-W · DOI · Paper page
  42. 10.1093/nar/gkae869 · DOI
  43. 2017, MAFFT online service: multiple sequence alignment, interactive sequence choice and visualization, Briefings in Bioinformatics, 20, 1160
  44. 10.1093/nar/gkae268 · DOI · Paper page
  45. 10.1101/gr.849004 · DOI · Paper page
  46. 10.1016/0022-2836(86)90385-2 · DOI
  47. 10.1007/s00253-006-0671-4 · DOI

Metadata

Authors
Kishida, K., Kudo, K., Kumagai, R., Deng, W., Stari, L., Ogawa-Kishida, N., Ohtsubo, Y., Nagata, Y., & Tsuda, M.
Affiliations
Tohoku University (JP)
Corresponding author
Kishida, Kouhei
Venue
mBio
Publisher
openRxiv
Published
2025-01-22
Volume
16
Issue
9
Pages
e0160025-e0160025
ISSN
2150-7511 (ISSN-L)
OpenAlex
W4412782267
Cited by
1
References
1
Citations by year
2026: 1
FWCI
0.58
Type
journal article
Language
en
Open access
Locations
  • mBio (publishedVersion, cc-by)
  • bioRxiv (Cold Spring Harbor Laboratory) (acceptedVersion)
  • Europe PMC (PubMed Central) (publishedVersion, cc-by)
  • PubMed (publishedVersion)
  • PubMed Central (publishedVersion, cc-by)
  • DOAJ (DOAJ: Directory of Open Access Journals) (submittedVersion, cc-by-sa)
Funders
  • Institute for Fermentation, Osaka (Y-2024-1-007)
  • Japan Society for the Promotion of Science (19K15725, 21H05315)
Topics
  • Life Sciences › Biochemistry, Genetics and Molecular Biology › Genetics › Bacterial Genetics and Biotechnology
  • Health Sciences › Medicine › Microbiology (medical) › Antibiotic Resistance in Bacteria
  • Life Sciences › Immunology and Microbiology › Virology › Bacteriophages and microbial interactions
Keywords
plasmid partitioning, bacterial conjugation, ParB, parr, transcriptional activation, relaxosome, plasmid maintenance, plasmid dissemination, horizontal gene transfer
MeSH terms
Bacterial Proteins, Conjugation, Genetic, Escherichia coli, Multigene Family, Plasmids, Protein Binding, Transcriptional Activation, Gene Expression Regulation, Bacterial, Pseudomonas putida, Replication Origin

About these checks

Registry, retraction, Cites and statistics results are computed, not judged, with one exception: a printed reference that no index lists is read once by a model before it counts as a citation error. Claims are extracted by a model and kept only when their quote appears verbatim in the text; each cited source is then checked, with a model’s help, for whether it says what the claim relies on. Those verdicts can be wrong — read the claim’s quote and the cited source before relying on one.

Statistics and arithmetic are recomputed, not judged.

Confidence bands are shown only for fields calibrated on our annotated test set. None is calibrated yet, so no band is shown.

What counts as a claim ›How we measure confidence ›How we check this ›

Are you an author, or do you see a problem with this page? Request a review

How to cite

Cite CoChat for the checks on this page, and the paper for its own findings.

This page
CoChat. (2026). Citation check: Type I partition-related proteins enhance conjugative transfer through transcriptional activation and oriT region binding. https://app.cochat.ai/papers/10.1101/2025.01.22.634284
The paper
Kishida, K., Kudo, K., Kumagai, R., Deng, W., Stari, L., Ogawa-Kishida, N., Ohtsubo, Y., Nagata, Y., & Tsuda, M. (2025). Type I partition-related proteins enhance conjugative transfer through transcriptional activation and oriT region binding. mBio. https://doi.org/10.1101/2025.01.22.634284

Data sources

Bibliographic data: Semantic Scholar, OpenAlex, Crossref.

Contains information from the Semantic Scholar Academic Graph Datasets, made available under the ODC Attribution License (ODC-BY 1.0).

Semantic Scholar’s data is described in: Kinney, R., et al. (2023). The Semantic Scholar Open Data Platform. arXiv:2301.10140.