PreprintCited by 10Protein Structure and DynamicsMachine Learning in BioinformaticsComputational Drug Discovery Methods

The DOI matches its Crossref record; 2 of the 2 references it cites were found in a registry or an index.

Efficient protein structure generation with sparse denoising models

Open access
Jendrusch, Michael, Korbel, Jan O.·2025·Nature Machine Intelligence

Preprint — published as 10.1038/s42256-025-01100-z · Paper page

Abstract

Generating designable protein backbones has become an integral part of machine learning-assisted approaches to protein design. Together with sequence design and structure predictor-based filtering, it forms the backbone of the computational protein design pipeline. However, current protein structure generators face important limitations for large proteins and require retraining for protein design tasks unseen during model training. To address the first issue, we introduce salad , a family of s parse al l- a tom d enoising models for protein backbone generation. Our models are notably faster than the state-of-the-art while matching or improving designability and diversity, and generate designable structures for protein lengths up to 1,000 amino acids. To address the second issue, we combine salad with structure-editing, a strategy for expanding the capability of protein denoising models to unseen tasks. We apply our approach to a variety of protein design tasks, from motif-scaffolding to multi-state protein design, demonstrating the flexibility of salad and structure-editing.

Overview

The claims and statistics of this paper haven’t been checked yet.

Run the check — free, no account needed. It reads the open-access text and checks the sources it cites.

A few free checks a day · papers already verified open instantly · results are public

Integrity signals

Registry

Crossref · 10.1101/2025.01.31.635780

Cites

2 of 2 references verified0 citation errors · 0 not checkable

Statistics

Figures

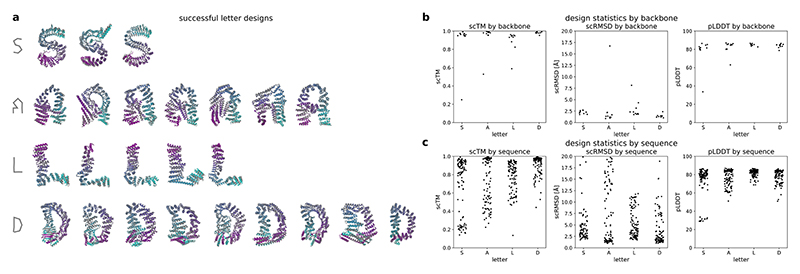
Extended Data Fig. 1 Letter shape generation. (a) Successfully designed letter shapes for letters (S, A, L, D). The designed structure (grey) is overlaid with the best ESMfold prediction (coloured by residue index) out of 10 ProteinMPNN sequences. (b, c) scRMSD, scTM and pLDDT for each backbone (b, n = 10) or designed sequence (c, n = 110, 1 salad sequence and 10 ProteinMPNN sequences per backbone) across all letter designs.
Extended Data Fig. 1 Letter shape generation. (a) Successfully designed letter shapes for letters (S, A, L, D). The designed structure (grey) is overlaid with the best ESMfold prediction (coloured by residue index) out of 10 ProteinMPNN sequences. (b, c) scRMSD, scTM and pLDDT for each backbone (b, n = 10) or designed sequence (c, n = 110, 1 salad sequence and 10 ProteinMPNN sequences per backbone) across all letter designs.CC BY · PubMed Central
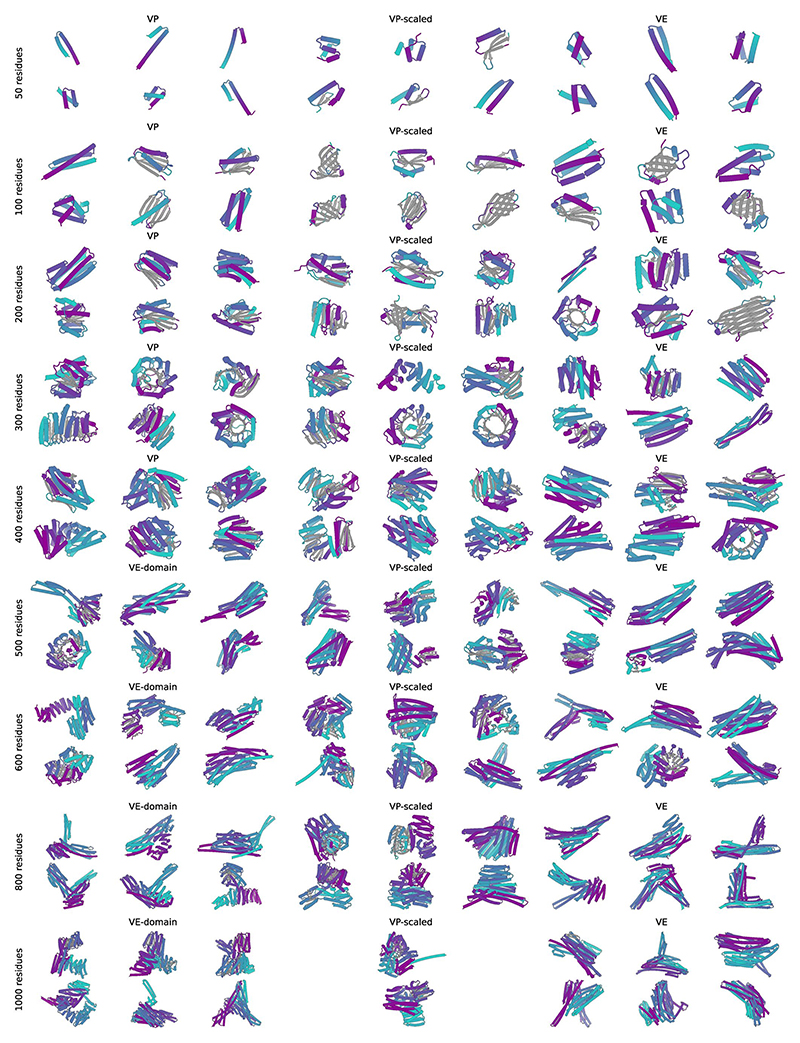
Extended Data Fig. 2 Example unconditional monomer designs. Monomers of length 50, 100, 200, 300, 400, 500, 600, 800 and 1,000 residues, using VP, VP-scaled and VE models with and without domain-like noise. Designs shown are the first up to 6 designs with scRMSD < 2.0 Å and pLDDT > 70 for each length and model type. Structures are coloured by residue index (N-terminus: purple, C-terminus: turquoise) and beta sheets are coloured in grey.
Extended Data Fig. 2 Example unconditional monomer designs. Monomers of length 50, 100, 200, 300, 400, 500, 600, 800 and 1,000 residues, using VP, VP-scaled and VE models with and without domain-like noise. Designs shown are the first up to 6 designs with scRMSD < 2.0 Å and pLDDT > 70 for each length and model type. Structures are coloured by residue index (N-terminus: purple, C-terminus: turquoise) and beta sheets are coloured in grey.CC BY · PubMed Central
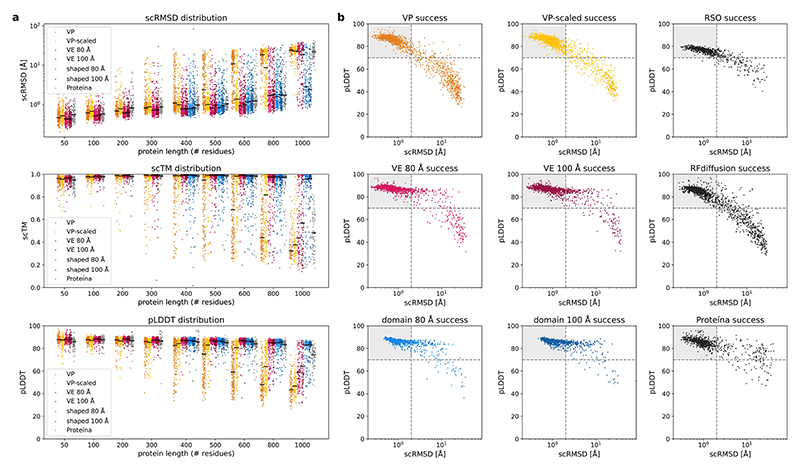
Extended Data Fig. 3 Unconditional monomer designability statistics. (A) Distributions of scRMSD, scTM between generated and ESMfold-predicted structures as well as ESMfold pLDDT for each backbone, taking the best value over 8 ProteinMPNN sequences for each backbone. Each point corresponds to a backbone. Points are coloured and grouped by model type and noise schedule. The solid black lines indicate the median value for each model. (b) Joint distributions of ESMfold scRMSD and pLDDT over all structures generated with salad models with results for RSO and RFdiffusion shown from comparison (results were obtained from [27]). Scatterplots are coloured as in (a). The dashed lines indicate the success cutoff values of scRMSD < 2.0 Å and pLDDT > 70 and the shaded area corresponds to the area of successful designs. Based on n = 200 generated backbones per condition.
Extended Data Fig. 3 Unconditional monomer designability statistics. (A) Distributions of scRMSD, scTM between generated and ESMfold-predicted structures as well as ESMfold pLDDT for each backbone, taking the best value over 8 ProteinMPNN sequences for each backbone. Each point corresponds to a backbone. Points are coloured and grouped by model type and noise schedule. The solid black lines indicate the median value for each model. (b) Joint distributions of ESMfold scRMSD and pLDDT over all structures generated with salad models with results for RSO and RFdiffusion shown from comparison (results were obtained from [27]). Scatterplots are coloured as in (a). The dashed lines indicate the success cutoff values of scRMSD < 2.0 Å and pLDDT > 70 and the shaded area corresponds to the area of successful designs. Based on n = 200 generated backbones per condition.CC BY · PubMed Central
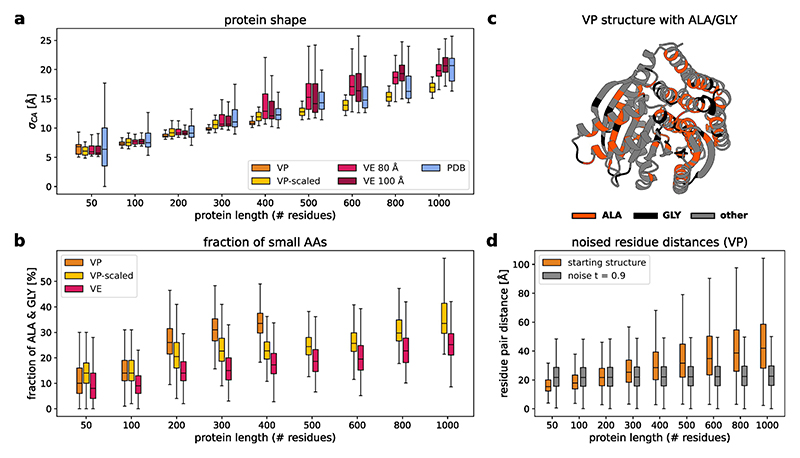
Extended Data Fig. 4 Impacts of VP noise on protein shape and sequence composition. (a) Boxplot of CA atom position standard deviations for protein structures in the PDB and backbones generated using different noise schedules. σCA distributions are shown for protein lengths between 50 and 1,000 residues. VP noise consistently produces highly-compact backbones with low σCA, while VP-scaled and VE noise result in higher σCA structures more closely matching the σCA of proteins in the PDB. (b) Boxplots of the fraction of alanine (ALA) and glycine (GLY) residues in sequence designs for backbones generated using VP, VP-scaled and VE diffusion. A high proportion of ALA and GLY residues in a designed sequence coincides with the presence of tightly-packed secondary structure elements with no space for more bulky amino acids. The fraction of small amino acids increases with protein length for all models but shows a particularly pronounced increase for structures generated using VP noise. In comparison, VP-scaled and VE models show a slower increase and an overall lower fraction of ALA and GLY residues. (c) Example structure of a 400 residue backbone generated using VP noise. ALA (GLY) residues are marked in red (black). (d) Boxplot of amino acid pair CA distances for proteins of size 50 to 400. Distributions of distances are shown for noise-free structures (orange) and noised structures at diffusion time t = 0.9. At low protein lengths (50 - 200), a VP model needs to decrease CA distances to denoise the structure, whereas at high protein lengths (>= 300 residues) it needs to increase CA distances to arrive at the denoised structure. A VP model mostly trained on smaller proteins will therefore likely develop a bias for lower CA distances resulting in overly compact, undesignable structures. (a, b, d) For all box plots, the center line indicates the median, box boundaries the 1st and 3rd quartiles and whiskers 1.5 × the inter-quartile range from the box. Distributions were computed over n = 200 generated backbones for each protein length.
Extended Data Fig. 4 Impacts of VP noise on protein shape and sequence composition. (a) Boxplot of CA atom position standard deviations for protein structures in the PDB and backbones generated using different noise schedules. σCA distributions are shown for protein lengths between 50 and 1,000 residues. VP noise consistently produces highly-compact backbones with low σCA, while VP-scaled and VE noise result in higher σCA structures more closely matching the σCA of proteins in the PDB. (b) Boxplots of the fraction of alanine (ALA) and glycine (GLY) residues in sequence designs for backbones generated using VP, VP-scaled and VE diffusion. A high proportion of ALA and GLY residues in a designed sequence coincides with the presence of tightly-packed secondary structure elements with no space for more bulky amino acids. The fraction of small amino acids increases with protein length for all models but shows a particularly pronounced increase for structures generated using VP noise. In comparison, VP-scaled and VE models show a slower increase and an overall lower fraction of ALA and GLY residues. (c) Example structure of a 400 residue backbone generated using VP noise. ALA (GLY) residues are marked in red (black). (d) Boxplot of amino acid pair CA distances for proteins of size 50 to 400. Distributions of distances are shown for noise-free structures (orange) and noised structures at diffusion time t = 0.9. At low protein lengths (50 - 200), a VP model needs to decrease CA distances to denoise the structure, whereas at high protein lengths (>= 300 residues) it needs to increase CA distances to arrive at the denoised structure. A VP model mostly trained on smaller proteins will therefore likely develop a bias for lower CA distances resulting in overly compact, undesignable structures. (a, b, d) For all box plots, the center line indicates the median, box boundaries the 1st and 3rd quartiles and whiskers 1.5 × the inter-quartile range from the box. Distributions were computed over n = 200 generated backbones for each protein length.CC BY · PubMed Central
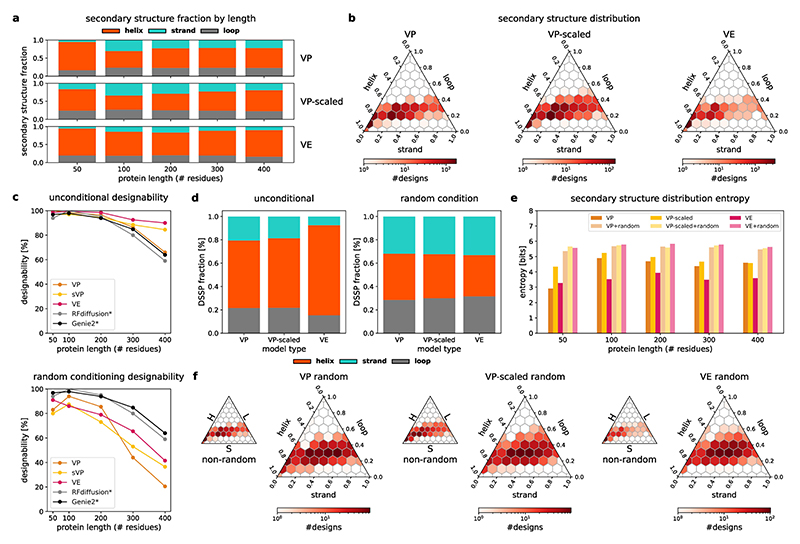
Extended Data Fig. 5 Effects of random secondary structure conditioning on diversity and designability. (a) Secondary structure fraction for protein structures between 50 and 400 residues generated using unconditional sampling from salad VP, VP-scaled and VE models. (b) Ternary plots of the distribution of secondary structure contents in generated backbones of length 50 to 400 residues using salad VP, VP-scaled and VE. (c) Designability of salad VP, VP-scaled (sVP) and VE generated structures for proteins of length 50 to 400 residues compared to results for Genie2 and RFdiffusion. (top) designability for unconditional generation; (bottom) designability for random conditioning for salad models compared to unconditional generation for RFdiffusion / Genie2. (d) Overall secondary structure distribution for unconditional (left) and randomly conditioned (right) generations for proteins of length 50 to 400 using salad VP, VP-scaled and VE models. (e) Bar graph of binned secondary structure distribution entropy for unconditional and randomly conditioned generations of length 50 to 400. The binned secondary structure distributions were constructed by subdividing the range of helix and strand percentages into 20x20 bins of equal size. (f) Ternary plots of the distribution of secondary structure content for all generated structures between 50 and 400 residues using salad VP, VP-scaled and VE models with unconditional sampling (inset) and random conditioning.
Extended Data Fig. 5 Effects of random secondary structure conditioning on diversity and designability. (a) Secondary structure fraction for protein structures between 50 and 400 residues generated using unconditional sampling from salad VP, VP-scaled and VE models. (b) Ternary plots of the distribution of secondary structure contents in generated backbones of length 50 to 400 residues using salad VP, VP-scaled and VE. (c) Designability of salad VP, VP-scaled (sVP) and VE generated structures for proteins of length 50 to 400 residues compared to results for Genie2 and RFdiffusion. (top) designability for unconditional generation; (bottom) designability for random conditioning for salad models compared to unconditional generation for RFdiffusion / Genie2. (d) Overall secondary structure distribution for unconditional (left) and randomly conditioned (right) generations for proteins of length 50 to 400 using salad VP, VP-scaled and VE models. (e) Bar graph of binned secondary structure distribution entropy for unconditional and randomly conditioned generations of length 50 to 400. The binned secondary structure distributions were constructed by subdividing the range of helix and strand percentages into 20x20 bins of equal size. (f) Ternary plots of the distribution of secondary structure content for all generated structures between 50 and 400 residues using salad VP, VP-scaled and VE models with unconditional sampling (inset) and random conditioning.CC BY · PubMed Central
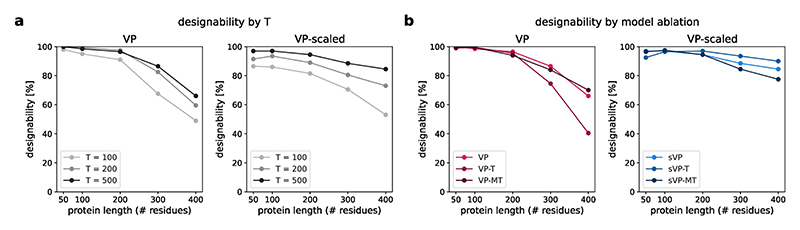
Extended Data Fig. 6 Impact of sampling steps and model architecture on designability. (a) ESMfold designability for 8 ProteinMPNN sequences per backbone of length 50 to 400 residues for salad VP and VP-scaled models at 100, 200 or 500 denoising steps. (b) ESMfold designability as in (a) for salad VP and VP-scaled (sVP) models at 500 denoising steps, as well as variants without diffusion time embedding (-T) and additionally using only minimal distance and orientation pair features (-MT).
Extended Data Fig. 6 Impact of sampling steps and model architecture on designability. (a) ESMfold designability for 8 ProteinMPNN sequences per backbone of length 50 to 400 residues for salad VP and VP-scaled models at 100, 200 or 500 denoising steps. (b) ESMfold designability as in (a) for salad VP and VP-scaled (sVP) models at 500 denoising steps, as well as variants without diffusion time embedding (-T) and additionally using only minimal distance and orientation pair features (-MT).CC BY · PubMed Central
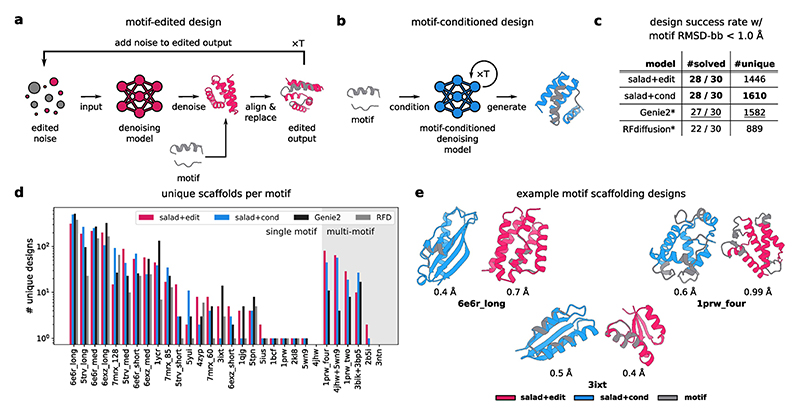
Extended Data Fig. 7 Motif scaffolding. (a) Schematic of the output-editing procedure for motif scaffolding. (b) Schematic of model conditioning for motif scaffolding. (c) Table of unique successful designs on the motif scaffolding benchmark established by Lin et al. 20242 using structure editing and model conditioning. Results for RFdiffusion and Genie2 are shown as reported by Lin et al. 20242. (d) Bar plot of the number of unique successful designs (as measured by single-linkage clustering at TM score < 0.6) out of n = 1,000 generated backbones for salad models with editing and conditioning, compared to results reported in Lin et al. 2024. All evaluations were performed with the same settings as Lin et al. 20242. (e) Example structures of scaffolded motifs using structure editing and model conditioning. All displayed structures are ESMfold predictions of designed sequences with the motifs marked in grey. Motif RMSD is reported below each structure.
Extended Data Fig. 7 Motif scaffolding. (a) Schematic of the output-editing procedure for motif scaffolding. (b) Schematic of model conditioning for motif scaffolding. (c) Table of unique successful designs on the motif scaffolding benchmark established by Lin et al. 20242 using structure editing and model conditioning. Results for RFdiffusion and Genie2 are shown as reported by Lin et al. 20242. (d) Bar plot of the number of unique successful designs (as measured by single-linkage clustering at TM score < 0.6) out of n = 1,000 generated backbones for salad models with editing and conditioning, compared to results reported in Lin et al. 2024. All evaluations were performed with the same settings as Lin et al. 20242. (e) Example structures of scaffolded motifs using structure editing and model conditioning. All displayed structures are ESMfold predictions of designed sequences with the motifs marked in grey. Motif RMSD is reported below each structure.CC BY · PubMed Central
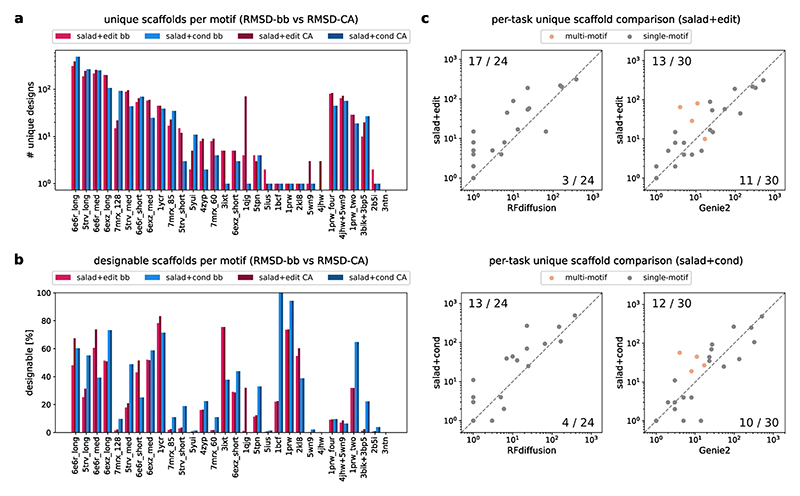
Extended Data Fig. 8 Additional motif scaffolding performance metrics. (a) Number of unique scaffolds out of n = 1,000 generated per motif-scaffolding problem using backbone atom (N, CA, C, O) RMSD (bb) and CA RMSD (CA) as a threshold for success. Results are shown for both structure-editing (salad+edit) and motif conditioned models (salad+cond). (b) Percentage of successful designs for each motif-scaffolding problem. (c) Scatter plots comparing the number of unique successful scaffolds for all single (n = 24) and multi-motif (n = 6) scaffolding tasks between salad models and state-of-the-art diffusion models (Genie2, RFdiffusion). The x and y axes show the number of unique scaffolds for each model. Points on the dashed line correspond to motifs with an equal number of designs for both methods. For points above the line, salad is better; for points below the line RFdiffusion/Genie2 is better. The number of points above and below the line is listed in the upper left and lower right corners.
Extended Data Fig. 8 Additional motif scaffolding performance metrics. (a) Number of unique scaffolds out of n = 1,000 generated per motif-scaffolding problem using backbone atom (N, CA, C, O) RMSD (bb) and CA RMSD (CA) as a threshold for success. Results are shown for both structure-editing (salad+edit) and motif conditioned models (salad+cond). (b) Percentage of successful designs for each motif-scaffolding problem. (c) Scatter plots comparing the number of unique successful scaffolds for all single (n = 24) and multi-motif (n = 6) scaffolding tasks between salad models and state-of-the-art diffusion models (Genie2, RFdiffusion). The x and y axes show the number of unique scaffolds for each model. Points on the dashed line correspond to motifs with an equal number of designs for both methods. For points above the line, salad is better; for points below the line RFdiffusion/Genie2 is better. The number of points above and below the line is listed in the upper left and lower right corners.CC BY · PubMed Central
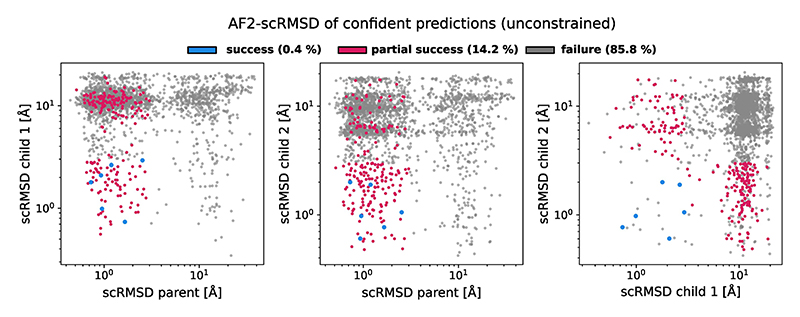
Extended Data Fig. 9 Design success for unconstrained multi-state design. Scatter plots of scRMSD for parent and child designs generated only with secondary structure conditioning, without fixing parts of the structure across denoising processes. Only designed sequences with AF2-pLDDT > 75 are shown. Successful designs (0.4 % of backbones) are shown in blue, partially successful designs (14.2 %) in red and failed designs (85.8 %) in grey. n = 1,000 structures generated and evaluated per condition.
Extended Data Fig. 9 Design success for unconstrained multi-state design. Scatter plots of scRMSD for parent and child designs generated only with secondary structure conditioning, without fixing parts of the structure across denoising processes. Only designed sequences with AF2-pLDDT > 75 are shown. Successful designs (0.4 % of backbones) are shown in blue, partially successful designs (14.2 %) in red and failed designs (85.8 %) in grey. n = 1,000 structures generated and evaluated per condition.CC BY · PubMed Central
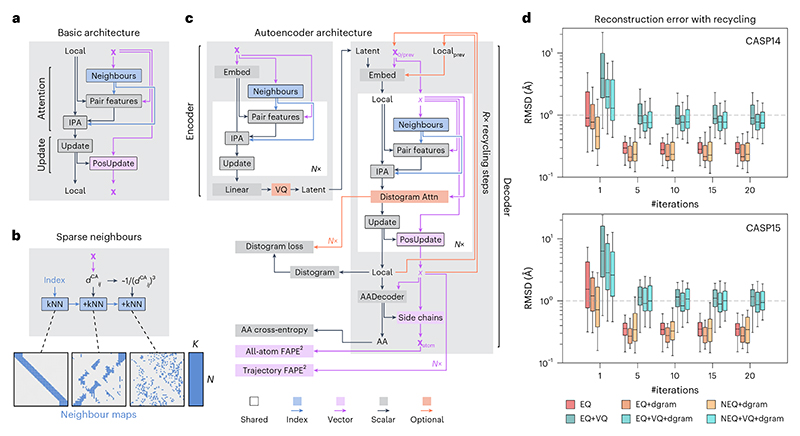
Fig. 1 Sparse model architecture. a, Schematic of the basic block of our architecture. b, Schematic of neighbour selection using residue index, nearest and random neighbours. c, Architecture of our sparse protein autoencoder. d, Sparse model performance on an autoencoding task. Box plots of scRMSD between the ground-truth and decoded structures for multiple sparse architectures: equivariant (EQ) and non-equivariant (NEQ). Optionally, we use predicted distograms for neighbour selection (dgram) and vector quantization (VQ). Measures of reconstruction performance are shown per number of model recycling iterations. The dotted line indicates the threshold of 1 Å for reconstruction at atomic precision. The box centre line indicates the median, the boundaries indicate the 1st and 3rd quartiles, and whiskers show the 1st or 3rd quartile + 1.5 times the interquartile range based on n = 34 CASP14 test structures and n = 45 CASP15 test structures.
Fig. 1 Sparse model architecture. a, Schematic of the basic block of our architecture. b, Schematic of neighbour selection using residue index, nearest and random neighbours. c, Architecture of our sparse protein autoencoder. d, Sparse model performance on an autoencoding task. Box plots of scRMSD between the ground-truth and decoded structures for multiple sparse architectures: equivariant (EQ) and non-equivariant (NEQ). Optionally, we use predicted distograms for neighbour selection (dgram) and vector quantization (VQ). Measures of reconstruction performance are shown per number of model recycling iterations. The dotted line indicates the threshold of 1 Å for reconstruction at atomic precision. The box centre line indicates the median, the boundaries indicate the 1st and 3rd quartiles, and whiskers show the 1st or 3rd quartile + 1.5 times the interquartile range based on n = 34 CASP14 test structures and n = 45 CASP15 test structures.CC BY · PubMed Central
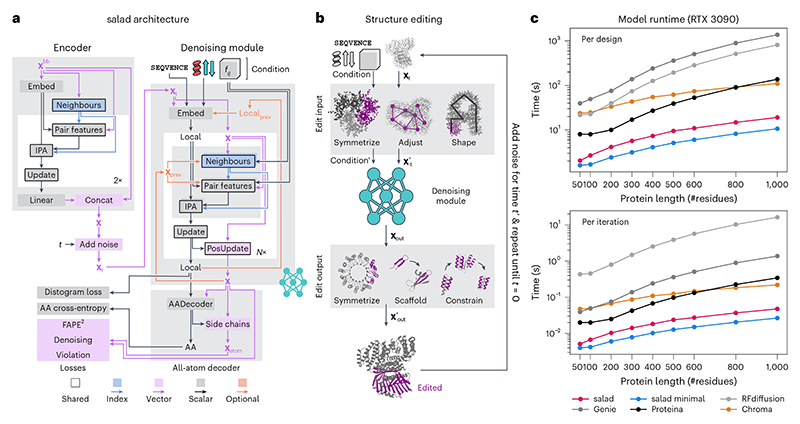
Fig. 2 Denoising model architecture and runtime. a, Schematic of the salad architecture. b, Sampling process of a salad model with structure editing, with example applications of input and output editing. c, Average runtimes on a single RTX 3090 GPU by number of amino acid residues of sparse diffusion models (full pair features and minimal pair features) compared with RFdiffusion, Genie 2, Chroma and Proteina. Runtimes are reported per designed structure, using the default number of denoising iterations for each model (salad, 400; Chroma, 500; Genie 2, 1,000; RFdiffusion, 50; Proteina, 400) as well as the time per iteration. Mean time is based on n = 10 generated backbones per size, and the generation time of the first backbone per size is discarded to exclude model compilation time from the average.
Fig. 2 Denoising model architecture and runtime. a, Schematic of the salad architecture. b, Sampling process of a salad model with structure editing, with example applications of input and output editing. c, Average runtimes on a single RTX 3090 GPU by number of amino acid residues of sparse diffusion models (full pair features and minimal pair features) compared with RFdiffusion, Genie 2, Chroma and Proteina. Runtimes are reported per designed structure, using the default number of denoising iterations for each model (salad, 400; Chroma, 500; Genie 2, 1,000; RFdiffusion, 50; Proteina, 400) as well as the time per iteration. Mean time is based on n = 10 generated backbones per size, and the generation time of the first backbone per size is discarded to exclude model compilation time from the average.CC BY · PubMed Central
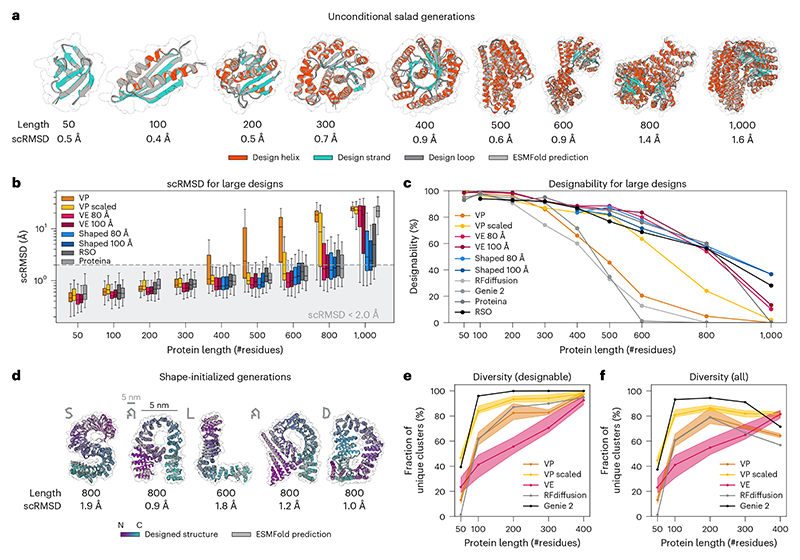
Fig. 3 Unconditional structure generation with salad models. a, Example unconditional generations using salad, ranging from 50 to 1,000 residues (coloured by secondary structure; loop, grey; helix, red; strand, blue) and their ESMFold-predicted structures (light grey). The scRMSD between generation and ESMFold prediction is listed underneath each structure. b, scRMSD values using ESMFold for designed structures from 50 to 1,000 residues for salad, RFdiffusion1, Genie 2 (ref. 2), Proteina42 and RSO27. The region of successful designs with scRMSD < 2.0 Å is marked in light grey. The box centre line indicates the median scRMSD, the boundaries indicate the 1st and 3rd quartiles, and whiskers show the 1st or 3rd quartile + 1.5 times the interquartile range. c, Designability of generated structures by protein length from 50 to 1,000 residues. The shown RSO values are from ref. 27. Data in b and c are based on n = 200 generated backbones per length. d, Generations (coloured by residue index) and ESMFold predictions (light grey) for large protein structures generated using VE denoising starting from letter-shaped noise. Each structure is reported with its scRMSD between generation and ESMFold prediction. The grey letter shape in the top left corresponds to the shape of the noise the proteins were generated from. Scale bar (grey), 5 nm. The black bar corresponds to the same distance in the depicted protein structures. e,f, Model diversity computed as the fraction of designable clusters over designable structures (e) or all the generated structures (f). Clusters are generated using single-linkage clustering by pairwise TM-score with a cut-off of TM-score ≥ 0.6. Mean diversity across n = 10 random samples of 100 structures from 200 generated structures. Error bars indicate the minimum and maximum diversities across n = 10 samples. Area between the maximum and minimum sampled diversity is shaded.
Fig. 3 Unconditional structure generation with salad models. a, Example unconditional generations using salad, ranging from 50 to 1,000 residues (coloured by secondary structure; loop, grey; helix, red; strand, blue) and their ESMFold-predicted structures (light grey). The scRMSD between generation and ESMFold prediction is listed underneath each structure. b, scRMSD values using ESMFold for designed structures from 50 to 1,000 residues for salad, RFdiffusion1, Genie 2 (ref. 2), Proteina42 and RSO27. The region of successful designs with scRMSD < 2.0 Å is marked in light grey. The box centre line indicates the median scRMSD, the boundaries indicate the 1st and 3rd quartiles, and whiskers show the 1st or 3rd quartile + 1.5 times the interquartile range. c, Designability of generated structures by protein length from 50 to 1,000 residues. The shown RSO values are from ref. 27. Data in b and c are based on n = 200 generated backbones per length. d, Generations (coloured by residue index) and ESMFold predictions (light grey) for large protein structures generated using VE denoising starting from letter-shaped noise. Each structure is reported with its scRMSD between generation and ESMFold prediction. The grey letter shape in the top left corresponds to the shape of the noise the proteins were generated from. Scale bar (grey), 5 nm. The black bar corresponds to the same distance in the depicted protein structures. e,f, Model diversity computed as the fraction of designable clusters over designable structures (e) or all the generated structures (f). Clusters are generated using single-linkage clustering by pairwise TM-score with a cut-off of TM-score ≥ 0.6. Mean diversity across n = 10 random samples of 100 structures from 200 generated structures. Error bars indicate the minimum and maximum diversities across n = 10 samples. Area between the maximum and minimum sampled diversity is shaded.CC BY · PubMed Central
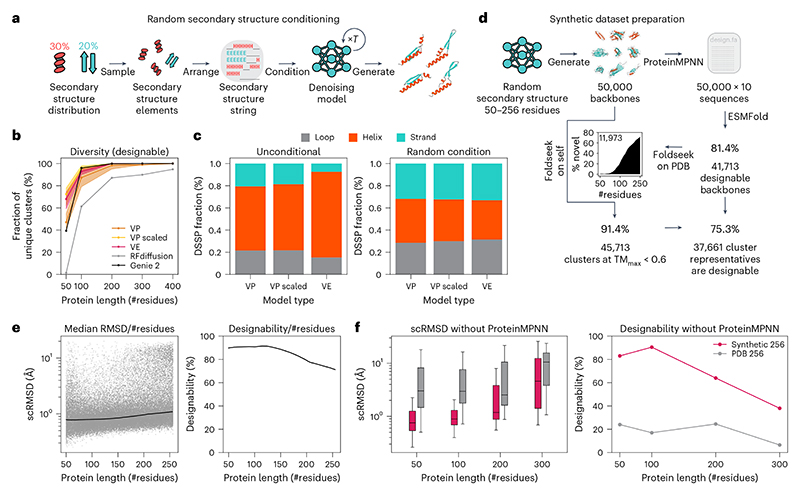
Fig. 4 Random secondary structure conditioning maximizes diversity at the cost of designability. a, Schematic of our random secondary structure sampling procedure. b, Diversity of designable structures generated using random secondary structure conditioning for 50–400 residues, compared with the diversity of designable structures generated using RFdiffusion and Genie 2. Mean diversity across n = 10 random samples of 100 backbones from 200 generated backbones. Error bars correspond to minimum and maximum diversities across these n = 10 samples. Area between the maximum and minimum sampled diversity is shaded. c, Secondary structure distribution for our models using no conditioning (left) or random secondary structure conditioning (right). d, Overview of diverse synthetic dataset generation using random secondary structure conditioning. e, Left: scatter plot of ESMFold scRMSD for all 50,000 generated structures. The line indicates the median scRMSD within a length window of 100 residues. Right: designability of the generated structures in the synthetic dataset computed for a length window of 100 amino acids. f, Single-shot performance of diffusion models trained on the synthetic dataset (synthetic 256) compared with the subset of proteins of length of <256 residues in PDB (PDB 256). Left: box plot of RMSD between the generated structures and ESMFold predictions for the argmax sequence prediction for models trained on the synthetic dataset and PDB. The centre line indicates the median scRMSD, box boundaries indicate the 1st and 3rd quartiles, and whiskers show the 1st or 3rd quartile + 1.5 times the interquartile range from the box. Right: designability of argmax sequence predictions for models trained on synthetic data and PDB based on n = 200 generated backbones per condition.
Fig. 4 Random secondary structure conditioning maximizes diversity at the cost of designability. a, Schematic of our random secondary structure sampling procedure. b, Diversity of designable structures generated using random secondary structure conditioning for 50–400 residues, compared with the diversity of designable structures generated using RFdiffusion and Genie 2. Mean diversity across n = 10 random samples of 100 backbones from 200 generated backbones. Error bars correspond to minimum and maximum diversities across these n = 10 samples. Area between the maximum and minimum sampled diversity is shaded. c, Secondary structure distribution for our models using no conditioning (left) or random secondary structure conditioning (right). d, Overview of diverse synthetic dataset generation using random secondary structure conditioning. e, Left: scatter plot of ESMFold scRMSD for all 50,000 generated structures. The line indicates the median scRMSD within a length window of 100 residues. Right: designability of the generated structures in the synthetic dataset computed for a length window of 100 amino acids. f, Single-shot performance of diffusion models trained on the synthetic dataset (synthetic 256) compared with the subset of proteins of length of <256 residues in PDB (PDB 256). Left: box plot of RMSD between the generated structures and ESMFold predictions for the argmax sequence prediction for models trained on the synthetic dataset and PDB. The centre line indicates the median scRMSD, box boundaries indicate the 1st and 3rd quartiles, and whiskers show the 1st or 3rd quartile + 1.5 times the interquartile range from the box. Right: designability of argmax sequence predictions for models trained on synthetic data and PDB based on n = 200 generated backbones per condition.CC BY · PubMed Central
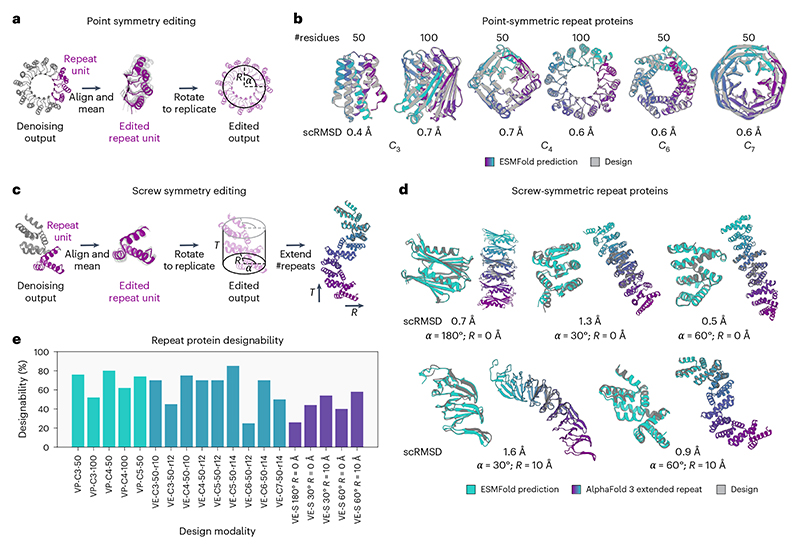
Fig. 5 Edited denoising for symmetric and repeat proteins. a, Schematic of the structure editing procedure for point-symmetric repeat protein design. b, Example generated point-symmetric repeat proteins for different subunit sizes (50 and 100 residues) and cyclic groups (C3, C4, C6 and C7). The idealized symmetric design is shown in grey, and the ESMFold prediction for each design is coloured by the residue index. scRMSD values are reported for each example structure. c, Schematic of the structure editing procedure for screw-symmetric repeat proteins. d, Example screw-symmetric designs (grey) for different angles (30°–180°) and radii (0 Å and 10 Å), with a fixed inter-subunit translation of 12 Å. An ESMFold-predicted structure (turquoise) is superimposed onto the designed repeat (left). Additionally, a structure of the design predicted by AlphaFold 3 (ref. 72) replicated three times (coloured by residue index) is shown together with the scRMSD of the design to that extended repeat protein. e, Design success rates for cyclic and screw-symmetric designs using VP and VE models with different symmetry groups, radii and rotation angles based on n = 20 generated backbones per condition.
Fig. 5 Edited denoising for symmetric and repeat proteins. a, Schematic of the structure editing procedure for point-symmetric repeat protein design. b, Example generated point-symmetric repeat proteins for different subunit sizes (50 and 100 residues) and cyclic groups (C3, C4, C6 and C7). The idealized symmetric design is shown in grey, and the ESMFold prediction for each design is coloured by the residue index. scRMSD values are reported for each example structure. c, Schematic of the structure editing procedure for screw-symmetric repeat proteins. d, Example screw-symmetric designs (grey) for different angles (30°–180°) and radii (0 Å and 10 Å), with a fixed inter-subunit translation of 12 Å. An ESMFold-predicted structure (turquoise) is superimposed onto the designed repeat (left). Additionally, a structure of the design predicted by AlphaFold 3 (ref. 72) replicated three times (coloured by residue index) is shown together with the scRMSD of the design to that extended repeat protein. e, Design success rates for cyclic and screw-symmetric designs using VP and VE models with different symmetry groups, radii and rotation angles based on n = 20 generated backbones per condition.CC BY · PubMed Central
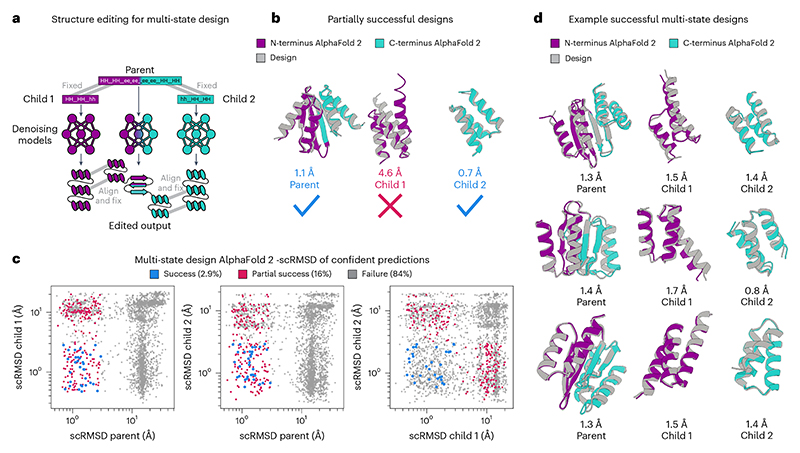
Fig. 6 Multi-state protein design. a, Schematic of the structure editing procedure for multi-state protein design. b, Example partially successful multi-state design. c, Scatter plots of AlphaFold 2 scRMSD values for parent and child sequences with pLDDT > 75. Failed sequences are marked in grey, partial successes (parent and at least one child successful) are marked in purple and successful designs are marked in blue. d, Examples of successful multi-state designs. Generated structures for parent and child proteins are shown in grey; the predicted structures are coloured by their corresponding child protein. The N-terminal part is coloured purple and the C-terminal part is blue. AlphaFold 2 scRMSD values are reported for each parent and child design based on n = 1,000 backbones per condition.
Fig. 6 Multi-state protein design. a, Schematic of the structure editing procedure for multi-state protein design. b, Example partially successful multi-state design. c, Scatter plots of AlphaFold 2 scRMSD values for parent and child sequences with pLDDT > 75. Failed sequences are marked in grey, partial successes (parent and at least one child successful) are marked in purple and successful designs are marked in blue. d, Examples of successful multi-state designs. Generated structures for parent and child proteins are shown in grey; the predicted structures are coloured by their corresponding child protein. The N-terminal part is coloured purple and the C-terminal part is blue. AlphaFold 2 scRMSD values are reported for each parent and child design based on n = 1,000 backbones per condition.CC BY · PubMed Central

Verification

Claims the paper makes

The claims and statistics of this paper haven’t been checked yet.

Run the check — free, no account needed. It reads the open-access text and checks the sources it cites.

A few free checks a day · papers already verified open instantly · results are public

Self-check

Percentages, sums and reported differences re-computed from the paper’s own numbers.

The self-check needs the paper’s full text.

Citations

Cites

Show all 2 references

Research works printed but not linked: 64

  1. 2023, De novo design of protein structure and function with rfdiffusion, Nature, 620, 1476
  2. Yeqing Lin , Minji Lee , Zhao Zhang , and Mohammed AlQuraishi . Out of many, one: Designing and scaffolding proteins at the scale of the structural universe with genie 2. ArXiv, abs/2405.15489, 2024. · arXiv
  3. Dmitri Zorine and David Baker . De novo design of alpha-beta repeat proteins. bioRxiv, 2024. · DOI
  4. 10.1038/nature16162 · DOI
  5. 10.1126/science.add1964 · DOI · Paper page
  6. 10.1126/science.abn2100 · DOI · Paper page
  7. Karla M Castro , Joseph L Watson , Jue Wang , Joshua Southern , Reyhaneh Ayardulabi , Sandrine Georgeon , Stephane Rosset , David Baker , and Bruno E Correia . Accurate single domain scaffolding of three non-overlapping protein epitopes using deep learning. bioRxiv, pages 2024–05, 2024. · DOI
  8. Nathaniel R Bennett , Joseph L Watson , Robert J Ragotte , Andrew J Borst , Déjenaé L See , Connor Weidle , Riti Biswas , Ellen L Shrock , Philip JY Leung , Buwei Huang , et al. Atomically accurate de novo design of single-domain antibodies. bioRxiv, 2024. · DOI · Paper page
  9. Matthias Glögl , Aditya Krishnakumar , Robert J. Ragotte , Inna Goreshnik , Brian Coventry , Asim K. Bera , Alex Kang , Emily Joyce , Green Ahn , Buwei Huang , Wei Yang , Wei Chen , Mariana Garcia Sanchez , Brian Koepnick , and David Baker . Target-conditioned diffusion generates potent tnfr superfamily antagonists and agonists. bioRxiv, 2024. · DOI
  10. Martin Pacesa , Lennart Nickel , Joseph Schmidt , Ekaterina Pyatova , Christian Schellhaas , Lucas Kissling , Ana Alcaraz-Serna , Yehlin Cho , Kourosh H. Ghamary , Laura Vinué , Brahm J. Yachnin , Andrew M. Wollacott , Stephen Buckley , Sandrine Georgeon , Casper A. Goverde , Georgios N. Hatzopoulos , Pierre Gönczy , Yannick D. Muller , Gerald Schwank , Sergey Ovchinnikov , and Bruno E. Correia . Bindcraft: one-shot design of functional protein binders. bioRxiv, 2024. · DOI
  11. 10.1126/science.adg7731 · DOI · Paper page
  12. 10.1038/s41586-024-07813-2 · DOI
  13. Sidney Lisanza , Jake Merle Gershon , Sam Tipps , Lucas Arnoldt , Samuel Hendel , Jeremiah Nelson Sims , Xinting Li , and David Baker . Joint generation of protein sequence and structure with rosettafold sequence space diffusion. bioRxiv, 2023. · DOI
  14. Florian Richter , Andrew Leaver-Fay , Sagar D. Khare , Sinisa Bjelic , and David Baker . De novo enzyme design using rosetta3. PLoS ONE, 6, 2011. · DOI
  15. 10.1038/s41586-023-05696-3 · DOI
  16. Anna Lauko , Samuel J. Pellock , Ivan Anischanka , Kiera H. Sumida , David Juergens , Woody Ahern , Alex Shida , Andrew Hunt , Indrek Kalvet , Christoffer H Norn , Ian R. Humphreys , Cooper S. Jamieson , Alex Kang , Evans Brackenbrough , Asim K. Bera , Banumathi Sankaran , Kendall N. Houk , and David Baker . Computational design of serine hydrolases. bioRxiv, 2024. · DOI · Paper page
  17. Fabian Sesterhenn , Che Yang , Jaume Bonet , Johannes T. Cramer , Xiaolin Wen , Yimeng Wang , Chi-I Chiang , Luciano A. Abriata , Iga Kucharska , Giacomo Castoro , Sabrina S Vollers , Marie Galloux , Elie Dheilly , Stéphane Rosset , Patricia Corthésy , Sandrine Georgeon , Mélanie Villard , Charles-Adrien Richard , Delphyne Descamps , Teresa Delgado , Elisa Oricchio , Marie-Anne Rameix-Welti , Vicente Más , Sean Ervin , Jean-François Éléouët , Sabine Riffault , John T. Bates , Jean-Philippe Julien , Yuxing Li , Theodore S. Jardetzky , Thomas Krey , and Bruno E. Correia . De novo protein design enables precise induction of functional antibodies in vivo. bioRxiv, page 685867, 2020.
  18. 10.1038/nature12966 · DOI · Paper page
  19. 10.1126/science.adq1741 · DOI
  20. 2022, Illuminating protein space with a programmable generative model, Nature, 623, 1070
  21. Rui Min Wu , Fan Ding , Rui Wang , Rui Shen , Xiwen Zhang , Shitong Luo , Chenpeng Su , Zuofan Wu , Qi Xie , Bonnie Berger , Jianzhu Ma , and Jian Peng . High-resolution de novo structure prediction from primary sequence. bioRxiv, 2022.
  22. 10.1126/science.add2187 · DOI · Paper page
  23. 10.1016/B978-0-12-381270-4.00019-6 · DOI
  24. Ivan Anishchenko , Samuel J. Pellock , Tamuka M. Chidyausiku , Theresa A. Ramelot , Sergey Ovchinnikov , Jingzhou Hao , Khushboo Bafna , Christoffer Norn , Alex Kang , Asim K. Bera , Frank DiMaio , Lauren Carter , Cameron M. Chow , Gaetano T. Montelione , and David Baker . De novo protein design by deep network hallucination. Nature, pages 1–6, 2021. · DOI · Paper page
  25. Michael Jendrusch , Jan O. Korbel , and S. Kashif Sadiq . Alphadesign: A de novo protein design framework based on alphafold. bioRxiv, 2021.
  26. 10.1073/pnas.2307371120 · DOI
  27. Patrick Bryant and Arne Elofsson . Evobind: in silico directed evolution of peptide binders with alphafold. bioRxiv, pages 2022–07, 2022.
  28. 10.48550/ARXIV.2006.11239 · DOI · Paper page
  29. Sarah Alamdari , Nitya Thakkar , Rianne van den Berg , Neil Tenenholtz , Bob Strome , Alan Moses , Alex Xijie Lu , Nicolo Fusi , Ava Pardis Amini , and Kevin K Yang . Protein generation with evolutionary diffusion: sequence is all you need. BioRxiv, pages 2023–09, 2023. · DOI · Paper page
  30. Chentong Wang , Yannan Qu , Zhangzhi Peng , Yukai Wang , Hongli Zhu , Dachuan Chen , and Longxing Cao . Proteus: exploring protein structure generation for enhanced designability and efficiency. bioRxiv, pages 2024–02, 2024. · DOI
  31. 2023, Se (3) diffusion model with application to protein backbone generation, arXiv preprint
  32. 10.1126/science.abj8754 · DOI · Paper page
  33. A Vaswani . Attention is all you need. Advances in Neural Information Processing Systems, 2017.
  34. John Ingraham , Vikas K. Garg , Regina Barzilay , and T. Jaakkola . Generative models for graph-based protein design. In DGS@ICLR, 2019.
  35. 2020, Glu variants improve transformer, arXiv preprint
  36. 2019, Transformers without tears: Improving the normalization of self-attention, arXiv preprint
  37. 10.1107/S0907444902003451 · DOI
  38. Aaron Van Den Oord , Oriol Vinyals , et al. Neural discrete representation learning. Advances in neural information processing systems, 30, 2017.
  39. Andriy Kryshtafovych , Torsten Schwede , Maya Topf , Krzysztof Fidelis , and John Moult . Critical assessment of methods of protein structure prediction (casp) - round xiv. Proteins, 2021. · DOI · Paper page
  40. 10.1002/prot.26617 · DOI · Paper page
  41. Christopher Frank , Dominik Schiwietz , Lara Fuß , Sergey Ovchinnikov , and Hendrik Dietz . Alphafold2 refinement improves designability of large de novo proteins. bioRxiv, 2024.
  42. 10.1006/jmbi.2001.4776 · DOI
  43. 10.1038/s41587-023-01773-0 · DOI · Paper page
  44. Tomas Hayes , Roshan Rao , Halil Akin , Nicholas J Sofroniew , Deniz Oktay , Zeming Lin , Robert Verkuil , Vincent Q Tran , Jonathan Deaton , Marius Wiggert , et al. Simulating 500 million years of evolution with a language model. bioRxiv, pages 2024–07, 2024. · DOI · Paper page
  45. Yufeng Liu , Sheng Wang , Jixin Dong , Linghui Chen , Xinyu Wang , Lei Wang , Fudong Li , Chenchen Wang , Jiahai Zhang , Yuzhu Wang , et al. De novo protein design with a denoising diffusion network independent of pretrained structure prediction models. Nature Methods, pages 1–10, 2024.
  46. 10.1038/S41586-024-07487-W · DOI · Paper page
  47. 10.1098/rsob.210012 · DOI
  48. 10.1126/sci-ence.adl2528 · DOI
  49. 10.1038/s41586-023-06510-w · DOI · Paper page
  50. Jason Yim , Brian L. Trippe , Valentin De Bortoli , Emile Mathieu , A. Doucet , Regina Barzilay , and T. Jaakkola . Se(3) diffusion model with application to protein backbone generation. ArXiv, abs/2302.02277, 2023. · arXiv
  51. Yeqing Lin and Mohammed AlQuraishi . Generating novel, designable, and diverse protein structures by equivariantly diffusing oriented residue clouds. ArXiv, abs/2301.12485, 2023. · arXiv
  52. Alexander E. Chu , Lucy Cheng , Gina El Nesr , Minkai Xu , and Po-Ssu Huang . An all-atom protein generative model. bioRxiv, 2023.
  53. N. Anand and Tudor Achim . Protein structure and sequence generation with equivariant denoising diffusion probabilistic models. ArXiv, abs/2205.15019, 2022. · arXiv
  54. 10.1073/pnas.2311500121 · DOI
  55. Wei Qu , Jiawei Guan , Rui Ma , Ke Zhai , Weikun Wu , and Haobo Wang . P (all-atom) is unlocking new path for protein design. bioRxiv, pages 2024–08, 2024.
  56. Alexander Quinn Nichol and Prafulla Dhariwal . Improved denoising diffusion probabilistic models. In International conference on machine learning, pages 8162–8171. PMLR, 2021.
  57. 2022, Elucidating the design space of diffusion-based generative models, Advances in neural information processing systems, 35, 26565
  58. 2022, Diffusion-lm improves controllable text generation, Advances in Neural Information Processing Systems, 35, 4328
  59. Emiel Hoogeboom , Alexey A. Gritsenko , Jasmijn Bastings , Ben Poole , Rianne van den Berg , and Tim Salimans . Autore-gressive diffusion models. ArXiv, abs/2110.02037, 2021. · arXiv
  60. Ruibin Xiong , Yunchang Yang, D. He , Kai Zheng , Shuxin Zheng , Chen Xing , Huishuai Zhang , Yanyan Lan , Liwei Wang , and Tieyan Liu . On layer normalization in the transformer architecture. In International Conference on Machine Learning, pages 10524–10533. PMLR, 2020.
  61. 10.1038/nbt.3988 · DOI · Paper page
  62. Diederik P. Kingma and Jimmy Ba . Adam: A method for stochastic optimization. CoRR, abs/1412.6980, 2014. · arXiv
  63. 2016, Sgdr: Stochastic gradient descent with warm restarts, arXiv preprint
  64. 10.1093/nar/gki524 · DOI · Paper page

Metadata

Authors
Jendrusch, M., & Korbel, J. O.
Affiliations
Heidelberg University (DE)
Corresponding author
  • Jendrusch, Michael
  • Korbel, Jan O.
Venue
Nature Machine Intelligence
Publisher
openRxiv
Published
2025-02-05
Volume
7
Issue
9
Pages
1429-1445
ISSN
2522-5839 (ISSN-L)
OpenAlex
W4414459878
Cited by
10
References
2
Citations by year
2026: 10
FWCI
3.01
Type
journal article
Language
en
Open access
Locations
  • Nature Machine Intelligence (publishedVersion, cc-by)
  • bioRxiv (Cold Spring Harbor Laboratory) (acceptedVersion, cc-by)
  • PubMed (publishedVersion)
  • PubMed Central (publishedVersion, cc-by)
Funders
European Molecular Biology Laboratory (EMBL001)
Topics
  • Life Sciences › Biochemistry, Genetics and Molecular Biology › Molecular Biology › Protein Structure and Dynamics
  • Life Sciences › Biochemistry, Genetics and Molecular Biology › Molecular Biology › Machine Learning in Bioinformatics
  • Life Sciences › Pharmacology, Toxicology and Pharmaceutics › Drug Discovery › Computational Drug Discovery Methods
Keywords
protein structure generation, protein design, salads, protein scaffolds, generative models

About these checks

Registry, retraction, Cites and statistics results are computed, not judged, with one exception: a printed reference that no index lists is read once by a model before it counts as a citation error. Claims are extracted by a model and kept only when their quote appears verbatim in the text; each cited source is then checked, with a model’s help, for whether it says what the claim relies on. Those verdicts can be wrong — read the claim’s quote and the cited source before relying on one.

Statistics and arithmetic are recomputed, not judged.

Confidence bands are shown only for fields calibrated on our annotated test set. None is calibrated yet, so no band is shown.

What counts as a claim ›How we measure confidence ›How we check this ›

Are you an author, or do you see a problem with this page? Request a review

How to cite

Cite CoChat for the checks on this page, and the paper for its own findings.

This page
CoChat. (2026). Citation check: Efficient protein structure generation with sparse denoising models. https://app.cochat.ai/papers/10.1101/2025.01.31.635780
The paper
Jendrusch, M., & Korbel, J. O. (2025). Efficient protein structure generation with sparse denoising models. Nature Machine Intelligence. https://doi.org/10.1101/2025.01.31.635780