PreprintCited by 2Developmental Biology and Gene RegulationGenomics and Chromatin DynamicsCraniofacial Disorders and Treatments

The DOI matches its Crossref record; 1 of the 1 references it cites were found in a registry or an index.

Neural crest induction requires SALL4-mediated BAF recruitment to lineage specific enhancers

Open access

Preprint — published as 10.1242/dev.205248 · Paper page

Abstract

Neural crest induction begins early during neural plate formation, requiring precise transcriptional control to activate lineage-specific enhancers. Here, we demonstrate that SALL4, a transcription factor associated with syndromes featuring craniofacial anomalies, plays a critical role in early cranial neural crest (CNCC) specification. Using SALL4 -het-KO human iPSCs to model clinical haploinsufficiency, we show that SALL4 directly recruits BAF to CNCC-lineage specific enhancers at the neuroectodermal stage, specifically when neural crest gene expression is induced at the neural plate border. Without functional SALL4, BAF is not loaded at chromatin, leaving CNCC enhancers inaccessible. Consequently, the cells cannot undergo proper CNCC induction and specification due to persistent enhancer repression, despite normal neuroectodermal and neural plate progression. Moreover, by performing SALL4 isoform-specific depletion, we demonstrate that the SALL4A is the isoform essential for CNCC induction and specification, and that SALL4B cannot compensate for SALL4A loss in this developmental process. In summary, our findings reveal SALL4 as essential regulator of BAF-dependent enhancer activation during early stages of neural crest development, providing molecular insights into SALL4-associated craniofacial anomalies.

Overview

The claims and statistics of this paper haven’t been checked yet.

Run the check — free, no account needed. It reads the open-access text and checks the sources it cites.

A few free checks a day · papers already verified open instantly · results are public

Integrity signals

Registry

Crossref · 10.1101/2025.06.10.658805

Cites

1 of 1 references verified0 citation errors · 0 not checkable

Statistics

Figures

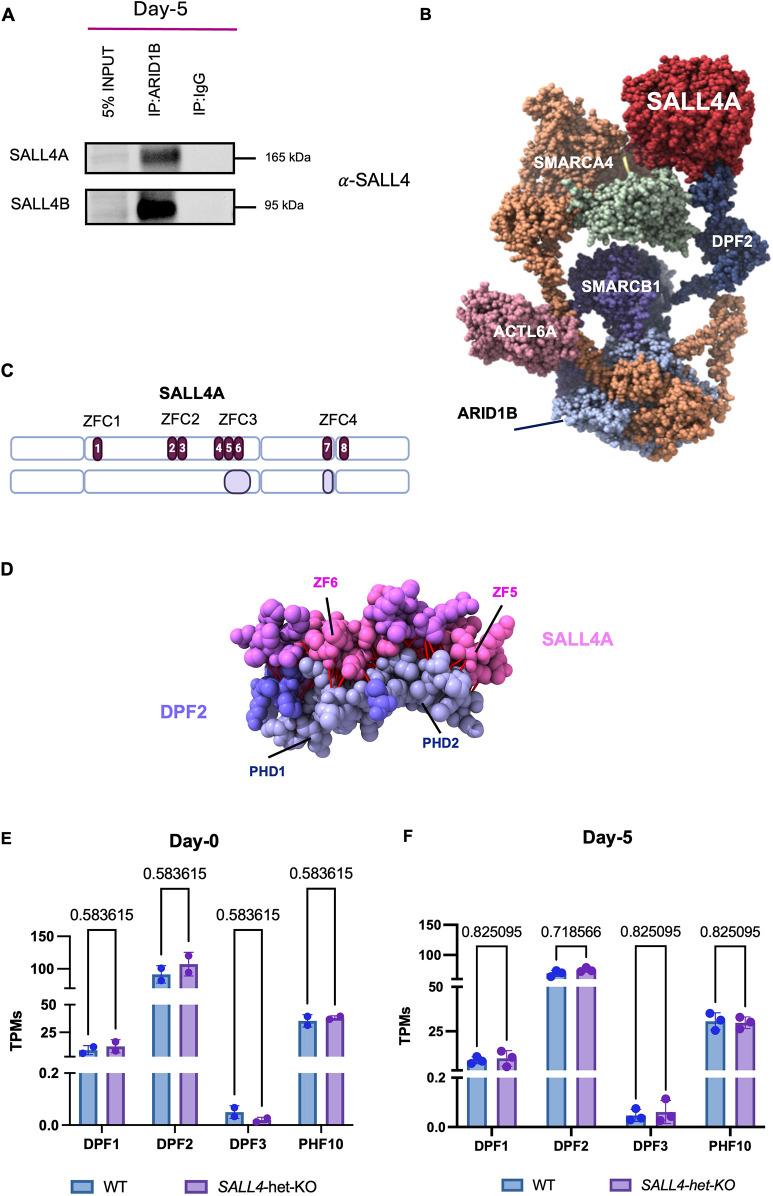
Fig. 1. SALL4A interacts with the BAF complex through DP+F2. (A) Immunoblot of nuclear extract (5% input), co-immunoprecipitations (co-IP) of ARID1B and IgG (negative control) from SALL4-WT cells at day 5. (B) AlphaFold structure model showing the predicted interactions between SALL4A (red), DPF2 (dark blue) and other BAF components, including SMARCA4, SMARCB1 and ACTL6A. (C) SALL4A protein sequence and visual representation of output model of SALL4A (model 0). C2H2 zinc-fingers (ZFs) annotations are highlighted in dark purple and numbered. Interactions between SALL4A and DPF2 through the ZFs 4, 5 and 6 (ZFC3) and 7 (ZFC4) are highlighted in light purple. Made with BioRender.com. (D) Zoomed view of SALL4 (pink) and DPF2 (purple) interacting surfaces. Highlighted are the functional domains involved in the predicted interaction. In red, contacts predicted by AlphaFold (Jumper et al., 2021). (E) Expression (transcripts per million; TPMs) of the four members of the DPF protein family in iPSCs (day 0; n=2). Differences between conditions were assessed using unpaired Student's t-test. (F) Expression of the four members of the DPF protein at day 5 (n=3). Differences between conditions were assessed using unpaired student's t-test. Data are mean±s.e.m. Individual biological replicates are displayed as circles.
Fig. 1. SALL4A interacts with the BAF complex through DP+F2. (A) Immunoblot of nuclear extract (5% input), co-immunoprecipitations (co-IP) of ARID1B and IgG (negative control) from SALL4-WT cells at day 5. (B) AlphaFold structure model showing the predicted interactions between SALL4A (red), DPF2 (dark blue) and other BAF components, including SMARCA4, SMARCB1 and ACTL6A. (C) SALL4A protein sequence and visual representation of output model of SALL4A (model 0). C2H2 zinc-fingers (ZFs) annotations are highlighted in dark purple and numbered. Interactions between SALL4A and DPF2 through the ZFs 4, 5 and 6 (ZFC3) and 7 (ZFC4) are highlighted in light purple. Made with BioRender.com. (D) Zoomed view of SALL4 (pink) and DPF2 (purple) interacting surfaces. Highlighted are the functional domains involved in the predicted interaction. In red, contacts predicted by AlphaFold (Jumper et al., 2021). (E) Expression (transcripts per million; TPMs) of the four members of the DPF protein family in iPSCs (day 0; n=2). Differences between conditions were assessed using unpaired Student's t-test. (F) Expression of the four members of the DPF protein at day 5 (n=3). Differences between conditions were assessed using unpaired student's t-test. Data are mean±s.e.m. Individual biological replicates are displayed as circles.CC BY · PubMed Central
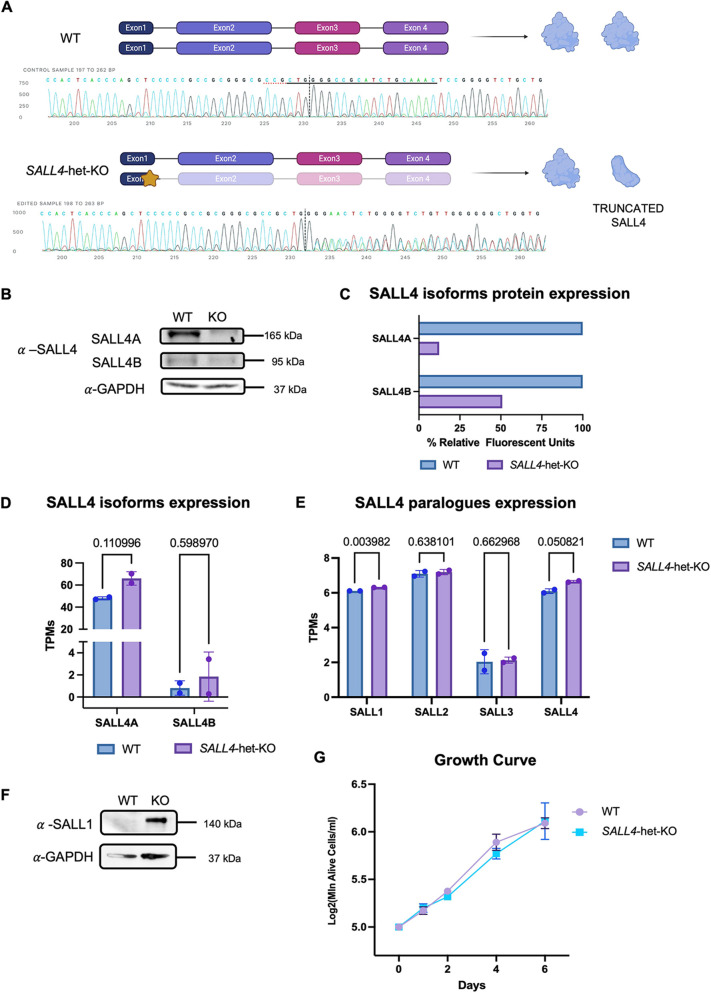
Fig. 2. Generation of a SALL4-haploinsufficient hiPSC line. (A) Visual representation of the CRISPR/Cas9 approach used for SALL4-het-KO. The star represents the exact location of the deletion. Sanger sequencing confirming the 11-bp deletion in one allele of SALL4 is displayed (clone F1). Created in BioRender by Demurtas, M., 2025. https://BioRender.com/ufbzgfa. This figure was sublicensed under CC BY 4.0 terms. (B) Immunoblot for SALL4 in SALL4-WT and SALL4-het-KO (clone F1) iPSC lines. (C) Densitometry analysis of SALL4A and SALL4B expression in WT and SALL4-het-KO iPSC lines from immunoblot assay. (D) RNA expression (transcripts per million; TPMs) for SALL4A and SALL4B in WT and SALL4-het-KO iPSCs (n=2). (E) Bar plots displaying expression TPMs of all SALL paralogues in SALL4-WT and SALL4-het-KO iPSCs (n=2). Individual biological replicates are displayed as circles. (F) Immunoblot for SALL1 in SALL4-WT and SALL4-het-KO (clone F1) iPSC lines. (G) Growth curve comparing SALL4-WT with SALL4-het-KO iPSC lines. N=2 biologically independent experiments. Statistical significance was assessed using unpaired Student's t-test. Data are mean±s.e.m.
Fig. 2. Generation of a SALL4-haploinsufficient hiPSC line. (A) Visual representation of the CRISPR/Cas9 approach used for SALL4-het-KO. The star represents the exact location of the deletion. Sanger sequencing confirming the 11-bp deletion in one allele of SALL4 is displayed (clone F1). Created in BioRender by Demurtas, M., 2025. https://BioRender.com/ufbzgfa. This figure was sublicensed under CC BY 4.0 terms. (B) Immunoblot for SALL4 in SALL4-WT and SALL4-het-KO (clone F1) iPSC lines. (C) Densitometry analysis of SALL4A and SALL4B expression in WT and SALL4-het-KO iPSC lines from immunoblot assay. (D) RNA expression (transcripts per million; TPMs) for SALL4A and SALL4B in WT and SALL4-het-KO iPSCs (n=2). (E) Bar plots displaying expression TPMs of all SALL paralogues in SALL4-WT and SALL4-het-KO iPSCs (n=2). Individual biological replicates are displayed as circles. (F) Immunoblot for SALL1 in SALL4-WT and SALL4-het-KO (clone F1) iPSC lines. (G) Growth curve comparing SALL4-WT with SALL4-het-KO iPSC lines. N=2 biologically independent experiments. Statistical significance was assessed using unpaired Student's t-test. Data are mean±s.e.m.CC BY · PubMed Central
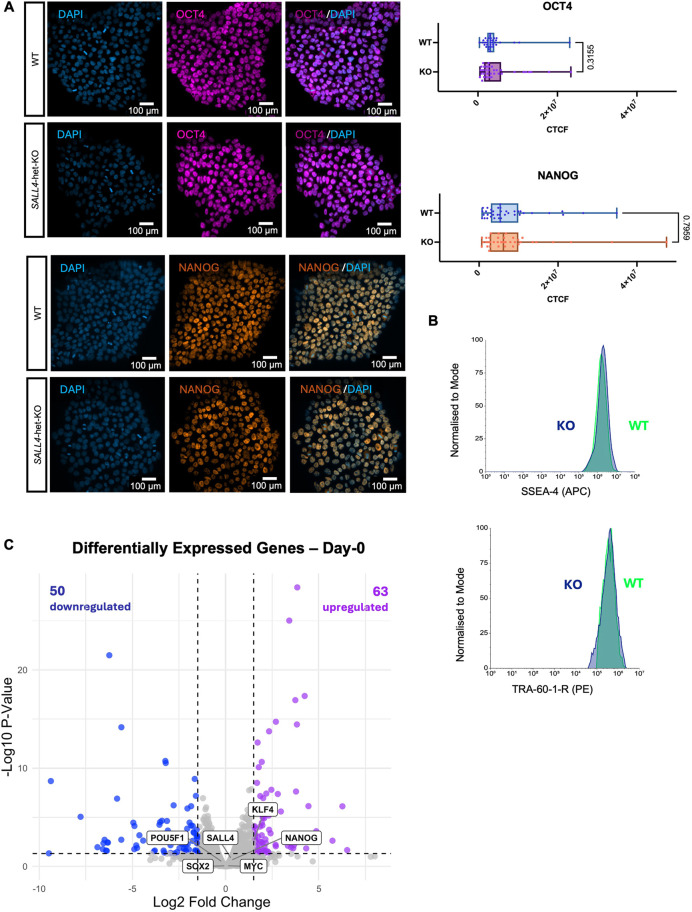
Fig. 3. Stem cell identity is unaffected by SALL4 loss. (A) (Left) Immunofluorescence labelling quantifying the expression of the canonical pluripotency markers OCT4 and NANOG in SALL4-WT and SALL4-het-KO (clone F1) iPSCs. Scale bars: 100 µm. (Right) Corrected total cell fluorescence values were used to quantify and compare marker expression (OCT4, n=34; NANOG, n=37). Box plots show median values (middle bars) and first to third interquartile ranges (boxes); whiskers indicate minimum and maximum values; dots represent each fragmented nucleus considered. (B) Flow cytometry quantifying the expression of surface markers for pluripotency (TRA-60-1-R and SSEA-4). (C) Volcano plot of genes differentially expressed in SALL4-het-KO relative to SALL4-WT in iPSCs (day 0). Blue dots (n=50) represent downregulated genes with Padj<0.05 and log2FoldChange<−1.5. Purple dots (n=63) represent upregulated genes with Padj<0.05 and log2FoldChange>1.5.
Fig. 3. Stem cell identity is unaffected by SALL4 loss. (A) (Left) Immunofluorescence labelling quantifying the expression of the canonical pluripotency markers OCT4 and NANOG in SALL4-WT and SALL4-het-KO (clone F1) iPSCs. Scale bars: 100 µm. (Right) Corrected total cell fluorescence values were used to quantify and compare marker expression (OCT4, n=34; NANOG, n=37). Box plots show median values (middle bars) and first to third interquartile ranges (boxes); whiskers indicate minimum and maximum values; dots represent each fragmented nucleus considered. (B) Flow cytometry quantifying the expression of surface markers for pluripotency (TRA-60-1-R and SSEA-4). (C) Volcano plot of genes differentially expressed in SALL4-het-KO relative to SALL4-WT in iPSCs (day 0). Blue dots (n=50) represent downregulated genes with Padj<0.05 and log2FoldChange<−1.5. Purple dots (n=63) represent upregulated genes with Padj<0.05 and log2FoldChange>1.5.CC BY · PubMed Central
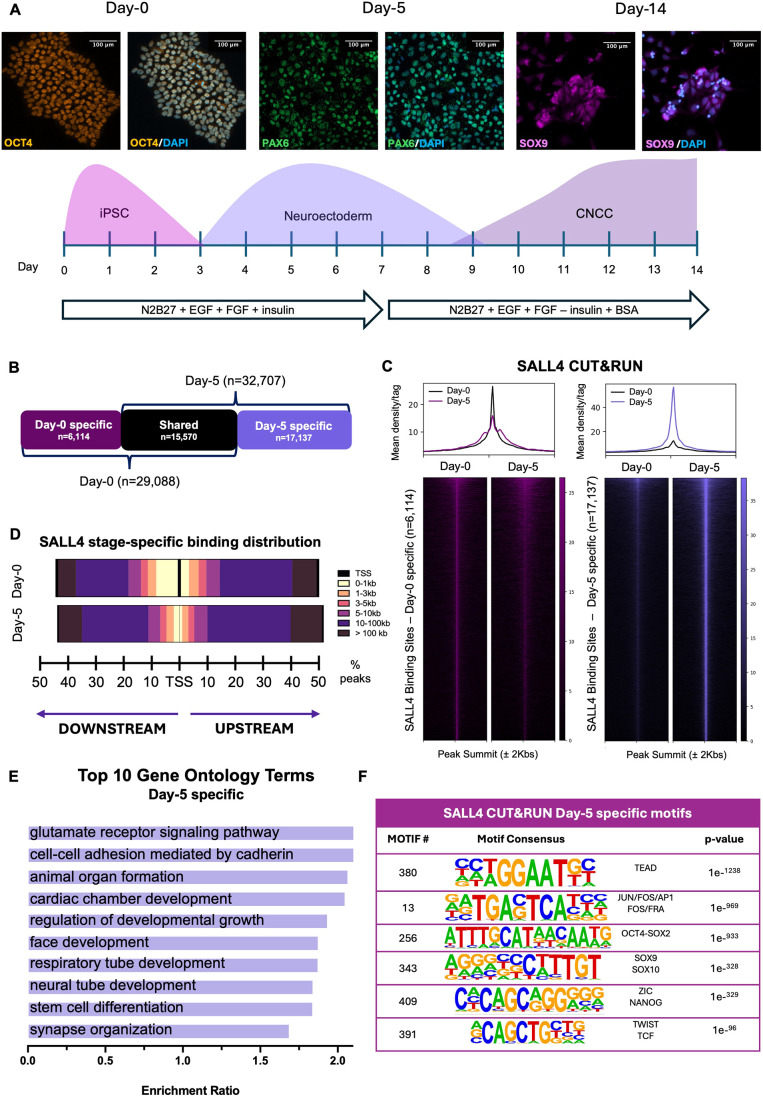
Fig. 4. SALL4 relocates to CNCC enhancers to induce chromatin accessibility. (A) (Bottom) Schematic representation of the iPSC-to-CNCC differentiation protocol. The experimental timeline shows in vitro differentiation of iPSCs into CNCCs via a neuroectodermal-like stage. (Top) Immunofluorescence labelling quantifying the expression of the canonical stage-specific markers (iPSCs: OCT4; neuroectoderm: PAX6; CNCCs: SOX9) showing ratio of cells successfully undergoing stage-specific specifications during CNCC generation. Scale bars: 100 µm. (B) Diagram showing the number of regions bound by SALL4 uniquely at day 0 (‘day-0-specific’, n=6114), at day 5 (‘day-5-specific’, n=17,137) and regions that maintain SALL4 binding at both time points (shared, n=15,570). (C) Heatmaps showing the distribution of SALL4 binding at day 0 and day 5 across day-0-specific (left) and day-5-specific (right) binding regions. CUT&RUN signal intensity was plotted across ±2 kb regions centred on peak summits. Rows represent individual peaks ranked by signal intensity. (D) Genomic distribution of SALL4 binding sites relative to the nearest transcription start site (TSS). Peaks are categorised by distance into six bins: <1 kb, 1-3 kb, 3-5 kb, 5-10 kb, 10-100 kb and >100 kb. Peaks located at >1 kb from the nearest TSS were classified as putative enhancers. Percentages of peaks for each bin are represented by bars to the left (downstream) or right (upstream) of the TSS. (E) Gene ontology analysis of downregulated nearest genes to day-5-specific SALL4-bound regions as determined using WebGestalt (Liao et al., 2019) over-representation pathway analysis, using affinity propagation as parameter for redundancy removal (FDR<0.05). (F) Table of motifs enriched in day-5-specific SALL4-bound regions as determined using HOMER (Heinz et al., 2010).
Fig. 4. SALL4 relocates to CNCC enhancers to induce chromatin accessibility. (A) (Bottom) Schematic representation of the iPSC-to-CNCC differentiation protocol. The experimental timeline shows in vitro differentiation of iPSCs into CNCCs via a neuroectodermal-like stage. (Top) Immunofluorescence labelling quantifying the expression of the canonical stage-specific markers (iPSCs: OCT4; neuroectoderm: PAX6; CNCCs: SOX9) showing ratio of cells successfully undergoing stage-specific specifications during CNCC generation. Scale bars: 100 µm. (B) Diagram showing the number of regions bound by SALL4 uniquely at day 0 (‘day-0-specific’, n=6114), at day 5 (‘day-5-specific’, n=17,137) and regions that maintain SALL4 binding at both time points (shared, n=15,570). (C) Heatmaps showing the distribution of SALL4 binding at day 0 and day 5 across day-0-specific (left) and day-5-specific (right) binding regions. CUT&RUN signal intensity was plotted across ±2 kb regions centred on peak summits. Rows represent individual peaks ranked by signal intensity. (D) Genomic distribution of SALL4 binding sites relative to the nearest transcription start site (TSS). Peaks are categorised by distance into six bins: <1 kb, 1-3 kb, 3-5 kb, 5-10 kb, 10-100 kb and >100 kb. Peaks located at >1 kb from the nearest TSS were classified as putative enhancers. Percentages of peaks for each bin are represented by bars to the left (downstream) or right (upstream) of the TSS. (E) Gene ontology analysis of downregulated nearest genes to day-5-specific SALL4-bound regions as determined using WebGestalt (Liao et al., 2019) over-representation pathway analysis, using affinity propagation as parameter for redundancy removal (FDR<0.05). (F) Table of motifs enriched in day-5-specific SALL4-bound regions as determined using HOMER (Heinz et al., 2010).CC BY · PubMed Central
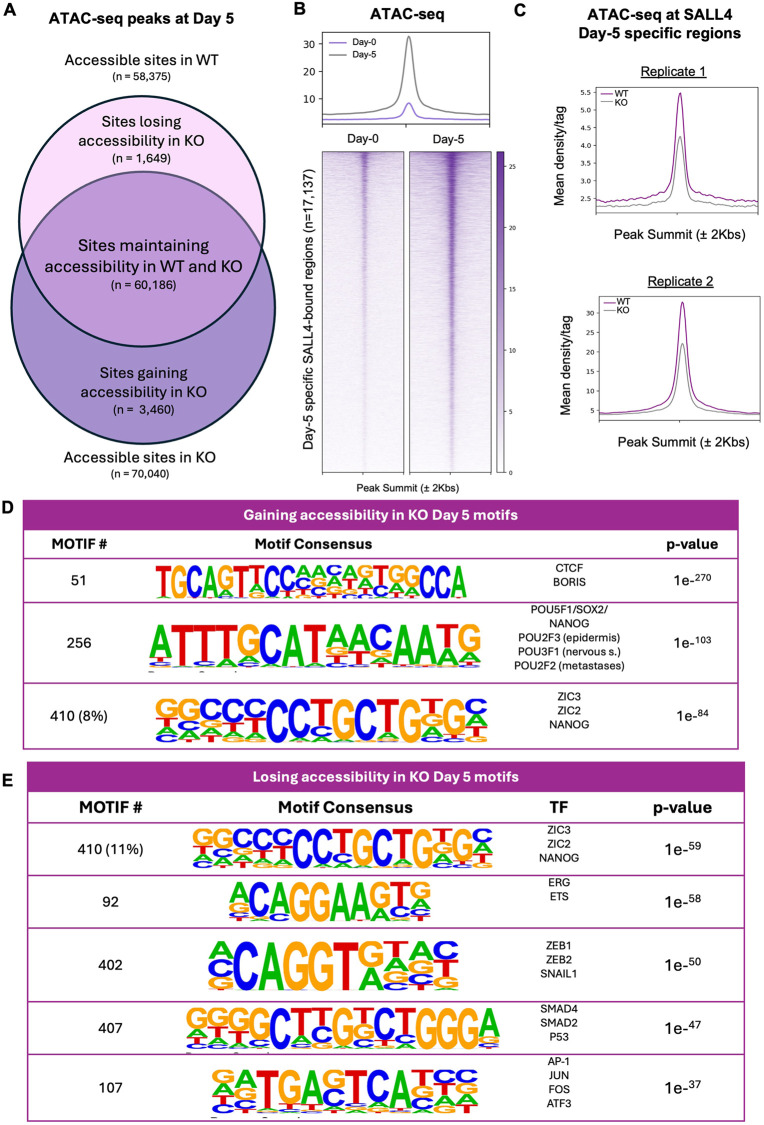
Fig. 5. Chromatin accessibility at the CNCC enhancers is SALL4 dependent. (A) Venn diagram showing chromatin accessibility in SALL4-WT (ATAC-seq peaks, n=58,375) and SALL4-het-KO (n=60,186). It also depicts the number of regions uniquely accessible in SALL4-WT (‘Sites losing accessibility in KO’, n=1649), in SALL4-het-KO (‘Sites gaining accessibility in KO’, n=3460) and regions that remain accessible in both conditions (‘Sites maintaining accessibility in WT and KO’, n=60,186). (B) Heatmaps showing ATAC-seq signals at day 0 (left) and day 5 (right), at day-5-specific SALL4 CUT&RUN peaks. Signal intensity was plotted across ±2 kb regions centred on peak summits. Rows represent individual peaks ranked by signal intensity. (C) Average profiles showing ATAC-seq signal at day-5-specific SALL4 CUT&RUN peaks (n=17,137) in SALL4-WT and SALL4-het-KO cells in two distinct biological replicates. (D,E) Tables of motifs enriched in regions gaining or maintaining accessibility (D) or regions losing accessibility (E) at day 5 in SALL4-het-KO regions as determined using HOMER (Heinz et al., 2010).
Fig. 5. Chromatin accessibility at the CNCC enhancers is SALL4 dependent. (A) Venn diagram showing chromatin accessibility in SALL4-WT (ATAC-seq peaks, n=58,375) and SALL4-het-KO (n=60,186). It also depicts the number of regions uniquely accessible in SALL4-WT (‘Sites losing accessibility in KO’, n=1649), in SALL4-het-KO (‘Sites gaining accessibility in KO’, n=3460) and regions that remain accessible in both conditions (‘Sites maintaining accessibility in WT and KO’, n=60,186). (B) Heatmaps showing ATAC-seq signals at day 0 (left) and day 5 (right), at day-5-specific SALL4 CUT&RUN peaks. Signal intensity was plotted across ±2 kb regions centred on peak summits. Rows represent individual peaks ranked by signal intensity. (C) Average profiles showing ATAC-seq signal at day-5-specific SALL4 CUT&RUN peaks (n=17,137) in SALL4-WT and SALL4-het-KO cells in two distinct biological replicates. (D,E) Tables of motifs enriched in regions gaining or maintaining accessibility (D) or regions losing accessibility (E) at day 5 in SALL4-het-KO regions as determined using HOMER (Heinz et al., 2010).CC BY · PubMed Central
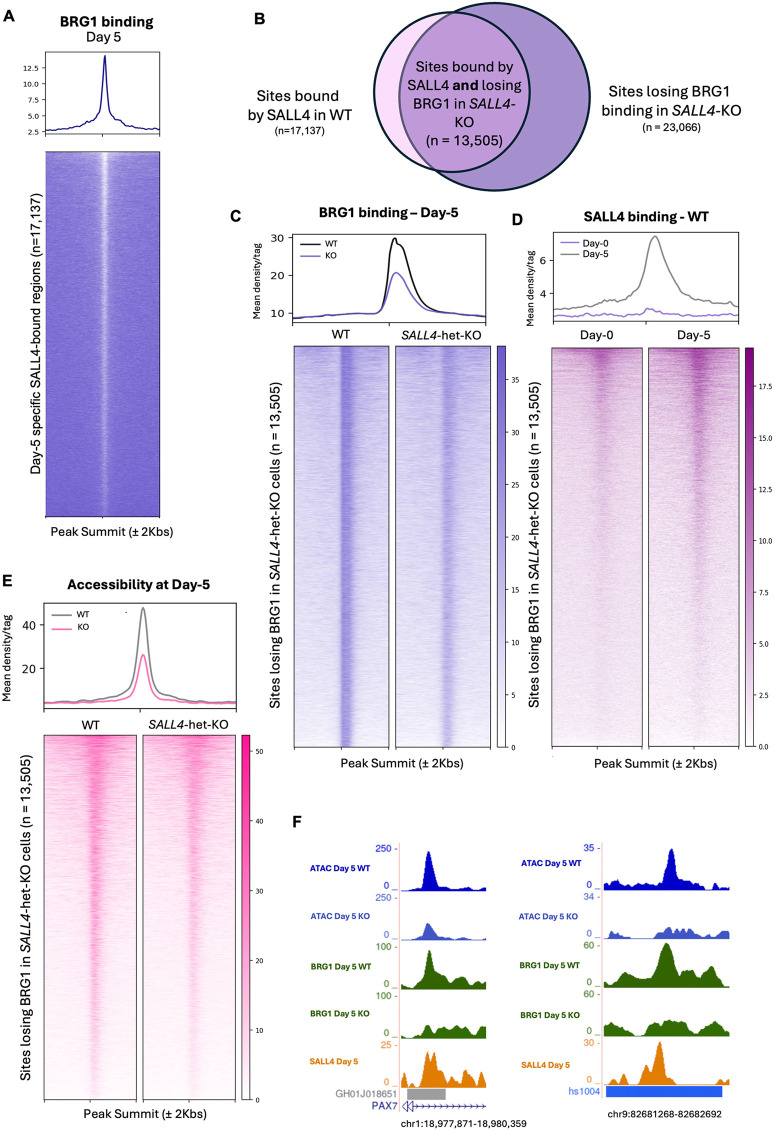
Fig. 6. SALL4 recruits BAF to CNCC enhancers. (A) Heatmap showing BRG1 ChIP-seq signal at the genomic sites bound by SALL4 in WT cells at day 5 (n=17,137). Signal intensity was plotted across ±2 kb regions centred on peak summits. Rows represent individual peaks ranked by signal intensity. (B) Venn diagram showing peaks bound by SALL4 uniquely at day 5 and that lose accessibility in SALL4-het-KO. (C) Heatmap and average profiles show BRG1 ChIP-seq signal at day 5 at the BRG1 peaks lost in SALL4-het-KO (clone F1; n=13,505). Signal intensity was plotted across ±2 kb regions centred on peak summits. Rows represent individual peaks ranked by signal intensity. (D) Heatmap and average profiles show SALL4 CUT&RUN signal at the genomic sites that lose BRG1 in SALL4-het-KO cells at day 0 and day 5 (n=13,505). (E) Heatmaps and average profile show ATAC-seq signal at the genomic sites that lose BRG1 in SALL4-het-KO cells (clone F1; n=13,505). Signal intensity was plotted across ±2 kb regions centred on peak summits. Rows represent individual peaks ranked by signal intensity. (F) Two representative examples of enhancers bound by SALL4 at day 5 that lose BRG1 co-occupancy and chromatin accessibility in the SALL4-het-KO (clone F1) cells. Both correspond to ChIP-seq peaks annotated as enhancer regions, as reported in GeneHancer (left) and VISTA Enhancer Browser (right).
Fig. 6. SALL4 recruits BAF to CNCC enhancers. (A) Heatmap showing BRG1 ChIP-seq signal at the genomic sites bound by SALL4 in WT cells at day 5 (n=17,137). Signal intensity was plotted across ±2 kb regions centred on peak summits. Rows represent individual peaks ranked by signal intensity. (B) Venn diagram showing peaks bound by SALL4 uniquely at day 5 and that lose accessibility in SALL4-het-KO. (C) Heatmap and average profiles show BRG1 ChIP-seq signal at day 5 at the BRG1 peaks lost in SALL4-het-KO (clone F1; n=13,505). Signal intensity was plotted across ±2 kb regions centred on peak summits. Rows represent individual peaks ranked by signal intensity. (D) Heatmap and average profiles show SALL4 CUT&RUN signal at the genomic sites that lose BRG1 in SALL4-het-KO cells at day 0 and day 5 (n=13,505). (E) Heatmaps and average profile show ATAC-seq signal at the genomic sites that lose BRG1 in SALL4-het-KO cells (clone F1; n=13,505). Signal intensity was plotted across ±2 kb regions centred on peak summits. Rows represent individual peaks ranked by signal intensity. (F) Two representative examples of enhancers bound by SALL4 at day 5 that lose BRG1 co-occupancy and chromatin accessibility in the SALL4-het-KO (clone F1) cells. Both correspond to ChIP-seq peaks annotated as enhancer regions, as reported in GeneHancer (left) and VISTA Enhancer Browser (right).CC BY · PubMed Central
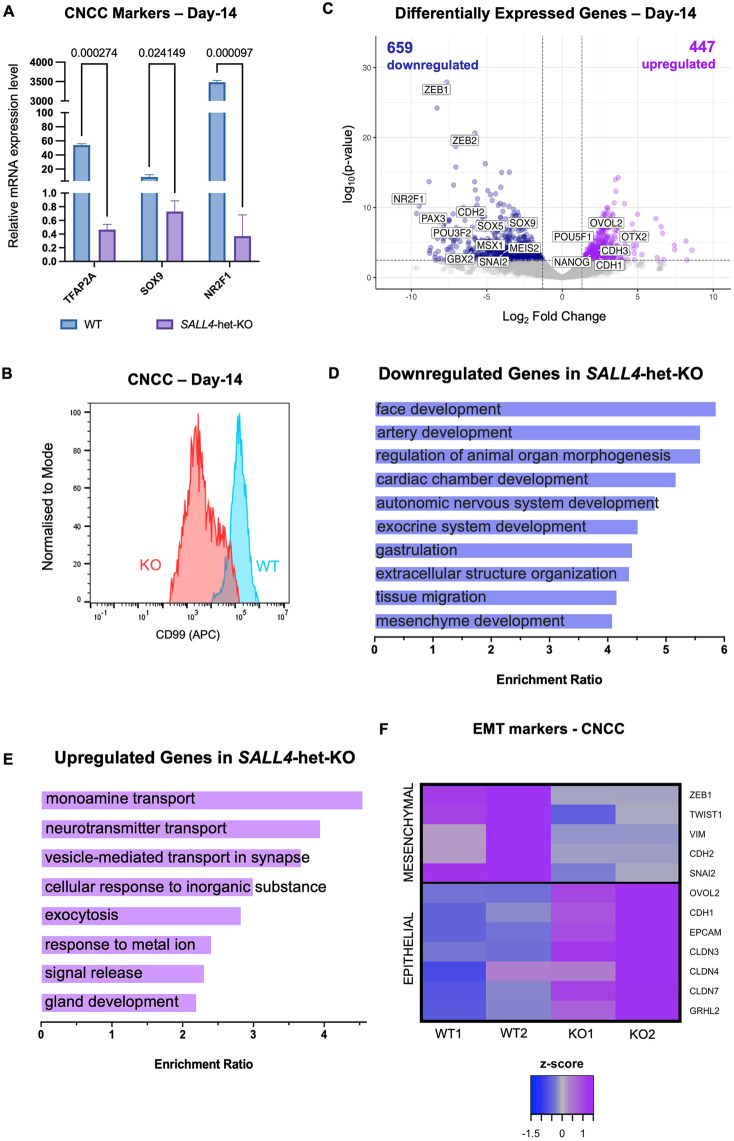
Fig. 7. CNCC induction and specification are impaired in SALL4-het-KO. (A) Relative mRNA expression of canonical CNCC markers in SALL4-WT and SALL4-het-KO cells at day 14 (n=2). Statistical significance was assessed using unpaired Student's t-test. 18S rRNA was used to normalise. Data are mean±s.e.m. (B) Flow cytometry for the CNCC surface marker CD99 in SALL4-WT and SALL4-het-KO (clone F1) CNCCs at day 14. (C) Volcano plot of genes differentially expressed in SALL4-het-KO relative to SALL4-WT in CNCCs (day 14). Blue dots (n=659) represent downregulated genes with Padj<0.05 and log2FoldChange<−1.5. Purple dots (n=447) represent upregulated genes with Padj<0.05 and log2FoldChange>1.5. (D,E) GO term enrichment for downregulated (D) and upregulated (E) genes in SALL4-het-KO cells (FDR<0.05). (F) Heatmap displaying the expression of canonical epithelial-to-mesenchymal transition (EMT) markers in SALL4-WT and SALL4-het-KO cells (day 14).
Fig. 7. CNCC induction and specification are impaired in SALL4-het-KO. (A) Relative mRNA expression of canonical CNCC markers in SALL4-WT and SALL4-het-KO cells at day 14 (n=2). Statistical significance was assessed using unpaired Student's t-test. 18S rRNA was used to normalise. Data are mean±s.e.m. (B) Flow cytometry for the CNCC surface marker CD99 in SALL4-WT and SALL4-het-KO (clone F1) CNCCs at day 14. (C) Volcano plot of genes differentially expressed in SALL4-het-KO relative to SALL4-WT in CNCCs (day 14). Blue dots (n=659) represent downregulated genes with Padj<0.05 and log2FoldChange<−1.5. Purple dots (n=447) represent upregulated genes with Padj<0.05 and log2FoldChange>1.5. (D,E) GO term enrichment for downregulated (D) and upregulated (E) genes in SALL4-het-KO cells (FDR<0.05). (F) Heatmap displaying the expression of canonical epithelial-to-mesenchymal transition (EMT) markers in SALL4-WT and SALL4-het-KO cells (day 14).CC BY · PubMed Central
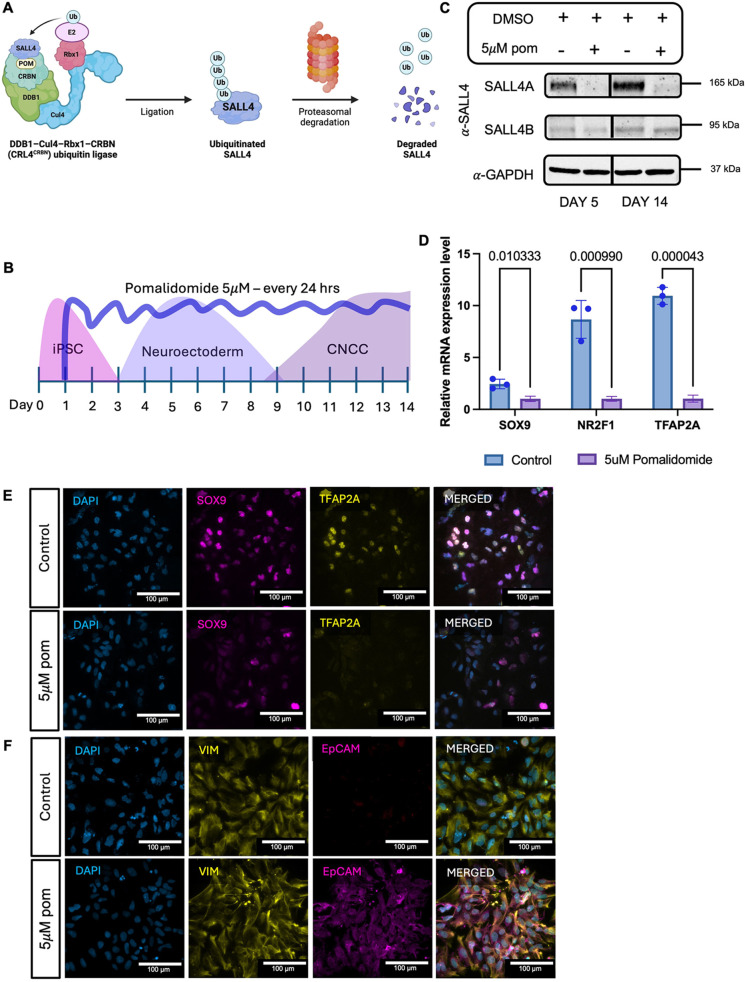
Fig. 8. SALL4A is the only SALL4 isoform necessary for CNCC specification. (A) Schematic of pomalidomide-mediated ubiquitin ligation. Ub, ubiquitin; POM, pomalidomide. CRBN, DDB1, Cul4 and Rbx1 are subunits of CRL4/CRBN E3 ubiquitin ligase. Created in BioRender by Demurtas, M., 2025. https://BioRender.com/oij5pkv. This figure was sublicensed under CC BY 4.0 terms. (B) Schematic representation of pomalidomide treatment during iPSC-to-CNCC differentiation protocol. (C) Time-course immunoblot for SALL4 in SALL4-WT at day 5 and day 14 after daily treatment with DMSO (control) or 5 µM pomalidomide (5 µM POM). (D) Relative mRNA expression of canonical CNCC markers (SOX9, TFAP2A and NR2F1) in SALL4-WT at day 14 treated with 5 µM pomalidomide or DMSO (control) daily for 14 days. Individual biological replicates (n=2) are displayed as circles. Statistical significance was assessed using unpaired Student's t-test. Data are mean±s.e.m. (E) Immunofluorescence labelling quantifying the expression of the canonical CNCC markers SOX9 and TFAP2A in SALL4-WT treated with 5 µM pomalidomide or DMSO (control) daily for 14 days. (F) Immunofluorescence labelling quantifying the expression of the canonical EMT markers EPCAM and VIM in SALL4-WT treated with 5 μM pomalidomide or DMSO (control) daily for 14 days. Scale bars: 100 µm.
Fig. 8. SALL4A is the only SALL4 isoform necessary for CNCC specification. (A) Schematic of pomalidomide-mediated ubiquitin ligation. Ub, ubiquitin; POM, pomalidomide. CRBN, DDB1, Cul4 and Rbx1 are subunits of CRL4/CRBN E3 ubiquitin ligase. Created in BioRender by Demurtas, M., 2025. https://BioRender.com/oij5pkv. This figure was sublicensed under CC BY 4.0 terms. (B) Schematic representation of pomalidomide treatment during iPSC-to-CNCC differentiation protocol. (C) Time-course immunoblot for SALL4 in SALL4-WT at day 5 and day 14 after daily treatment with DMSO (control) or 5 µM pomalidomide (5 µM POM). (D) Relative mRNA expression of canonical CNCC markers (SOX9, TFAP2A and NR2F1) in SALL4-WT at day 14 treated with 5 µM pomalidomide or DMSO (control) daily for 14 days. Individual biological replicates (n=2) are displayed as circles. Statistical significance was assessed using unpaired Student's t-test. Data are mean±s.e.m. (E) Immunofluorescence labelling quantifying the expression of the canonical CNCC markers SOX9 and TFAP2A in SALL4-WT treated with 5 µM pomalidomide or DMSO (control) daily for 14 days. (F) Immunofluorescence labelling quantifying the expression of the canonical EMT markers EPCAM and VIM in SALL4-WT treated with 5 μM pomalidomide or DMSO (control) daily for 14 days. Scale bars: 100 µm.CC BY · PubMed Central

Verification

Claims the paper makes

The claims and statistics of this paper haven’t been checked yet.

Run the check — free, no account needed. It reads the open-access text and checks the sources it cites.

A few free checks a day · papers already verified open instantly · results are public

Self-check

Percentages, sums and reported differences re-computed from the paper’s own numbers.

The self-check needs the paper’s full text.

Citations

Cites

Research works printed but not linked: 73

  1. Al-Baradie, R. , Yamada, K. , St Hilaire, C. , Chan, W.-M. , Andrews, C. , McIntosh, N. , Nakano, M. , Jean Martonyi, E. , Raymond, W. R. , Okumura, S. , et al. (2002). Duane Radial Ray Syndrome (Okihiro Syndrome) Maps to 20q13 and Results from Mutations in SALL4, a New Member of the SAL Family. · DOI · Paper page
  2. 10.1038/nature08733 · DOI
  3. Barnada, S. M. , Giner de Gracia, A. , Morenilla-Palao, C. , López-Cascales, M. T. , Scopa, C. , Waltrich, F. J. , Mikkers, H. M. M. , Cicardi, M. E. , Karlin, J. , Trotti, D. , et al. (2024). ARID1A-BAF coordinates ZIC2 genomic occupancy for epithelial-to-mesenchymal transition in cranial neural crest specification. The American Journal of Human Genetics. · DOI
  4. 10.1038/nature04684 · DOI
  5. 2016, Characterization of two distinct nucleosome remodeling and deacetylase (NuRD) complex assemblies in embryonic stem cells, Molecular and Cellular Proteomics, 15, 878, 10.1074/mcp.M115.053207 · DOI · Paper page
  6. Borozdin, W. , Boehm, D. , Leipoldt, M. , Wilhelm, C. , Reardon, W. , Clayton-Smith, J. , Becker, K. , Mühlendyck, H. , Winter, R. , Giray, O. , et al. (2004). SALL4 deletions are a common cause of Okihiro and acro-renal-ocular syndromes and confirm haploinsufficiency as the pathogenic mechanism. J Med Genet 41,. · DOI
  7. Chen, K. Q. , Anderson, A. , Kawakami, H. , Kim, J. , Barrett, J. and Kawakami, Y . (2022). Normal embryonic development and neonatal digit regeneration in mice overexpressing a stem cell factor, Sall 4. PLoS One 17,. · DOI
  8. Dash, S. and Trainor, P. A . (2020). The development, patterning and evolution of neural crest cell differentiation into cartilage and bone. Bone 137,. · DOI
  9. Donovan KA, A. J. N. R. Y. J. F. E. B. B. E. B. F. E . (2018). Thalidomide promotes degradation of SALL4, a transcription factor implicated in Duane Radial Ray syndrome. Elife. · DOI
  10. Fishilevich, S. , Nudel, R. , Rappaport, N. , Hadar, R. , Plaschkes, I. , Stein, T. I. , Rosen, N. , Kohn, A. , Twik, M. , Safran, M. , et al. (2017). GeneHancer: Genome-wide integration of enhancers and target genes in GeneCards. Database 2017,. · DOI
  11. Gopinathan, G. and Diekwisch, T. G. H . (2022). Epigenetics and Early Development. J Dev Biol 10,. · DOI
  12. Haensel, D. , Sun, P. , MacLean, A. L. , Ma, X. , Zhou, Y. , Stemmler, M. P. , Brabletz, S. , Berx, G. , Plikus, M. V , Nie, Q. , et al. (2019). An Ovol2-Zeb1 transcriptional circuit regulates epithelial directional migration and proliferation. EMBO Rep 20,. · DOI
  13. 10.1016/j.molcel.2010.05.004 · DOI · Paper page
  14. Herbreteau, G. , Airaud, F. , Pierre-Noël, E. , Vallée, A. , Bézieau, S. , Théoleyre, S. , Blons, H. , Garinet, S. and Denis, M. G . (2021). MEM: An algorithm for the reliable detection of microsatellite instability (MSI) on a small NGS panel in colorectal cancer. Cancers (Basel ) 13,. · DOI
  15. Hodges, C. , Kirkland, J. G. and Crabtree, G. R . (2016). The many roles of BAF (mSWI/SNF) and PBAF complexes in cancer. Cold Spring Harb Perspect Med 6,. · DOI
  16. Islam, Z. , Ali, A. M. , Naik, A. , Eldaw, M. , Decock, J. and Kolatkar, P. R . (2021). Transcription Factors: The Fulcrum Between Cell Development and Carcinogenesis. Front Oncol 11,. · DOI
  17. Jourdeuil, K. , Neilson, K. M. , Tavares, A. L. P. and Moody, S. A . (2025). Zmym2 Alters Expression of Key Craniofacial Genes. Genesis (United States ) 63,. · DOI
  18. 2017, Duane retraction syndrome: Causes, effects and management strategies, Clinical Ophthalmology, 11, 1917, 10.2147/OPTH.S127481 · DOI
  19. 10.1016/j.molcel.2019.08.010 · DOI
  20. 2023, Integrative role of the sall4 gene: From thalidomide embryopathy to genetic defects of the upper limb, internal organs, cerebral midline, and pituitary, Horm Res Paediatr, 97, 106
  21. 10.1002/humu.20215 · DOI
  22. 10.1002/humu.20215 · DOI
  23. Kong, N. R. , Bassal, M. A. , Tan, H. K. , Kurland, J. V. , Yong, K. J. , Young, J. J. , Yang, Y. , Li, F. , Lee, J. D. , Liu, Y. , et al. (2021). Zinc Finger Protein SALL4 Functions through an AT-Rich Motif to Regulate Gene Expression. Cell Rep 34,. · DOI · Paper page
  24. 10.1093/nar/gkae940 · DOI
  25. 10.1016/j.exphem.2016.11.008 · DOI
  26. 10.1016/j.neuron.2007.06.019 · DOI · Paper page
  27. 10.1038/nrg887 · DOI · Paper page
  28. 10.1093/nar/gkz401 · DOI · Paper page
  29. 10.2147/OTT.S157119 · DOI
  30. 10.1073/pnas.1801253115 · DOI · Paper page
  31. Liu, B. H. , Liu, M. , Radhakrishnan, S. , Jaladanki, C. K. , Gao, C. , Tang, J. P. , Kumari, K. , Go, M. L. , Vu, K. A. L. , Seo, H.-S. , et al. (2024). Targeting transcription factors through an IMiD independent zinc finger domain. · DOI
  32. Love, M. I. , Huber, W. and Anders, S . (2014). Moderated estimation of fold change and dispersion for RNA-seq data with DESeq2. Genome Biol 15,. · DOI · Paper page
  33. Lu, J. , Jeong, H. , Kong, N. , Yang, Y. , Carroll, J. , Luo, H. R. , Silberstein, L. E. , Ma, Y. and Chai, L . (2009). Stem cell factor SALL4 represses the transcriptions of PTEN and SALL1 through an epigenetic repressor complex. PLoS One 4,. · DOI
  34. Ma, X. , Huang, R. , Li, G. , Zhang, T. and Ma, J . (2022). A de novo mutation of SALL4 in a Chinese family with Okihiro syndrome. Mol Med Rep 25,. · DOI
  35. 10.1038/s41589-018-0129-x · DOI · Paper page
  36. 10.1016/j.ydbio.2012.01.013 · DOI
  37. 10.1242/dev.139113 · DOI · Paper page
  38. Mitchell, Z. H. , den Hoed, J. , Claassen, W. , Demurtas, M. , Deelen, L. , Campeau, P. M. , Liu, K. , Fisher, S. E. and Trizzino, M. (2025). CHD3 regulates BMP signalling response during cranial neural crest cell specification. · DOI
  39. 10.1016/j.stem.2024.04.001 · DOI
  40. Pagliaroli, L. , Porazzi, P. , Curtis, A. T. , Scopa, C. , Mikkers, H. M. M. , Freund, C. , Daxinger, L. , Deliard, S. , Welsh, S. A. , Offley, S. , et al. (2021). Inability to switch from ARID1A-BAF to ARID1B-BAF impairs exit from pluripotency and commitment towards neural crest formation in ARID1B-related neurodevelopmental disorders. Nat Commun 12,. · DOI
  41. 10.1016/j.molcel.2020.11.046 · DOI · Paper page
  42. Pappas, M. P. , Kawakami, H. , Corcoran, D. , Chen, K. Q. , Scott, E. P. , Wong, J. , Gearhart, M. D. , Nishinakamura, R. , Nakagawa, Y. and Kawakami, Y . (2024). Sall4 regulates posterior trunk mesoderm development by promoting mesodermal gene expression and repressing neural genes in the mesoderm. Development (Cambridge ) 151,. · DOI
  43. Patthey, C. , Gunhaga, L. and Edlund, T . (2008). Early development of the central and peripheral nervous systems is coordinated by Wnt and BMP signals. PLoS One 3,. · DOI
  44. 10.1016/j.ydbio.2018.05.018 · DOI
  45. Polit, L. , Kerdivel, G. , Gregoricchio, S. , Esposito, M. , Guillouf, C. and Boeva, V . (2021). CHIPIN: ChIP-seq inter-sample normalization based on signal invariance across transcriptionally constant genes. BMC Bioinformatics 22,. · DOI
  46. 10.1016/j.cell.2015.08.036 · DOI
  47. 10.1093/bioinformatics/btq033 · DOI · Paper page
  48. 10.1038/nature09692 · DOI · Paper page
  49. 10.1093/nar/gkw257 · DOI · Paper page
  50. 10.1128/MCB.00419-10 · DOI · Paper page
  51. 2021, Avadomide Induces Degradation of ZMYM2 Fusion Oncoproteins in Hematologic Malignancies, Blood Cancer Discov, 2, 251
  52. Rgen Kohlhase, J. , Heinrich, M. , Schubert, L. , Liebers, M. , Kispert, A. , Laccone, F. , Turnpenny, P. , Winter, R. M. and Reardon, W. (2002). Okihiro syndrome is caused by SALL4 mutations. Oxford University Press 11, 2979–2987. · DOI · Paper page
  53. Roth, D. M. , Bayona, F. , Baddam, P. and Graf, D . (2021). Craniofacial Development: Neural Crest in Molecular Embryology. Head Neck Pathol 15,. · DOI
  54. Schindelin, J. , Arganda-Carreras, I. , Frise, E. , Kaynig, V. , Longair, M. , Pietzsch, T. , Preibisch, S. , Rueden, C. , Saalfeld, S. , Schmid, B ., et al. (2012). Fiji: An open-source platform for biological-image analysis. Nat Methods 9, 676–682. · DOI · Paper page
  55. Sievers, Q. L. , Petzold, G. , Bunker, R. D. , Renneville, A. , Słabicki, M. , Liddicoat, B. J. , Abdulrahman, W. , Mikkelsen, T. , Ebert, B. L. and Thomä, N. H . (2018). Defining the human C2H2 zinc finger degrome targeted by thalidomide analogs through CRBN. Science ( 1979 ) 362,. · DOI · Paper page
  56. 10.1242/dev.070276 · DOI
  57. Szabó, A. , Szabó, S. and Mayor, R. (2018). Mechanisms of Neural Crest Migration. · DOI
  58. Tahara, N. , Kawakami, H. , Chen, K. Q. , Anderson, A. , Peterson, M. Y. , Gong, W. , Shah, P. , Hayashi, S. , Nishinakamura, R. , Nakagawa, Y. , et al. (2019). Sall4 regulates neuromesodermal progenitors and their descendants during body elongation in mouse embryos. Development (Cambridge ) 146,. · DOI · Paper page
  59. 10.1016/j.gene.2016.02.019 · DOI · Paper page
  60. 2006, A family with features overlapping Okihiro syndrome, hemifacial microsomia and isolated Duane anomaly caused by a novel SALL4 mutation, Am J Med Genet, 140, 222
  61. 10.1038/nrg3623 · DOI · Paper page
  62. Wang, F. , Zhao, W. , Kong, N. , Cui, W. and Chai, L . (2014). The next new target in leukemia: The embryonic stem cell gene SALL4. Mol Cell Oncol 1,. · DOI
  63. Wang, B. , Li, C. , Ming, J. , Wu, L. , Fang, S. , Huang, Y. , Lin, L. , Liu, H. , Kuang, J. , Zhao, C. , et al. (2023). The NuRD complex cooperates with SALL4 to orchestrate reprogramming. Nat Commun 14,. · DOI · Paper page
  64. 10.1083/jcb.201408106 · DOI
  65. 10.1038/s41589-020-0645-3 · DOI
  66. Yang, J . (2018). SALL4 as a transcriptional and epigenetic regulator in normal and leukemic hematopoiesis. Biomark Res 6,. · DOI
  67. 10.1002/stem.14 · DOI · Paper page
  68. 10.1038/ncb1481 · DOI · Paper page
  69. Zhang, Y. , Liu, T. , Meyer, C. A. , Eeckhoute, J. , Johnson, D. S. , Bernstein, B. E. , Nussbaum, C. , Myers, R. M. , Brown, M. , Li, W. , et al. (2008). Model-based analysis of ChIP-Seq (MACS). Genome Biol 9,. · DOI · Paper page
  70. 10.1016/j.stem.2018.12.001 · DOI
  71. 10.1074/jbc.RA118.007018 · DOI
  72. Zhang, H. , Wang, X. , Li, J. , Shi, R. and Ye, Y . (2021). BAF Complex in Embryonic Stem Cells and Early Embryonic Development. Stem Cells Int 2021,. · DOI
  73. Zheng, Z. H. , Sam, T. W. , Zeng, Y. , Chu, J. J. H. and Loh, Y. H . (2021). Chromatin Regulation in Development: Current Understanding and Approaches. Stem Cells Int 2021,. · DOI

Metadata

Authors
Demurtas, M., Barnada, S. M., van Domselaar, E., Mitchell, Z. H., Deelen, L., & Trizzino, M.
Affiliations
  • Imperial College London (GB)
  • Thomas Jefferson University (US)
Corresponding author
Trizzino, Marco
Venue
Development
Publisher
openRxiv
Published
2025-06-10
Volume
152
Issue
24
ISSN
0950-1991 (ISSN-L)
OpenAlex
W4416785166
Cited by
2
References
1
Citations by year
2026: 1 · 2025: 1
FWCI
0.60
Type
journal article
Language
en
Open access
Locations
  • Development (publishedVersion, cc-by)
  • bioRxiv (Cold Spring Harbor Laboratory) (acceptedVersion, cc-by)
  • PubMed (publishedVersion)
  • PubMed Central (publishedVersion, cc-by)
  • Spiral (Imperial College London) (submittedVersion, cc-by)
Funders
  • Wellcome Trust (104931/Z/14/Z)
  • G. Harold and Leila Y. Mathers Foundation
  • Imperial College London
  • Biotechnology and Biological Sciences Research Council (BB/L015129/1, BB/Y000854/1)
Topics
  • Life Sciences › Biochemistry, Genetics and Molecular Biology › Molecular Biology › Developmental Biology and Gene Regulation
  • Life Sciences › Biochemistry, Genetics and Molecular Biology › Molecular Biology › Genomics and Chromatin Dynamics
  • Health Sciences › Medicine › Surgery › Craniofacial Disorders and Treatments
Keywords
SALL4, BAF chromatin remodeling complex, neural crest induction, enhancer activation, enhancer repression, haploinsufficiency, neural plate border, craniofacial anomalies, transcriptional regulation, induced pluripotent stem cells
MeSH terms
Animals, DNA-Binding Proteins, Enhancer Elements, Genetic, Humans, Neural Crest, Transcription Factors, Gene Expression Regulation, Developmental, Cell Lineage, Neural Plate, Induced Pluripotent Stem Cells

About these checks

Registry, retraction, Cites and statistics results are computed, not judged, with one exception: a printed reference that no index lists is read once by a model before it counts as a citation error. Claims are extracted by a model and kept only when their quote appears verbatim in the text; each cited source is then checked, with a model’s help, for whether it says what the claim relies on. Those verdicts can be wrong — read the claim’s quote and the cited source before relying on one.

Statistics and arithmetic are recomputed, not judged.

Confidence bands are shown only for fields calibrated on our annotated test set. None is calibrated yet, so no band is shown.

What counts as a claim ›How we measure confidence ›How we check this ›

Are you an author, or do you see a problem with this page? Request a review