PreprintCited by 3Protein Structure and DynamicsIon channel regulation and functionMachine Learning in Bioinformatics

The DOI matches its Crossref record; 3 of the 3 references it cites were found in a registry or an index.

A LARGE-SCALE EVOLUTIONARY AND STRUCTURAL ANALYSIS OF CLC CHANNELS AND TRANSPORTERS

Open access

Preprint — published as 10.1002/pro.70389 · Paper page

Abstract

The CLC family of membrane transport proteins consists of chloride channels and anion/proton antiporters that share a similar structural scaffold. How the same fold accommodates two fundamentally distinct mechanisms is poorly understood, and while the current set of experimental structures provide some information, the changes appear limited. In this study, we show that it is possible to scale up the structural information available using AlphaFold2 predictions and identify additional structural differences associated with each mechanistic class. A phylogenetic analysis is carried out across all known CLC genes to expand the classification to include 569 channel and 1,051 transporter homologs that have been modeled. Using distance matrices, we validate AlphaFold2’s ability to detect subtle structural differences among experimentally determined CLCs and use a random forest classifier to predict CLC channel vs. transporter sub-types to learn the structural changes that are the most important in the decision. The structural changes identified overlap with and contextualize the changes observed in experimental structures, expanding structural information across sequence space. The highest ranked change includes a contraction of distances between dimerization interface helices αH, αI, αP & αQ relative to the subunit core in the channel sub-types. This study lays out an approach for quantitative, large-scale structural analyses beyond experimental data and paves the way towards structural studies expanding on different conformational states and other protein families.

Overview

The claims and statistics of this paper haven’t been checked yet.

Run the check — free, no account needed. It reads the open-access text and checks the sources it cites.

A few free checks a day · papers already verified open instantly · results are public

Integrity signals

Registry

Crossref · 10.1101/2025.07.07.663545

Cites

3 of 3 references verified0 citation errors · 0 not checkable

Statistics

Figures

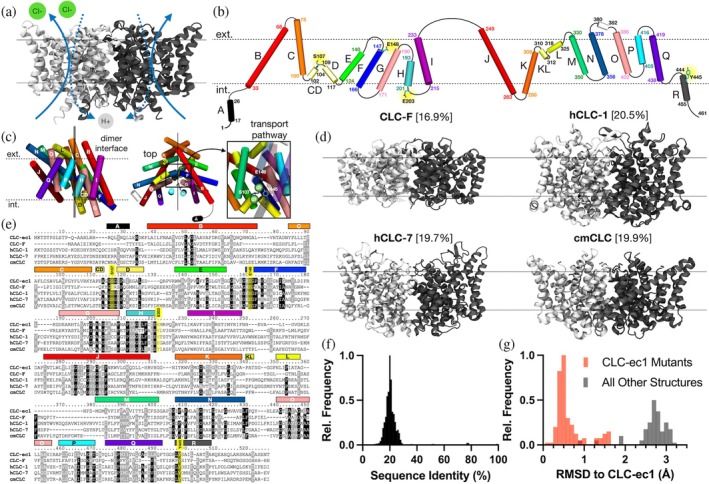
FIGURE 1 Sequence and structural diversity of CLCs. (a) CLC‐ec1 dimer (PDB ID: 1OTS) with arrows illustrating 2:1 proton‐coupled chloride transport occurring independently in each subunit. Approximate membrane interface positions are depicted by lines. (b) Topology of CLC‐ec1 helices αA‐R, maintaining the approximate orientation of each helix in the folded subunit within the membrane plane (dotted lines). Each helix is color‐coded to highlight the inverted topology repeat. Numbers indicate flanking residue positions; key functional residues are highlighted and shown. (c) Orthogonal views showing transmembrane helix positions in the folded subunit. The axis of inverted symmetry is depicted as solid lines. Left, view of the dimer interface (αQ, αP, αH, and αI). Center, top view highlighting the region containing the transport pathway (box). Right, zoomed‐in view of the transport pathway from inside the membrane plane, highlighting bound chloride ions and key residues: S107, Y445, and E148. (d) Structures of the membrane embedded regions of four representative CLC homologs: CLC‐F (PDB ID: 6D0J), hCLC‐1 (PDB ID: 6COY), hCLC‐7 (PDB ID: 8HVT), and cmCLC (PDB ID: 3ORG), with sequence identity relative to CLC‐ec1 shown in brackets. (e) Multiple sequence alignment of the same CLC homologs, highlighting shared sequence identity (dark gray) and similarity (light gray). (f) Histogram of sequence identity for each CLC homolog in the InterPro (IPR) database to CLC‐ec1. (g) Root mean squared deviation (RMSD) of all Cα atoms of the solved structures relative to CLC‐ec1 (PDB ID: 1OTS); CLC‐ec1 structures and their mutants are represented in red.
FIGURE 1 Sequence and structural diversity of CLCs. (a) CLC‐ec1 dimer (PDB ID: 1OTS) with arrows illustrating 2:1 proton‐coupled chloride transport occurring independently in each subunit. Approximate membrane interface positions are depicted by lines. (b) Topology of CLC‐ec1 helices αA‐R, maintaining the approximate orientation of each helix in the folded subunit within the membrane plane (dotted lines). Each helix is color‐coded to highlight the inverted topology repeat. Numbers indicate flanking residue positions; key functional residues are highlighted and shown. (c) Orthogonal views showing transmembrane helix positions in the folded subunit. The axis of inverted symmetry is depicted as solid lines. Left, view of the dimer interface (αQ, αP, αH, and αI). Center, top view highlighting the region containing the transport pathway (box). Right, zoomed‐in view of the transport pathway from inside the membrane plane, highlighting bound chloride ions and key residues: S107, Y445, and E148. (d) Structures of the membrane embedded regions of four representative CLC homologs: CLC‐F (PDB ID: 6D0J), hCLC‐1 (PDB ID: 6COY), hCLC‐7 (PDB ID: 8HVT), and cmCLC (PDB ID: 3ORG), with sequence identity relative to CLC‐ec1 shown in brackets. (e) Multiple sequence alignment of the same CLC homologs, highlighting shared sequence identity (dark gray) and similarity (light gray). (f) Histogram of sequence identity for each CLC homolog in the InterPro (IPR) database to CLC‐ec1. (g) Root mean squared deviation (RMSD) of all Cα atoms of the solved structures relative to CLC‐ec1 (PDB ID: 1OTS); CLC‐ec1 structures and their mutants are represented in red.CC BY-NC-ND · PubMed Central
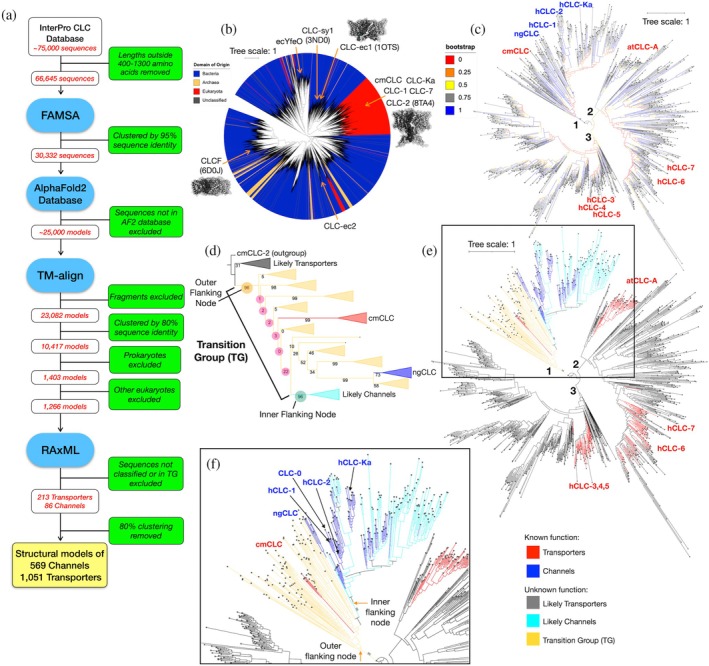
FIGURE 2 Phylogenetic analysis of the CLC Family. (a) Full sequence‐curation pipeline from the IPR database to the final model‐fitting analysis. (b) Approximate maximum likelihood tree of 10,417 CLC sequences with FastTree; leaves colored by source organism domain and notable sequences are identified (example PDBs in brackets). (c) Maximum likelihood tree of 1266 eukaryotic CLC sequences with RAxML from the larger eukaryotic clade, showing bootstrap values. The three main branches are labeled 1–3. (d) Expansion of bootstrap support values along branch 1 showing a transition region demarcated by highly supported splits (inner and outer flanking node, both 96%) that separate channels and transporters. (e) Sequences are colored according to their known function (transporters, red; channels, blue), proximate sequences (likely transporters, gray; likely channels, cyan) and the transition group (TG, yellow). (f) Close‐up view of branch 1 containing the transition group flanking nodes.
FIGURE 2 Phylogenetic analysis of the CLC Family. (a) Full sequence‐curation pipeline from the IPR database to the final model‐fitting analysis. (b) Approximate maximum likelihood tree of 10,417 CLC sequences with FastTree; leaves colored by source organism domain and notable sequences are identified (example PDBs in brackets). (c) Maximum likelihood tree of 1266 eukaryotic CLC sequences with RAxML from the larger eukaryotic clade, showing bootstrap values. The three main branches are labeled 1–3. (d) Expansion of bootstrap support values along branch 1 showing a transition region demarcated by highly supported splits (inner and outer flanking node, both 96%) that separate channels and transporters. (e) Sequences are colored according to their known function (transporters, red; channels, blue), proximate sequences (likely transporters, gray; likely channels, cyan) and the transition group (TG, yellow). (f) Close‐up view of branch 1 containing the transition group flanking nodes.CC BY-NC-ND · PubMed Central
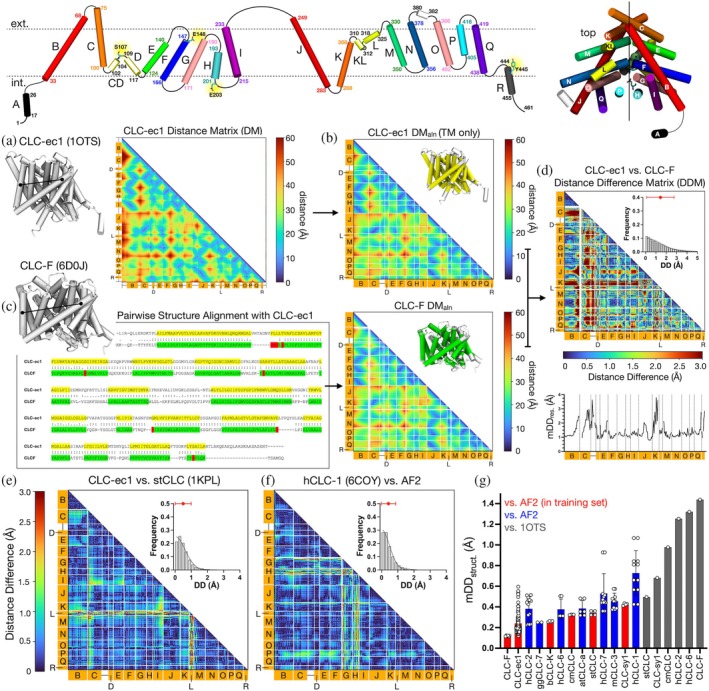
FIGURE 3 Quantifying structural differences among CLCs using distance matrices. Top, the topology map and subunit assembly for CLC‐ec1 are provided as a structural guide. (a) Residue‐residue distance matrix (DM) for CLC‐ec1 (PDB ID: 1OTS), computed from all pairwise Cα distances. (b) Aligned and truncated DMs featuring transmembrane helix segments along a common structural alignment, DMaln. White lines indicate the ends of transmembrane helices. (c) DMaln for CLC‐F (PDB ID: 6D0J), where filtered residues are annotated (green) via structural alignment with CLC‐ec1; gaps in the structural alignment (red) create gaps in the resulting distance matrix (white lines). (d) Absolute distance difference matrix (DDM) between CLC‐ec1 and CLC‐F. Frequency histogram of absolute distance differences (DD) is shown in the inset plot, with mean DDstruct (mDDstruct) ± SD, a metric for comparing global distance differences, plotted in red. Mean absolute distance differences by residue (mDDres) are shown as a line plot below. (e) DDM for stCLC (PDB ID: 1KPL) and CLC‐ec1. (f) DDM for hCLC‐1 (PDB ID: 6COY) and its AF2 predicted model. (g) Summary of mDDstruct values ranked by minimum value, for experimental CLC structures compared to CLC‐ec1 PDB ID 1OTS (gray), and CLC homologs compared to their AF2 predictions. The AF2 values are designated by whether the experimental CLC structure was eligible to be in the original training set (red) or solved after AF2 (blue).
FIGURE 3 Quantifying structural differences among CLCs using distance matrices. Top, the topology map and subunit assembly for CLC‐ec1 are provided as a structural guide. (a) Residue‐residue distance matrix (DM) for CLC‐ec1 (PDB ID: 1OTS), computed from all pairwise Cα distances. (b) Aligned and truncated DMs featuring transmembrane helix segments along a common structural alignment, DMaln. White lines indicate the ends of transmembrane helices. (c) DMaln for CLC‐F (PDB ID: 6D0J), where filtered residues are annotated (green) via structural alignment with CLC‐ec1; gaps in the structural alignment (red) create gaps in the resulting distance matrix (white lines). (d) Absolute distance difference matrix (DDM) between CLC‐ec1 and CLC‐F. Frequency histogram of absolute distance differences (DD) is shown in the inset plot, with mean DDstruct (mDDstruct) ± SD, a metric for comparing global distance differences, plotted in red. Mean absolute distance differences by residue (mDDres) are shown as a line plot below. (e) DDM for stCLC (PDB ID: 1KPL) and CLC‐ec1. (f) DDM for hCLC‐1 (PDB ID: 6COY) and its AF2 predicted model. (g) Summary of mDDstruct values ranked by minimum value, for experimental CLC structures compared to CLC‐ec1 PDB ID 1OTS (gray), and CLC homologs compared to their AF2 predictions. The AF2 values are designated by whether the experimental CLC structure was eligible to be in the original training set (red) or solved after AF2 (blue).CC BY-NC-ND · PubMed Central
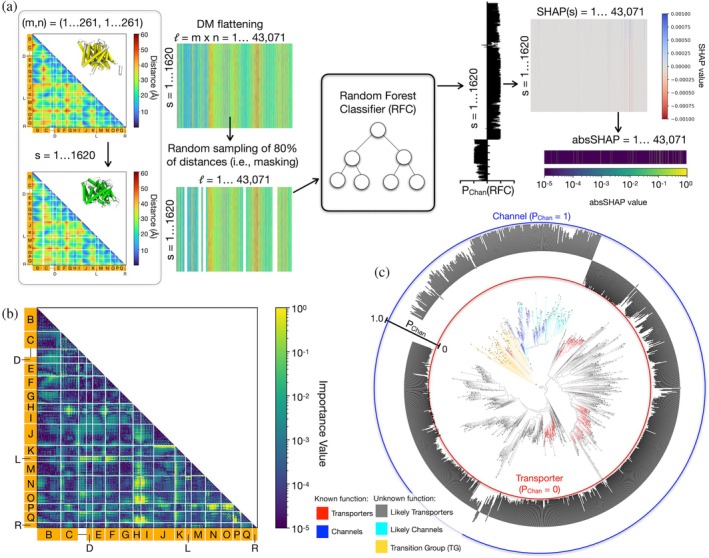
FIGURE 4 Structure analysis via large‐scale model‐fitting. (a) A graphic describing the model‐fitting approach for large‐scale structure analysis. (b) 2D map of importance values corresponding to the structural elements of CLCs. (c) Channel probabilities assigned by a random forest classifier trained on likely transporters and channels without masking among CLCs in the eukaryotic phylogeny.
FIGURE 4 Structure analysis via large‐scale model‐fitting. (a) A graphic describing the model‐fitting approach for large‐scale structure analysis. (b) 2D map of importance values corresponding to the structural elements of CLCs. (c) Channel probabilities assigned by a random forest classifier trained on likely transporters and channels without masking among CLCs in the eukaryotic phylogeny.CC BY-NC-ND · PubMed Central
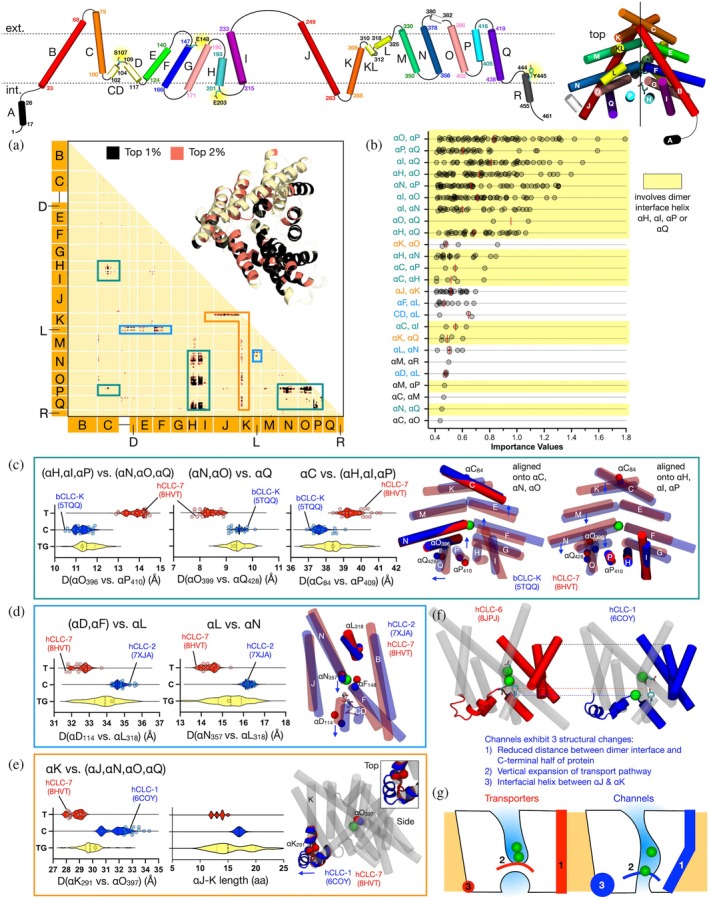
FIGURE 5 Structural differences between CLC channels and transporters associated with highest‐ranked importance. Top, a cartoon showing CLC‐ec1's helical topology and subunit assembly as a guide. (a) Distance positions associated with the top 1% (black) and 2% (salmon) importance values from the classification. Background—yellow, indicates positions ranking below 2%. Boxes outline 3 distinct structural clusters (teal, blue, orange). Inset—top 1% and 2% importance values are mapped onto the structure of CLC‐ec1. Transparent protein segments were not included in the analysis. (b) Ranking of the peak importance values from the top 1%, grouped into structural clusters. Median is indicated by the red line. Regions containing at least one of the dimerization interface helices (αH, αI, αP, or αQ) are highlighted in yellow. (c–e) Largest importance value distance distributions for residue pairs in each cluster according to phylogenetic classification (transporter—T, red; channel—C, blue; transition group—TG, yellow). AF2 distances are shown as violin plots with distances from experimental structures shown as overlaid scatter points. Structural changes are shown for (c) channel bCLC‐K (PDB ID: 5TQQ) versus transporter hCLC‐7 (PDB ID: 8HVT), aligned on helices αC, αN, αO (left) and αH, αI, αP (right), (d) channel hCLC‐2 (PDB ID: 7XJA) versus transporter hCLC‐7 (PDB ID: 8HVT) aligned helix αL and (e) channel hCLC‐1 (PDB ID: 6COY) versus transporter hCLC‐7 (PDB ID: 8HVT) aligned on the full structure. (f) Experimental structures of hCLC‐1 channel and hCLC‐6 transporter with resolved chloride ions highlighting the most important changes aligned onto αH. (g) Cartoon summarizing the most important structural changes identified in predicting eukaryotic CLC channels versus transporters: (1) rectangle at right—inward movement of dimerization interface helices, (2) line—movement of αC‐D linker leading to a vertical expansion of the transport pathway, and (3) circle—αJ‐K linker helix insertion.
FIGURE 5 Structural differences between CLC channels and transporters associated with highest‐ranked importance. Top, a cartoon showing CLC‐ec1's helical topology and subunit assembly as a guide. (a) Distance positions associated with the top 1% (black) and 2% (salmon) importance values from the classification. Background—yellow, indicates positions ranking below 2%. Boxes outline 3 distinct structural clusters (teal, blue, orange). Inset—top 1% and 2% importance values are mapped onto the structure of CLC‐ec1. Transparent protein segments were not included in the analysis. (b) Ranking of the peak importance values from the top 1%, grouped into structural clusters. Median is indicated by the red line. Regions containing at least one of the dimerization interface helices (αH, αI, αP, or αQ) are highlighted in yellow. (c–e) Largest importance value distance distributions for residue pairs in each cluster according to phylogenetic classification (transporter—T, red; channel—C, blue; transition group—TG, yellow). AF2 distances are shown as violin plots with distances from experimental structures shown as overlaid scatter points. Structural changes are shown for (c) channel bCLC‐K (PDB ID: 5TQQ) versus transporter hCLC‐7 (PDB ID: 8HVT), aligned on helices αC, αN, αO (left) and αH, αI, αP (right), (d) channel hCLC‐2 (PDB ID: 7XJA) versus transporter hCLC‐7 (PDB ID: 8HVT) aligned helix αL and (e) channel hCLC‐1 (PDB ID: 6COY) versus transporter hCLC‐7 (PDB ID: 8HVT) aligned on the full structure. (f) Experimental structures of hCLC‐1 channel and hCLC‐6 transporter with resolved chloride ions highlighting the most important changes aligned onto αH. (g) Cartoon summarizing the most important structural changes identified in predicting eukaryotic CLC channels versus transporters: (1) rectangle at right—inward movement of dimerization interface helices, (2) line—movement of αC‐D linker leading to a vertical expansion of the transport pathway, and (3) circle—αJ‐K linker helix insertion.CC BY-NC-ND · PubMed Central

Verification

Claims the paper makes

The claims and statistics of this paper haven’t been checked yet.

Run the check — free, no account needed. It reads the open-access text and checks the sources it cites.

A few free checks a day · papers already verified open instantly · results are public

Self-check

Percentages, sums and reported differences re-computed from the paper’s own numbers.

The self-check needs the paper’s full text.

Citations

Cites

Show all 3 references

Research works printed but not linked: 48

  1. 10.1016/j.bbamem.2010.02.022 · DOI
  2. 10.1080/01621459.2023.2197686 · DOI
  3. 10.1074/jbc.M502890200 · DOI
  4. 10.1126/science.277.5331.1453 · DOI
  5. 10.1093/nar/gkae1082 · DOI
  6. 10.1098/rspb.2009.1679 · DOI · Paper page
  7. 10.1074/jbc.M502826200 · DOI
  8. 10.7554/eLife.63288 · DOI
  9. 10.1002/pro.4353 · DOI · Paper page
  10. 10.7554/eLife.53479 · DOI · Paper page
  11. 10.1038/nature05013 · DOI
  12. 10.1038/415287a · DOI · Paper page
  13. 10.1126/science.1082708 · DOI · Paper page
  14. 10.1126/science.1195230 · DOI · Paper page
  15. 10.1126/science.1195230 · DOI · Paper page
  16. 10.1152/physiol.00030.2009 · DOI
  17. 10.1038/sj.emboj.7601107 · DOI
  18. 10.3389/fncel.2014.00143 · DOI · Paper page
  19. 10.1021/cn400032z · DOI
  20. 10.1016/0263-7855(96)00018-5 · DOI · Paper page
  21. 10.1109/MCSE.2007.55 · DOI · Paper page
  22. 10.1038/nature01000 · DOI
  23. 10.1073/pnas.0804503105 · DOI · Paper page
  24. 10.7554/eLife.11189 · DOI
  25. 10.1073/pnas.91.15.6943 · DOI
  26. 10.1016/S0092-8674(01)00206-9 · DOI · Paper page
  27. 10.1093/bioinformatics/btz305 · DOI
  28. 10.1038/emboj.2011.137 · DOI
  29. 10.1093/nar/gkab301 · DOI
  30. 10.1085/jgp.200810112 · DOI
  31. 10.1038/nsmb.1466 · DOI · Paper page
  32. 10.48550/arXiv.1705.07874 · DOI · Paper page
  33. Lundberg, S. M. , & Lee, S.-I . (2017). A Unified Approach to Interpreting Model Predictions. Advances in Neural Information Processing Systems, 30. https://proceedings.neurips.cc/paper_files/paper/2017/hash/8a20a8621978632d76c43dfd28b67767-Abstract.html
  34. 10.1074/jbc.M110.125971 · DOI
  35. 10.1073/pnas.0708639104 · DOI
  36. 10.1143/JPSJ.32.1331 · DOI
  37. 10.1038/nature20812 · DOI · Paper page
  38. 10.7554/eLife.36629 · DOI · Paper page
  39. 10.48550/arXiv.1201.0490 · DOI · Paper page
  40. 10.1038/nature03720 · DOI
  41. 10.1016/j.febslet.2005.12.054 · DOI
  42. 10.1038/nature09556 · DOI
  43. 10.1085/jgp.113.3.457 · DOI
  44. 10.1038/nature03860 · DOI
  45. 10.1371/journal.pcbi.1010483 · DOI · Paper page
  46. 10.3389/fphys.2014.00378 · DOI
  47. 10.1016/S1574-0005(02)03016-3 · DOI
  48. 10.3390/cells11030366 · DOI

Metadata

Authors
Mishra, A., Vázquez, G. D., & Robertson, J. L.
Affiliations
Washington University in St. Louis (US)
Corresponding author
Robertson, Janice L.
Venue
Protein Science
Publisher
openRxiv
Published
2025-07-10
Volume
34
Issue
12
Pages
e70389-e70389
ISSN
0961-8368 (ISSN-L)
OpenAlex
W4416540132
Cited by
3
References
3
Citations by year
2026: 3
FWCI
0.90
Type
journal article
Language
en
Open access
Locations
  • Protein Science (publishedVersion, cc-by-nc-nd)
  • bioRxiv (Cold Spring Harbor Laboratory) (acceptedVersion)
  • Europe PMC (PubMed Central) (publishedVersion, cc-by-nc-nd)
  • PubMed (publishedVersion)
  • PubMed Central (submittedVersion)
Funders
  • National Institute of Neurological Disorders and Stroke (R03NS133680)
  • National Heart Lung and Blood Institute (T32HL007081)
Topics
  • Life Sciences › Biochemistry, Genetics and Molecular Biology › Molecular Biology › Protein Structure and Dynamics
  • Life Sciences › Biochemistry, Genetics and Molecular Biology › Molecular Biology › Ion channel regulation and function
  • Life Sciences › Biochemistry, Genetics and Molecular Biology › Molecular Biology › Machine Learning in Bioinformatics
Keywords
chloride channels, protein structure prediction, AlphaFold2, phylogenetic analysis, structural classification, Shapley value, protein evolution

About these checks

Registry, retraction, Cites and statistics results are computed, not judged, with one exception: a printed reference that no index lists is read once by a model before it counts as a citation error. Claims are extracted by a model and kept only when their quote appears verbatim in the text; each cited source is then checked, with a model’s help, for whether it says what the claim relies on. Those verdicts can be wrong — read the claim’s quote and the cited source before relying on one.

Statistics and arithmetic are recomputed, not judged.

Confidence bands are shown only for fields calibrated on our annotated test set. None is calibrated yet, so no band is shown.

What counts as a claim ›How we measure confidence ›How we check this ›

Are you an author, or do you see a problem with this page? Request a review

How to cite

Cite CoChat for the checks on this page, and the paper for its own findings.

This page
CoChat. (2026). Citation check: A LARGE-SCALE EVOLUTIONARY AND STRUCTURAL ANALYSIS OF CLC CHANNELS AND TRANSPORTERS. https://app.cochat.ai/papers/10.1101/2025.07.07.663545
The paper
Mishra, A., Vázquez, G. D., & Robertson, J. L. (2025). A LARGE-SCALE EVOLUTIONARY AND STRUCTURAL ANALYSIS OF CLC CHANNELS AND TRANSPORTERS. Protein Science. https://doi.org/10.1101/2025.07.07.663545