

The DOI matches its Crossref record; 5 of the 5 references it cites were found in a registry or an index.
Evaluating phase separation in live cells: diagnosis, caveats, and functional consequences
Abstract
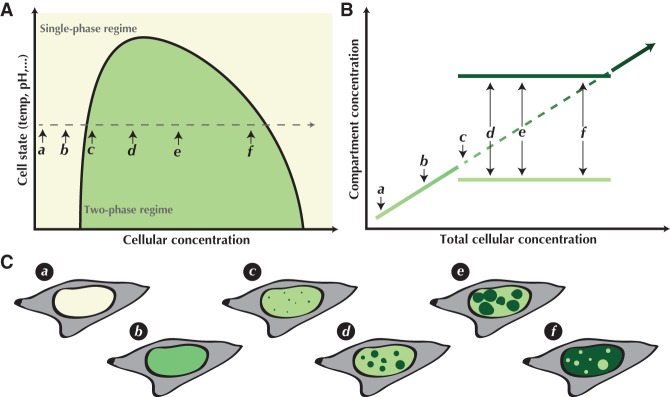
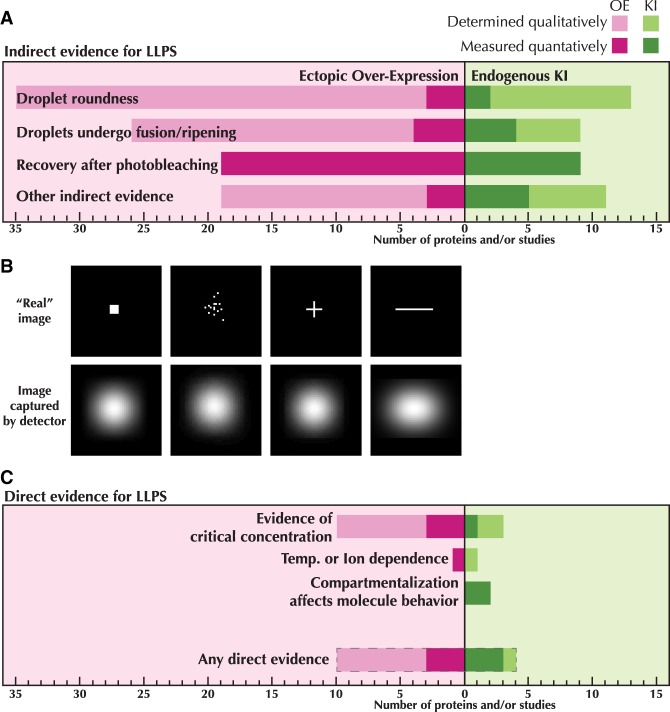
The idea that liquid–liquid phase separation (LLPS) may be a general mechanism by which molecules in the complex cellular milieu may self-organize has generated much excitement and fervor in the cell biology community. While this concept is not new, its rise to preeminence has resulted in renewed interest in the mechanisms that shape and drive diverse cellular self-assembly processes from gene expression to cell division to stress responses. In vitro biochemical data have been instrumental in deriving some of the fundamental principles and molecular grammar by which biological molecules may phase separate, and the molecular basis of these interactions. Definitive evidence is lacking as to whether the same principles apply in the physiological environment inside living cells. In this Perspective, we analyze the evidence supporting phase separation in vivo across multiple cellular processes. We find that the evidence for in vivo LLPS is often phenomenological and inadequate to discriminate between phase separation and other possible mechanisms. Moreover, the causal relationship and functional consequences of LLPS in vivo are even more elusive. We underscore the importance of performing quantitative measurements on proteins in their endogenous state and physiological abundance, as well as make recommendations for experiments that may yield more conclusive results.
Overview
The claims and statistics of this paper haven’t been checked yet.
Run the check — free, no account needed. It reads the open-access text and checks the sources it cites.
Integrity signals
Registry
Cites
Statistics
Figures
Verification
Claims the paper makes
The claims and statistics of this paper haven’t been checked yet.
Run the check — free, no account needed. It reads the open-access text and checks the sources it cites.
Claims other papers make about this one
Each is checked against this paper’s own text: does it say what the citing paper says it does?
In the citing paper
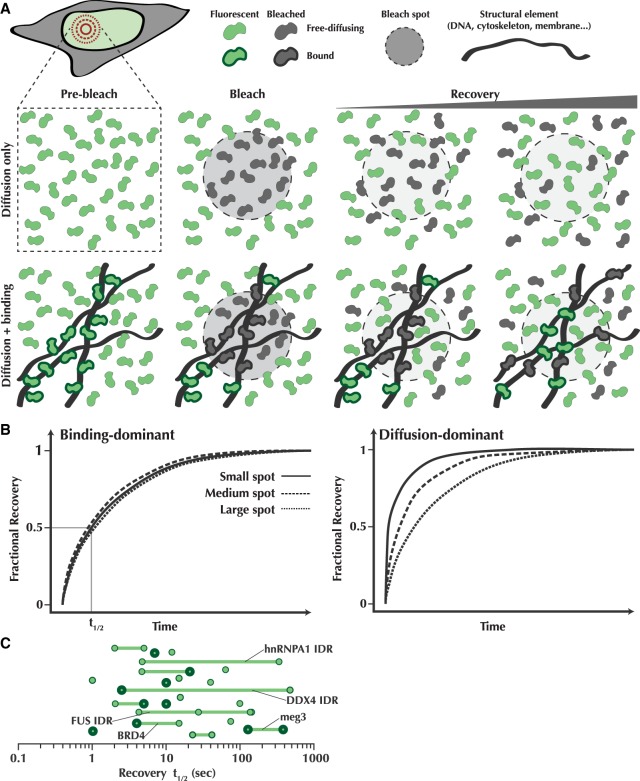
“FRAP of differently sized ROIs within Tau:RNA condensates showed that the time to half maximum fluorescence recovery, t1/2 , correlated with the ROI size (Fig EV4A), indicating that the recovery was dominated by molecular diffusion of Tau‐Dylight488 (McSwiggen et al, 2019).”
From Molecular crowding and RNA synergize to promote phase separation, microtubule interaction, and seeding of Tau condensates (2022) · cites this paper as McSwiggen et al, 2019
Self-check
Percentages, sums and reported differences re-computed from the paper’s own numbers.
The self-check needs the paper’s full text.
Citations
Cites
Coactivator condensation at super-enhancers links phase separation and gene control
Sabari, B. R., Dall’Agnese, A., Boija, A., Klein, I. A., Coffey, E. L., Shrinivas, K., Abraham, B. J., Hannett, N. M., Zamudio, A. V., Manteiga, J. C., et al. (2018) · Science · doi:10.1126/science.aar3958 · Cited by 2,595
Kato, M., Han, T. W., Xie, S., Shi, K., Du, X., Wu, L. C., Mirzaei, H., Goldsmith, E. J., Longgood, J., Pei, J., et al. (2012) · Cell · doi:10.1016/j.cell.2012.04.017 · Cited by 2,012
Mediator and RNA polymerase II clusters associate in transcription-dependent condensates
Cho, W.-K., Spille, J.-H., Hecht, M., Lee, C., Li, C., Grube, V., & Cisse, I. I. (2018) · Science · doi:10.1126/science.aar4199 · Cited by 1,403
Protein Phase Separation Provides Long-Term Memory of Transient Spatial Stimuli
Dine, E., Gil, A. A., Uribe, G., Brangwynne, C. P., & Toettcher, J. E. (2018) · Cell Systems · doi:10.1016/j.cels.2018.05.002 · Cited by 182
Experimental and computational framework for a dynamic protein atlas of human cell division
Cai, Y., Hossain, M. J., Hériché, J.-K., Politi, A. Z., Walther, N., Koch, B., Wachsmuth, M., Nijmeijer, B., Kueblbeck, M., Martinic-Kavur, M., et al. (2018) · Nature · doi:10.1038/s41586-018-0518-z · Cited by 121
Research works printed but not linked: 97
- 10.1016/j.cell.2018.12.035 · DOI · Paper page
- 10.1038/ncomms9088 · DOI · Paper page
- 10.1016/j.ymeth.2004.03.028 · DOI
- 10.1016/j.cell.2016.06.010 · DOI
- 10.1038/nrm.2017.7 · DOI
- 10.1016/j.cell.2016.05.026 · DOI
- 10.1073/pnas.1509317112 · DOI · Paper page
- 10.1038/s41594-018-0112-y · DOI
- 10.1016/j.tcb.2018.02.004 · DOI
- 10.1016/j.cell.2018.10.042 · DOI · Paper page
- 10.1016/j.molcel.2018.08.027 · DOI
- 10.1016/j.cell.2018.10.048 · DOI · Paper page
- 10.1083/jcb.201308087 · DOI
- 10.1126/science.1172046 · DOI
- 10.1073/pnas.1017150108 · DOI
- 10.1038/nphys3532 · DOI
- 10.1073/pnas.1103411108 · DOI
- 10.1126/science.aar2555 · DOI · Paper page
- 10.1126/science.1239053 · DOI
- 10.15252/embj.201593517 · DOI
- 10.1126/science.aat1022 · DOI
- 10.1073/pnas.1504822112 · DOI · Paper page
- 10.1242/jcs.206854 · DOI
- 10.1016/j.cell.2016.04.047 · DOI
- 10.1126/science.aao5654 · DOI
- 10.1016/j.cell.2017.08.008 · DOI
- 10.1073/pnas.122055299 · DOI
- 10.1038/s41586-019-1464-0 · DOI
- 10.7554/eLife.20010 · DOI
- 10.1021/js960019t · DOI
- 10.1016/j.cell.2017.02.007 · DOI · Paper page
- 10.1101/gad.295741.116 · DOI
- 10.1146/annurev-cellbio-100913-013325 · DOI · Paper page
- 10.1038/nature22386 · DOI
- Kroschwald S , Maharana S , Simon A . 2017. Hexanediol: a chemical probe to investigate the material properties of membrane-less compartments. Matters 1–7. doi:10.19185/matters.201702000010 · DOI
- 10.1016/j.cell.2013.10.033 · DOI
- 10.1038/nature22822 · DOI
- 10.1038/s41556-018-0148-6 · DOI
- 10.1038/nature10879 · DOI
- 10.7554/eLife.04236 · DOI
- 10.1063/1.470751 · DOI
- 10.1038/s41586-018-0174-3 · DOI
- 10.1126/science.aar7366 · DOI
- 10.1038/ncb2140 · DOI
- 10.1016/j.tig.2011.05.006 · DOI
- 10.1093/nar/gks701 · DOI
- 10.7554/eLife.47098 · DOI
- Mir M , Bhaduri B , Wang R , Zhu R , Popescu G . 2012. Quantitative phase imaging. Elsevier Inc., Amsterdam, Netherlands. · DOI
- 10.1101/gad.305078.117 · DOI · Paper page
- 10.7554/eLife.34110 · DOI
- 10.1242/dev.182766 · DOI
- 10.7554/eLife.13571 · DOI
- 10.1016/j.cell.2015.09.015 · DOI · Paper page
- 1898, Comparative cytological studies, with especial regard to the morphology of the nucleolus, J Morphol, 25, 266
- 10.1016/j.ceb.2010.03.002 · DOI
- 10.1038/s41594-019-0190-5 · DOI
- 10.7554/eLife.39695 · DOI
- 10.1083/jcb.201709007 · DOI
- 10.1038/nmeth.1401 · DOI · Paper page
- 10.1016/j.molcel.2015.01.013 · DOI · Paper page
- Oltsch F , Klosin A , Julicher F , Hyman AA , Zechner C . 2019. Phase separation provides a mechanism to reduce noise in cells. bioRxiv doi:10.1101/524231. · DOI
- 10.1002/jcp.1030490404 · DOI
- 10.1016/j.molcel.2016.05.042 · DOI
- 10.1016/j.cell.2015.07.047 · DOI · Paper page
- 10.1038/s41594-019-0193-2 · DOI
- 10.1126/science.aaw2644 · DOI
- 10.1016/j.cell.2017.02.027 · DOI
- 10.7554/eLife.20010 · DOI
- 10.1016/j.celrep.2016.06.088 · DOI
- 10.1038/ncb2157 · DOI · Paper page
- 10.1016/j.cell.2016.11.054 · DOI · Paper page
- 10.1016/j.cell.2018.10.057 · DOI · Paper page
- 10.1016/j.molcel.2019.07.009 · DOI
- 10.7554/eLife.12248 · DOI
- 10.1016/j.tcb.2004.12.001 · DOI
- 10.1529/biophysj.103.026765 · DOI · Paper page
- 10.1529/biophysj.105.073676 · DOI
- 10.1038/nature22989 · DOI
- 10.1038/nchem.1466 · DOI
- 10.1126/science.aad9964 · DOI
- 10.1016/S0042-6822(03)00107-7 · DOI
- Taylor NO , Wei MT , Stone HA , Brangwynne CP . 2019. Quantifying dynamics in phase-separated condensates using fluorescence recovery after photobleaching. Biophys J doi: 10.1016/j.bpj.2019.08.030. · DOI
- 10.7554/eLife.22280 · DOI
- 10.7554/eLife.35621 · DOI
- 10.1039/c0sm00215a · DOI
- 10.1021/la980126y · DOI
- 10.1083/jcb.201801048 · DOI
- 10.1364/OE.19.001016 · DOI
- 10.1016/j.cell.2018.06.006 · DOI
- 10.1016/j.cub.2015.01.012 · DOI
- 10.15252/embj.201798049 · DOI · Paper page
- 10.1038/nchem.2803 · DOI
- West JA , Mito M , Kurosaka S , Takumi T , Tanegashima C , Chujo T , Yanaka K , Kingston RE , Hirose T , Bond C , 2016. Structural, super-resolution microscopy analysis of paraspeckle nuclear body organization. J Cell Biol 214. · DOI
- 10.1126/science.10.237.33 · DOI
- 10.1016/j.cell.2017.05.028 · DOI
- 10.1101/678649 · DOI
- 10.1016/j.molcel.2015.09.017 · DOI
Cited by
Histone post-translational modifications - cause and consequence of genome function
Millán-Zambrano, G., Burton, A., Bannister, A. J., & Schneider, R. (2022) · Nature Reviews Genetics · doi:10.1038/s41576-022-00468-7 · Cited by 1,116
A framework for understanding the functions of biomolecular condensates across scales
Lyon, A. S., Peeples, W. B., & Rosen, M. K. (2021) · Nature Reviews Molecular Cell Biology · doi:10.1038/s41580-020-00303-z · Cited by 895
Reexamining assumptions about miRNA-guided gene silencing
Kilikevicius, A., Meister, G., & Corey, D. R. (2022) · Nucleic Acids Research · doi:10.1093/nar/gkab1256 · Cited by 194
Making the Case for Disordered Proteins and Biomolecular Condensates in Bacteria
Cohan, M. C., & Pappu, R. V. (2020) · Trends in Biochemical Sciences · doi:10.1016/j.tibs.2020.04.011 · Cited by 104
Hochmair, J., Exner, C., Franck, M., Dominguez‐Baquero, A., Diez, L., Brognaro, H., Kraushar, M. L., Mielke, T., Radbruch, H., Kaniyappan, S., et al. (2022) · The EMBO Journal · doi:10.15252/embj.2021108882 · Cited by 106
Metadata
- Authors
- McSwiggen, D. T., Mir, M., Darzacq, X., & Tjian, R.
- Venue
- Genes & Development
- Publisher
- Cold Spring Harbor Laboratory
- Published
- 2019-10-08
- Volume
- 33
- Issue
- 23-24
- Pages
- 1619-1634
- ISSN
- 0890-9369
- 1549-5477
- PMC
- PMC6942051
- Cited by
- 649
- References
- 5
- Language
- en
- Funders
- National Institutes of Health (UO1-EB021236, U54-DK107980)
- California Institute of Regenerative Medicine (LA1-08013)
- Howard Hughes Medical Institute (003061)
About these checks
Registry, retraction, Cites and statistics results are computed, not judged, with one exception: a printed reference that no index lists is read once by a model before it counts as a citation error. Claims are extracted by a model and kept only when their quote appears verbatim in the text; each cited source is then checked, with a model’s help, for whether it says what the claim relies on. Those verdicts can be wrong — read the claim’s quote and the cited source before relying on one.
Statistics and arithmetic are recomputed, not judged.
Confidence bands are shown only for fields calibrated on our annotated test set. None is calibrated yet, so no band is shown.
What counts as a claim ›How we measure confidence ›How we check this ›
Are you an author, or do you see a problem with this page? Request a review
Data sources
Bibliographic data: Semantic Scholar, OpenAlex, Crossref.
Contains information from the Semantic Scholar Academic Graph Datasets, made available under the ODC Attribution License (ODC-BY 1.0).
Semantic Scholar’s data is described in: Kinney, R., et al. (2023). The Semantic Scholar Open Data Platform. arXiv:2301.10140.
