

The DOI matches its Crossref record; 34 of the 34 references it cites were found in a registry or an index.
The senotherapeutic drug ABT-737 disrupts aberrant p21 expression to restore liver regeneration in adult mice
Open accessPublished version of a preprint
Abstract
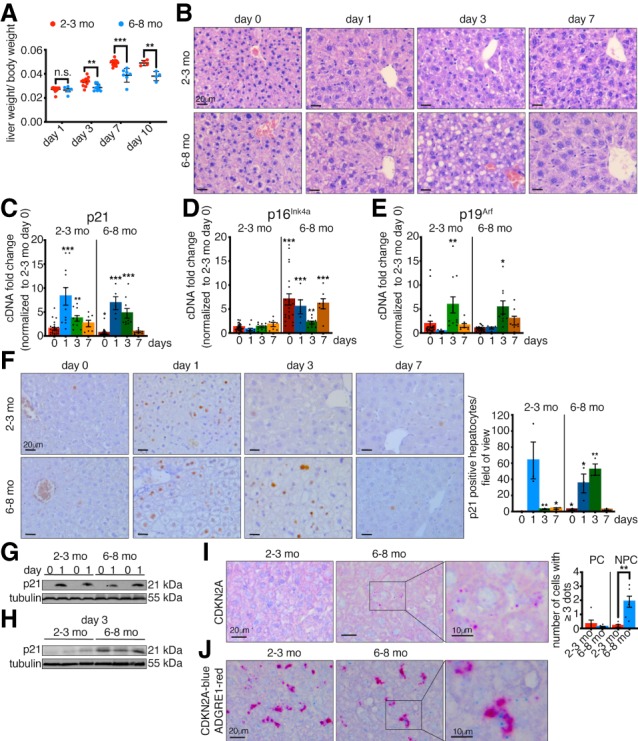
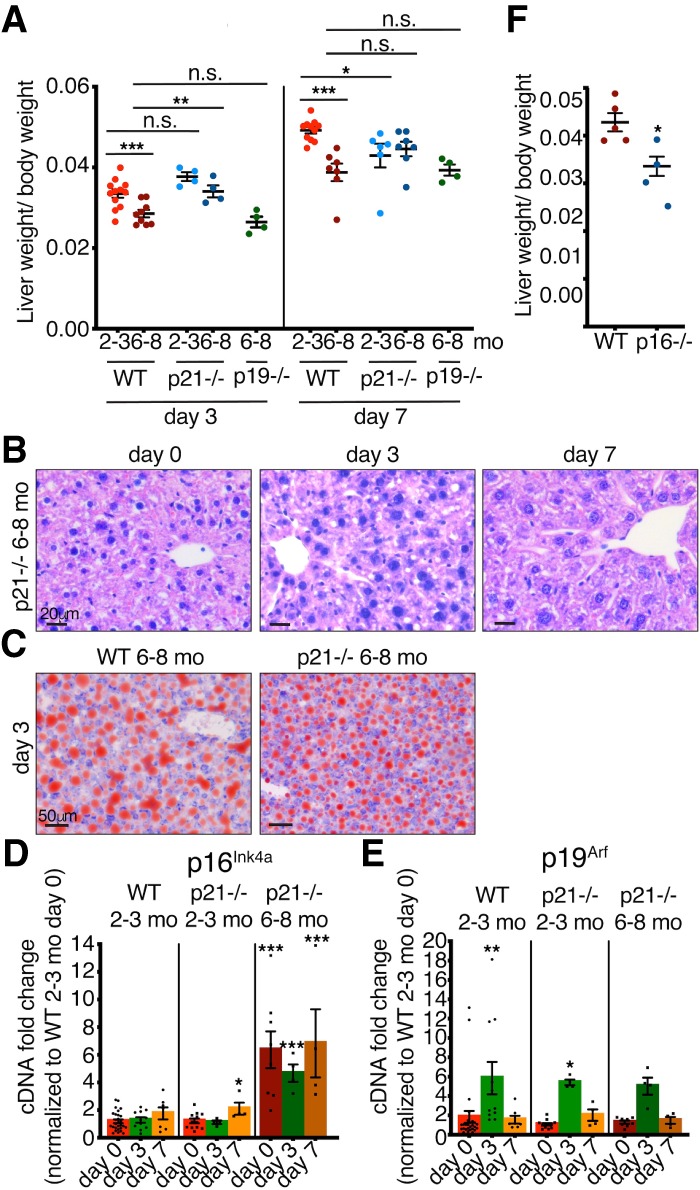
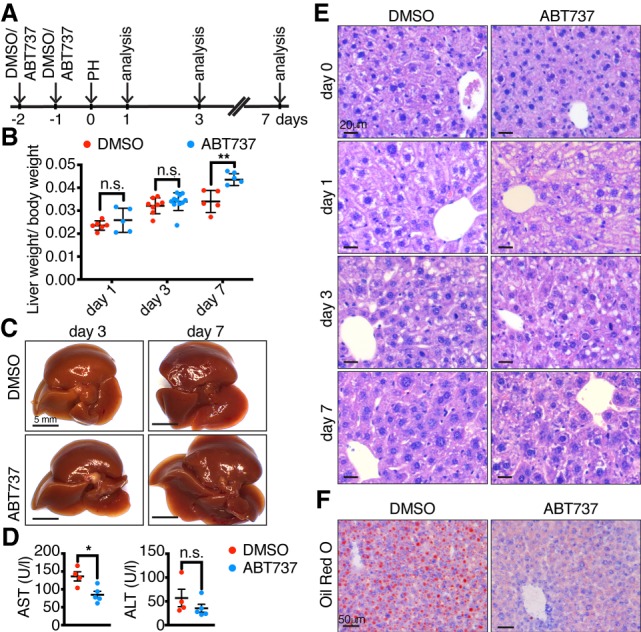
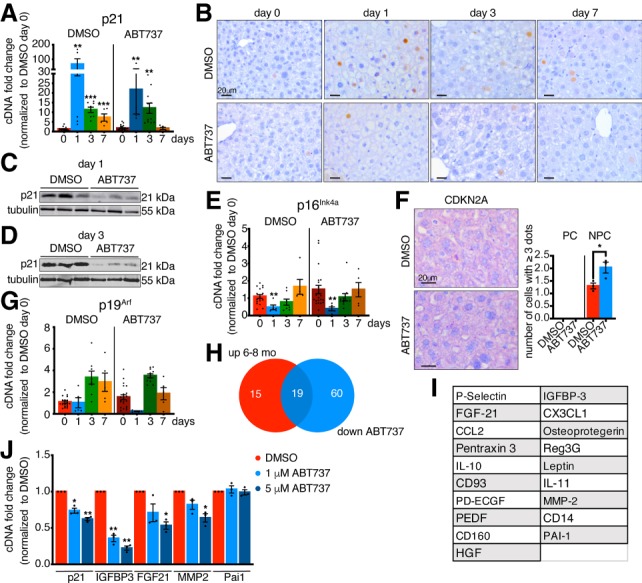
Young mammals possess a limited regenerative capacity in some tissues, which is lost upon maturation. We investigated whether cellular senescence might play a role in such loss during liver regeneration. We found that following partial hepatectomy, the senescence-associated genes p21, p16 Ink4a , and p19 Arf become dynamically expressed in different cell types when regenerative capacity decreases, but without a full senescent response. However, we show that treatment with a senescence-inhibiting drug improves regeneration, by disrupting aberrantly prolonged p21 expression. This work suggests that senescence may initially develop from heterogeneous cellular responses, and that senotherapeutic drugs might be useful in promoting organ regeneration.
Overview
The claims and statistics of this paper haven’t been checked yet.
Run the check — free, no account needed. It reads the open-access text and checks the sources it cites.
Integrity signals
Registry
Cites
Statistics
Figures
Verification
Claims the paper makes
The claims and statistics of this paper haven’t been checked yet.
Run the check — free, no account needed. It reads the open-access text and checks the sources it cites.
Claims other papers make about this one
Each is checked against this paper’s own text: does it say what the citing paper says it does?
The source backs part of the claim, not all of it — or backs it for a different population, condition or comparison.
In the citing paper
“Removal of senescent cells by ABT-737 in the liver also enhanced liver regeneration in adult mice without cancer 211 .”
From Senescence and cancer — role and therapeutic opportunities (2022) · cites this paper as [211]
Experimental — accuracy not yet measured
Self-check
Percentages, sums and reported differences re-computed from the paper’s own numbers.
The self-check needs the paper’s full text.
Citations
Cites
Naturally occurring p16Ink4a-positive cells shorten healthy lifespan
Baker, D. J., Childs, B. G., Durik, M., Wijers, M. E., Sieben, C. J., Zhong, J., A. Saltness, R., Jeganathan, K. B., Verzosa, G. C., Pezeshki, A., et al. (2016) · Nature · doi:10.1038/nature16932 · Cited by 2,876
Self-citationCellular senescence: from physiology to pathology
Muñoz-Espín, D., & Serrano, M. (2014) · Nature Reviews Molecular Cell Biology · doi:10.1038/nrm3823 · Cited by 2,818
Transient Regenerative Potential of the Neonatal Mouse Heart
Porrello, E. R., Mahmoud, A. I., Simpson, E., Hill, J. A., Richardson, J. A., Olson, E. N., & Sadek, H. A. (2011) · Science · doi:10.1126/science.1200708 · Cited by 2,545
Cellular senescence in aging and age-related disease: from mechanisms to therapy
Childs, B. G., Durik, M., Baker, D. J., & van Deursen, J. M. (2015) · Nature Medicine · doi:10.1038/nm.4000 · Cited by 2,363
Self-citationSenolytics improve physical function and increase lifespan in old age
Xu, M., Pirtskhalava, T., Farr, J. N., Weigand, B. M., Palmer, A. K., Weivoda, M. M., Inman, C. L., Ogrodnik, M. B., Hachfeld, C. M., Fraser, D. G., et al. (2018) · Nature Medicine · doi:10.1038/s41591-018-0092-9 · Cited by 2,287
Senescence of Activated Stellate Cells Limits Liver Fibrosis
Krizhanovsky, V., Yon, M., Dickins, R. A., Hearn, S., Simon, J., Miething, C., Yee, H., Zender, L., & Lowe, S. W. (2008) · Cell · doi:10.1016/j.cell.2008.09.015 · Cited by 2,027
Clearance of senescent cells by ABT263 rejuvenates aged hematopoietic stem cells in mice
Chang, J., Wang, Y., Shao, L., Laberge, R.-M., Demaria, M., Campisi, J., Janakiraman, K., Sharpless, N. E., Ding, S., Feng, W., et al. (2016) · Nature Medicine · doi:10.1038/nm.4010 · Cited by 1,819
Baar, M. P., Brandt, R. M. C., Putavet, D. A., Klein, J. D. D., Derks, K. W. J., Bourgeois, B. R. M., Stryeck, S., Rijksen, Y., van Willigenburg, H., Feijtel, D. A., et al. (2017) · Cell · doi:10.1016/j.cell.2017.02.031 · Cited by 1,454
Michalopoulos, G. K. (2007) · Journal of Cellular Physiology · doi:10.1002/jcp.21172 · Cited by 1,384
Clearance of senescent glial cells prevents tau-dependent pathology and cognitive decline
Bussian, T. J., Aziz, A., Meyer, C. F., Swenson, B. L., van Deursen, J. M., & Baker, D. J. (2018) · Nature · doi:10.1038/s41586-018-0543-y · Cited by 1,289
Senescent cells: an emerging target for diseases of ageing
Childs, B. G., Gluscevic, M., Baker, D. J., Laberge, R.-M., Marquess, D., Dananberg, J., & van Deursen, J. M. (2017) · Nature Reviews Drug Discovery · doi:10.1038/nrd.2017.116 · Cited by 1,284
Cellular senescence drives age-dependent hepatic steatosis
Ogrodnik, M., Miwa, S., Tchkonia, T., Tiniakos, D., Wilson, C. L., Lahat, A., Day, C. P., Burt, A., Palmer, A., Anstee, Q. M., et al. (2017) · Nature Communications · doi:10.1038/ncomms15691 · Cited by 1,044
Directed elimination of senescent cells by inhibition of BCL-W and BCL-XL
Yosef, R., Pilpel, N., Tokarsky-Amiel, R., Biran, A., Ovadya, Y., Cohen, S., Vadai, E., Dassa, L., Shahar, E., Condiotti, R., et al. (2016) · Nature Communications · doi:10.1038/ncomms11190 · Cited by 1,032
Inflammasome inhibition prevents α-synuclein pathology and dopaminergic neurodegeneration in mice
Gordon, R., Albornoz, E. A., Christie, D. C., Langley, M. R., Kumar, V., Mantovani, S., Robertson, A. A. B., Butler, M. S., Rowe, D. B., O’Neill, L. A., et al. (2018) · Science Translational Medicine · doi:10.1126/scitranslmed.aah4066 · Cited by 897
The extracellular matrix protein agrin promotes heart regeneration in mice
Bassat, E., Mutlak, Y. E., Genzelinakh, A., Shadrin, I. Y., Umansky, K. B., Yifa, O., Kain, D., Rajchman, D., Leach, J. P., Riabov-Bassat, D., et al. (2017) · Nature · doi:10.1038/nature22978 · Cited by 649
Tau protein aggregation is associated with cellular senescence in the brain
Musi, N., Valentine, J. M., Sickora, K. R., Baeuerle, E., Thompson, C. S., Shen, Q., & Orr, M. E. (2018) · Aging Cell · doi:10.1111/acel.12840 · Cited by 595
Impaired immune surveillance accelerates accumulation of senescent cells and aging
Ovadya, Y., Landsberger, T., Leins, H., Vadai, E., Gal, H., Biran, A., Yosef, R., Sagiv, A., Agrawal, A., Shapira, A., et al. (2018) · Nature Communications · doi:10.1038/s41467-018-07825-3 · Cited by 578
A reproducible and well-tolerated method for 2/3 partial hepatectomy in mice
Mitchell, C., & Willenbring, H. (2008) · Nature Protocols · doi:10.1038/nprot.2008.80 · Cited by 577
Cholangiocytes act as facultative liver stem cells during impaired hepatocyte regeneration
Raven, A., Lu, W.-Y., Man, T. Y., Ferreira-Gonzalez, S., O’Duibhir, E., Dwyer, B. J., Thomson, J. P., Meehan, R. R., Bogorad, R., Koteliansky, V., et al. (2017) · Nature · doi:10.1038/nature23015 · Cited by 533
Hepatic progenitor cells of biliary origin with liver repopulation capacity
Lu, W.-Y., Bird, T. G., Boulter, L., Tsuchiya, A., Cole, A. M., Hay, T., Guest, R. V., Wojtacha, D., Man, T. Y., Mackinnon, A., et al. (2015) · Nature Cell Biology · doi:10.1038/ncb3203 · Cited by 479
Cells exhibiting strong p16 INK4a promoter activation in vivo display features of senescence
Liu, J.-Y., Souroullas, G. P., Diekman, B. O., Krishnamurthy, J., Hall, B. M., Sorrentino, J. A., Parker, J. S., Sessions, G. A., Gudkov, A. V., & Sharpless, N. E. (2019) · Proceedings of the National Academy of Sciences · doi:10.1073/pnas.1818313116 · Cited by 306
Bird, T. G., Müller, M., Boulter, L., Vincent, D. F., Ridgway, R. A., Lopez-Guadamillas, E., Lu, W.-Y., Jamieson, T., Govaere, O., Campbell, A. D., et al. (2018) · Science Translational Medicine · doi:10.1126/scitranslmed.aan1230 · Cited by 261
c-Jun/AP-1 controls liver regeneration by repressing p53/p21 and p38 MAPK activity
Stepniak, E., Ricci, R., Eferl, R., Sumara, G., Sumara, I., Rath, M., Hui, L., & Wagner, E. F. (2006) · Genes & Development · doi:10.1101/gad.390506 · Cited by 232
Gene expression during the priming phase of liver regeneration after partial hepatectomy in mice
Su, A. I., Guidotti, L. G., Pezacki, J. P., Chisari, F. V., & Schultz, P. G. (2002) · Proceedings of the National Academy of Sciences · doi:10.1073/pnas.122359899 · Cited by 212
Development and regeneration of the neonatal digit tip in mice
Han, M., Yang, X., Lee, J., Allan, C. H., & Muneoka, K. (2007) · Developmental Biology · doi:10.1016/j.ydbio.2007.12.025 · Cited by 210
Lehmann, K., Tschuor, C., Rickenbacher, A., Jang, J., Oberkofler, C. E., Tschopp, O., Schultze, S. M., Raptis, D. A., Weber, A., Graf, R., et al. (2012) · Gastroenterology · doi:10.1053/j.gastro.2012.08.043 · Cited by 137
Loforese, G., Malinka, T., Keogh, A., Baier, F. A., Simillion, C., Montani, M., Halazonetis, T. D., Candinas, D., & Stroka, D. (2016) · EMBO Molecular Medicine · doi:10.15252/emmm.201506089 · Cited by 126
Albrecht, J. H., Meyer, A., & Hu, M. Y. (1997) · Hepatology · doi:10.1002/hep.510250311 · Cited by 113
Reversal of Hepatocyte Senescence After Continuous In Vivo Cell Proliferation
Wang, M., Chen, F., Li, J., Liu, C.-C., Zhang, H., Xia, Y., Yu, B., You, P., Xiang, D., Lu, L., et al. (2014) · Hepatology · doi:10.1002/hep.27094 · Cited by 109
Buitrago‐Molina, L. E., Marhenke, S., Longerich, T., Sharma, A. D., Boukouris, A. E., Geffers, R., Guigas, B., Manns, M. P., & Vogel, A. (2013) · Hepatology · doi:10.1002/hep.26412 · Cited by 92
Dysfunction of liver regeneration in aged liver after partial hepatectomy
Enkhbold, C., Morine, Y., Utsunomiya, T., Imura, S., Ikemoto, T., Arakawa, Y., Saito, Y., Yamada, S., Ishikawa, D., & Shimada, M. (2015) · Journal of Gastroenterology and Hepatology · doi:10.1111/jgh.12930 · Cited by 66
Zou, Y., Bao, Q., Kumar, S., Hu, M., Wang, G., & Dai, G. (2012) · PLoS ONE · doi:10.1371/journal.pone.0030675 · Cited by 64
Modeling Dynamics and Function of Bone Marrow Cells in Mouse Liver Regeneration
Pedone, E., Olteanu, V.-A., Marucci, L., Muñoz-Martin, M. I., Youssef, S. A., de Bruin, A., & Cosma, M. P. (2017) · Cell Reports · doi:10.1016/j.celrep.2016.12.008 · Cited by 32
Self-citationAn integrative framework for salamander and mouse limb regeneration
Payzin‐Dogru, D., & Whited, J. L. (2018) · The International Journal of Developmental Biology · doi:10.1387/ijdb.180002jw · Cited by 27
Research works printed but not linked: 1
- 10.1016/j.cell.2008.06.049 · DOI · Paper page
Cited by
Sorted by citations
Senescence and cancer — role and therapeutic opportunities
Schmitt, C. A., Wang, B., & Demaria, M. (2022) · Nature Reviews Clinical Oncology · doi:10.1038/s41571-022-00668-4 · Cited by 794
A Senescence-Centric View of Aging: Implications for Longevity and Disease
Borghesan, M., Hoogaars, W. M. H., Varela-Eirin, M., Talma, N., & Demaria, M. (2020) · Trends in Cell Biology · doi:10.1016/j.tcb.2020.07.002 · Cited by 267
Skeletal Aging and Osteoporosis: Mechanisms and Therapeutics
Chandra, A., & Rajawat, J. (2021) · International Journal of Molecular Sciences · doi:10.3390/ijms22073553 · Cited by 281
Clearance of senescent macrophages ameliorates tumorigenesis in KRAS-driven lung cancer
Haston, S., Gonzalez-Gualda, E., Morsli, S., Ge, J., Reen, V., Calderwood, A., Moutsopoulos, I., Panousopoulos, L., Deletic, P., Carreno, G., et al. (2023) · Cancer Cell · doi:10.1016/j.ccell.2023.05.004 · Cited by 251
Hepatic stellate cell senescence in liver fibrosis: Characteristics, mechanisms and perspectives
Zhang, M., Salas, S. S., Damba, T., Borghesan, M., Demaria, M., & Moshage, H. J. (2021) · Mechanisms of Ageing and Development · doi:10.1016/j.mad.2021.111572 · Cited by 192
Metadata
- Authors
- Ritschka, B., Knauer-Meyer, T., Gonçalves, D. S., Mas, A., Plassat, J.-L., Durik, M., Jacobs, H., Pedone, E., Di Vicino, U., Cosma, M. P., & Keyes, W. M.
- Affiliations
- Centre National de la Recherche Scientifique (FR)
- Barcelona Institute of Science and Technology (ES)
- Institució Catalana de Recerca i Estudis Avançats (ES)
- ORCID
- Venue
- Genes & Development
- Publisher
- Cold Spring Harbor Laboratory
- Published
- 2020-03-05
- Volume
- 34
- Issue
- 7-8
- Pages
- 489-494
- ISSN
- 0890-9369 (ISSN-L)
- 1549-5477
- PMC
- PMC7111259
- OpenAlex
- W3009846583
- Cited by
- 105
- References
- 34
- Citations by year
- 2026: 10 · 2025: 17 · 2024: 18 · 2023: 20 · 2022: 14 · 2021: 17 · 2020: 9
- Type
- posted content
- Language
- en
- Open access
- hybrid
- doi.org
- Licence
- cc-by-nc
- Locations
- Genes & Development (publishedVersion, cc-by-nc)
- PubMed (publishedVersion)
- HAL (submittedVersion)
- HAL (submittedVersion, cc-by-nc)
- HighWire Press Open Archive (submittedVersion)
- Repositori digital de la UPF (Universitat Pompeu Fabra) (submittedVersion, cc-by-nc)
- Funders
- Spanish Ministry for Economy and Competitiveness (SAF2013-49082-P)
- La Fondation Recherche Medicale (AJE20160635985)
- Fondation ARC (PJA20181208104)
- IDEX Attractivité-University of Strasbourg (IDEX2017)
- La Fondation Schlumberger pour l'Education et la Recherche (FSER 19-Year 2018)
- ANR (ANR-19-CE13-0023-03, ANR-10-LABX-0030-INRT)
- Agence Nationale de la Recherche (ANR-10-IDEX-0002-02)
- Topics
- Health Sciences › Medicine › Hepatology › Liver physiology and pathology
- Life Sciences › Biochemistry, Genetics and Molecular Biology › Cell Biology › Telomeres, Telomerase, and Senescence
- Life Sciences › Biochemistry, Genetics and Molecular Biology › Aging › Genetics, Aging, and Longevity in Model Organisms
- Keywords
- cellular senescence, ABT-737, p21, liver regeneration, partial hepatectomy, p16INK4a, p19ARF, senescence-associated gene expression
- MeSH terms
- Animals, Biphenyl Compounds, Cells, Cultured, Female, Gene Expression Regulation, Liver, Male, Mice, Inbred C57BL, Nitrophenols, Piperazines, Regeneration, Sulfonamides, Cellular Senescence, Cyclin-Dependent Kinase Inhibitor p16, Models, Animal, Cyclin-Dependent Kinase Inhibitor p21, Mice
About these checks
Registry, retraction, Cites and statistics results are computed, not judged, with one exception: a printed reference that no index lists is read once by a model before it counts as a citation error. Claims are extracted by a model and kept only when their quote appears verbatim in the text; each cited source is then checked, with a model’s help, for whether it says what the claim relies on. Those verdicts can be wrong — read the claim’s quote and the cited source before relying on one.
Statistics and arithmetic are recomputed, not judged.
Confidence bands are shown only for fields calibrated on our annotated test set. None is calibrated yet, so no band is shown.
What counts as a claim ›How we measure confidence ›How we check this ›
Are you an author, or do you see a problem with this page? Request a review
