PreprintCited by 114Genomics and Chromatin DynamicsChromatin Remodeling and CancerEpigenetics and DNA Methylation

The DOI matches its Crossref record; 62 of the 63 references it cites were found in a registry or an index.

The genomic landscape of cohesin-associated chromatin interactions

Open access

Abstract

Cohesin is implicated in establishing tissue-specific DNA loops that target enhancers to promoters, and also localizes to sites bound by the insulator protein CTCF, which blocks enhancer-promoter communication. However, cohesin-associated interactions have not been characterized on a genome-wide scale. Here we performed chromatin interaction analysis with paired-end tag sequencing (ChIA-PET) of the cohesin subunit SMC1A in developing mouse limb. We identified 2264 SMC1A interactions, of which 1491 (65%) involved sites co-occupied by CTCF. SMC1A participates in tissue-specific enhancer-promoter interactions and interactions that demarcate regions of correlated regulatory output. In contrast to previous studies, we also identified interactions between promoters and distal sites that are maintained in multiple tissues but are poised in embryonic stem cells and resolve to tissue-specific activated or repressed chromatin states in the mouse embryo. Our results reveal the diversity of cohesin-associated interactions in the genome and highlight their role in establishing the regulatory architecture of development.

Overview

The claims and statistics of this paper haven’t been checked yet.

Run the check — free, no account needed. It reads the open-access text and checks the sources it cites.

A few free checks a day · papers already verified open instantly · results are public

Integrity signals

Registry

Crossref · 10.1101/gr.156570.113

Cites

62 of 62 references verified0 citation errors · 0 not checkable

Statistics

Figures

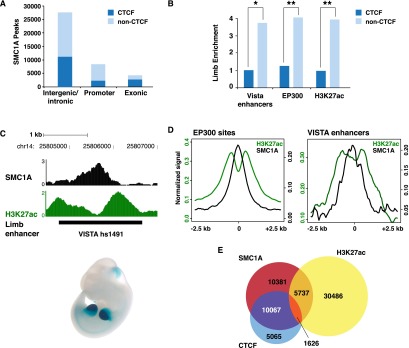
Figure 1. Cohesin binding in embryonic E11.5 limb bud. (A) Classification of SMC1A ChIP-seq peaks, partitioned by CTCF co-occupancy. (B) Intergenic and intronic SMC1A sites lacking CTCF (light blue bars) are enriched for limb enhancers in the VISTA Enhancer Browser (Visel et al. 2007) ([*] Fisher exact test P-value = 0.001) and putative enhancer marks, including the coactivator EP300 (Visel et al. 2009) and E11.5 limb-specific H3K27ac marking (Cotney et al. 2012) ([**] Fisher exact test P-value < 2 × 10⁻¹⁶), compared to sites co-occupied by CTCF (dark blue bars). (C) SMC1A and H3K27ac ChIP-seq signal profiles at a known limb enhancer, VISTA hs1491 (Visel et al. 2007). (D) SMC1A (black) and H3K27ac (green) normalized ChIP-seq signal aggregated at intergenic or intronic limb EP300 sites (left; n = 3613) (Visel et al. 2009) and known VISTA limb enhancers (right; n = 165) (Visel et al. 2007). (E) Overlap of intergenic and intronic sites occupied by SMC1A, CTCF, and H3K27ac.
Figure 1. Cohesin binding in embryonic E11.5 limb bud. (A) Classification of SMC1A ChIP-seq peaks, partitioned by CTCF co-occupancy. (B) Intergenic and intronic SMC1A sites lacking CTCF (light blue bars) are enriched for limb enhancers in the VISTA Enhancer Browser (Visel et al. 2007) ([*] Fisher exact test P-value = 0.001) and putative enhancer marks, including the coactivator EP300 (Visel et al. 2009) and E11.5 limb-specific H3K27ac marking (Cotney et al. 2012) ([**] Fisher exact test P-value < 2 × 10⁻¹⁶), compared to sites co-occupied by CTCF (dark blue bars). (C) SMC1A and H3K27ac ChIP-seq signal profiles at a known limb enhancer, VISTA hs1491 (Visel et al. 2007). (D) SMC1A (black) and H3K27ac (green) normalized ChIP-seq signal aggregated at intergenic or intronic limb EP300 sites (left; n = 3613) (Visel et al. 2009) and known VISTA limb enhancers (right; n = 165) (Visel et al. 2007). (E) Overlap of intergenic and intronic sites occupied by SMC1A, CTCF, and H3K27ac.CC BY-NC · PubMed Central
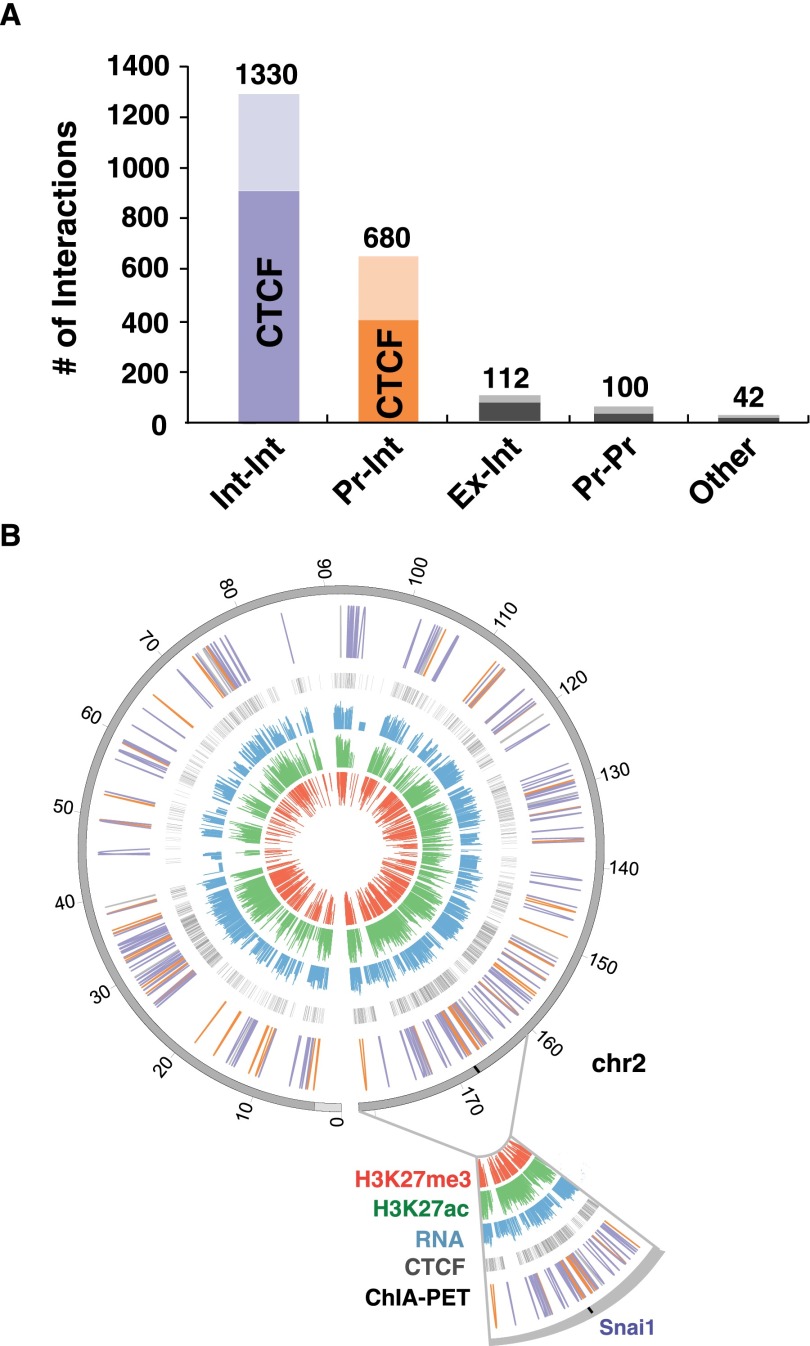
Figure 2. Cohesin interactions in the genome. (A) Classification of SMC1A ChIA-PET interactions, partitioned by CTCF co-occupancy. (Int) Intergenic or intronic sites; (Pr) promoter; (Ex) exonic. (B) Circos map of ChIA-PET interactions on chromosome 2. The outermost to innermost tracks are chromosome 2 (dark gray; centromere location indicated in light gray), ChIA-PET interactions (Int–Int interactions shown in blue, Pr–Int interactions in orange, and all others in gray), CTCF peaks (gray), z-scores of log2 transformed RPKM values of RNA-seq (blue), H3K27ac (green), and H3K27me3 (red). An expanded view of a 20-Mb region on chromosome 2 is shown with the location of the Snai1 locus (Fig. 3A).
Figure 2. Cohesin interactions in the genome. (A) Classification of SMC1A ChIA-PET interactions, partitioned by CTCF co-occupancy. (Int) Intergenic or intronic sites; (Pr) promoter; (Ex) exonic. (B) Circos map of ChIA-PET interactions on chromosome 2. The outermost to innermost tracks are chromosome 2 (dark gray; centromere location indicated in light gray), ChIA-PET interactions (Int–Int interactions shown in blue, Pr–Int interactions in orange, and all others in gray), CTCF peaks (gray), z-scores of log2 transformed RPKM values of RNA-seq (blue), H3K27ac (green), and H3K27me3 (red). An expanded view of a 20-Mb region on chromosome 2 is shown with the location of the Snai1 locus (Fig. 3A).CC BY-NC · PubMed Central
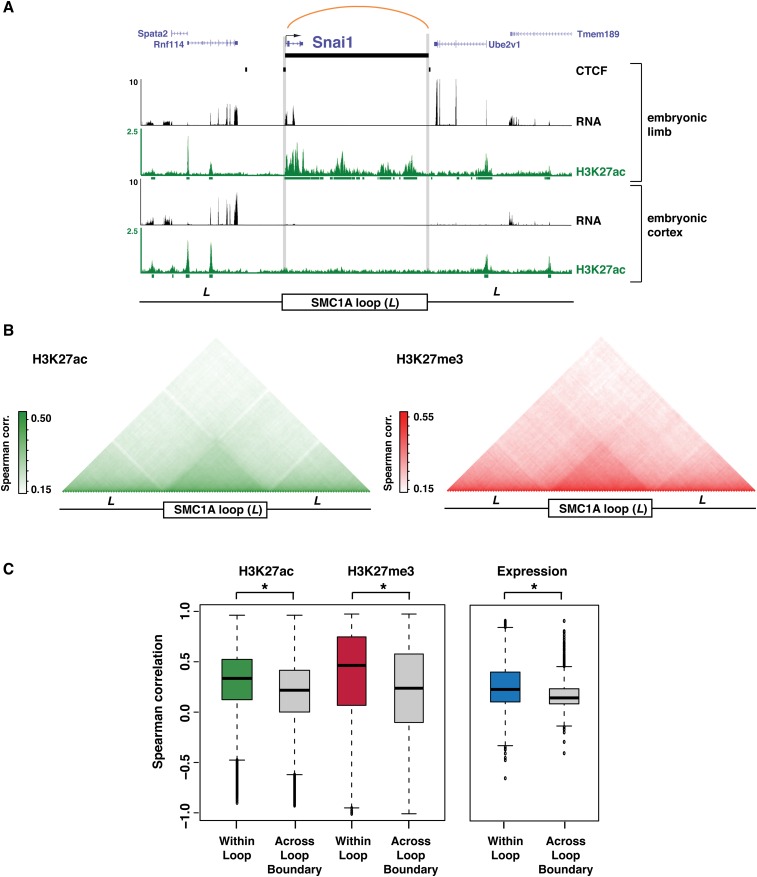
Figure 3. Cohesin interactions partition chromatin states and gene expression levels. (A) SMC1A ChIA-PET interaction at the Snai1 locus in E11.5 limb, with associated H3K27ac ChIP-seq and RNA-seq profiles in limb and E14.5 cortex (Ayoub et al. 2011). The upstream and downstream flanking regions are also shown (+/− one loop distance, L). (B, left) Mean pairwise Spearman correlations of H3K27ac signal across 19 cell types (Shen et al. 2012) using sites binned across all SMC1A interactions, spanning from one loop distance upstream (L) to one loop distance downstream (L). (Right) Mean pairwise Spearman correlations of H3K27me3 signal across six cell types (The ENCODE Project Consortium 2011) across all SMC1A interactions. (C, left) Distribution of pairwise Spearman correlations of H3K27ac and H3K27me3 signal within SMC1A interactions (within loop) or other pairings in the 3L interval (across loop boundary) ([*] Wilcoxon P-value < 2 × 10⁻¹⁶). (Right) Distribution of pairwise Spearman correlations of gene expression for SMC1A interactions containing two or more genes (within loop) compared to other pairings in the 3L interval (across loop boundary) ([*] Wilcoxon P-value < 2 × 10⁻¹⁶).
Figure 3. Cohesin interactions partition chromatin states and gene expression levels. (A) SMC1A ChIA-PET interaction at the Snai1 locus in E11.5 limb, with associated H3K27ac ChIP-seq and RNA-seq profiles in limb and E14.5 cortex (Ayoub et al. 2011). The upstream and downstream flanking regions are also shown (+/− one loop distance, L). (B, left) Mean pairwise Spearman correlations of H3K27ac signal across 19 cell types (Shen et al. 2012) using sites binned across all SMC1A interactions, spanning from one loop distance upstream (L) to one loop distance downstream (L). (Right) Mean pairwise Spearman correlations of H3K27me3 signal across six cell types (The ENCODE Project Consortium 2011) across all SMC1A interactions. (C, left) Distribution of pairwise Spearman correlations of H3K27ac and H3K27me3 signal within SMC1A interactions (within loop) or other pairings in the 3L interval (across loop boundary) ([*] Wilcoxon P-value < 2 × 10⁻¹⁶). (Right) Distribution of pairwise Spearman correlations of gene expression for SMC1A interactions containing two or more genes (within loop) compared to other pairings in the 3L interval (across loop boundary) ([*] Wilcoxon P-value < 2 × 10⁻¹⁶).CC BY-NC · PubMed Central
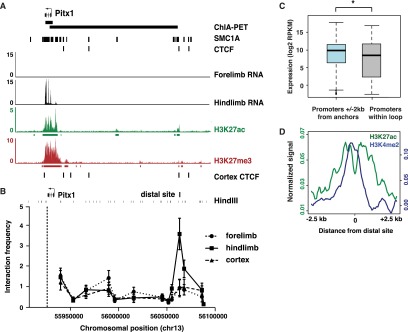
Figure 4. Cohesin participates in enhancer-promoter interactions. (A) SMC1A ChIA-PET interaction between Pitx1 and a distal site 133 kb upstream, bound by CTCF and SMC1A. Although E11.5 forelimb and hindlimb tissue were combined for ChIP, it has previously been shown that both Pitx1 and the distal site are marked only by H3K27ac in hindlimb and only by H3K27me3 in forelimb (Cotney et al. 2012). CTCF binding sites in E14.5 cortex are also shown (Shen et al. 2012). (B) 3C analysis of interactions at the Pitx1 locus in E11.5 forelimb, E11.5 hindlimb, and E14.5 cortex, using an anchor primer located in the gene (dashed line) and primers tiled across the locus. Interactions are normalized to a crosslinking control at Ercc3. Each data point represents average interaction frequency and error bars represent standard error from three independent qPCR reactions (see Supplemental Fig. S4A for biological replicate). (C) Promoters within 2 kb of an interaction anchor that loop to a distal site show significantly higher expression than promoters contained within the loop ([*] Wilcoxon P-value < 2 × 10⁻¹⁶). (D) E11.5 limb H3K27ac (green) and H3K4me2 (blue) normalized ChIP-seq signal aggregated at all distal sites looping to a promoter.
Figure 4. Cohesin participates in enhancer-promoter interactions. (A) SMC1A ChIA-PET interaction between Pitx1 and a distal site 133 kb upstream, bound by CTCF and SMC1A. Although E11.5 forelimb and hindlimb tissue were combined for ChIP, it has previously been shown that both Pitx1 and the distal site are marked only by H3K27ac in hindlimb and only by H3K27me3 in forelimb (Cotney et al. 2012). CTCF binding sites in E14.5 cortex are also shown (Shen et al. 2012). (B) 3C analysis of interactions at the Pitx1 locus in E11.5 forelimb, E11.5 hindlimb, and E14.5 cortex, using an anchor primer located in the gene (dashed line) and primers tiled across the locus. Interactions are normalized to a crosslinking control at Ercc3. Each data point represents average interaction frequency and error bars represent standard error from three independent qPCR reactions (see Supplemental Fig. S4A for biological replicate). (C) Promoters within 2 kb of an interaction anchor that loop to a distal site show significantly higher expression than promoters contained within the loop ([*] Wilcoxon P-value < 2 × 10⁻¹⁶). (D) E11.5 limb H3K27ac (green) and H3K4me2 (blue) normalized ChIP-seq signal aggregated at all distal sites looping to a promoter.CC BY-NC · PubMed Central
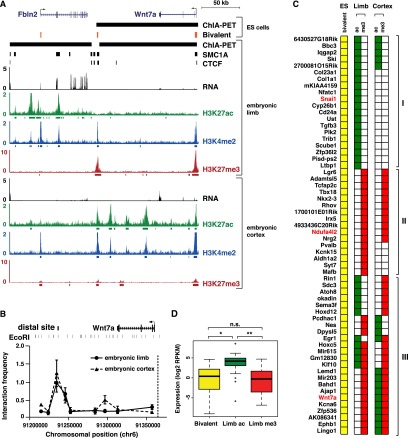
Figure 5. Tissue-dependent activation or repression of poised cohesin interactions. (A) SMC1A/CTCF interaction at Wnt7a in ES cells (Handoko et al. 2011) and limb. Bivalent sites (H3K4me3 and H3K27me3) in ES cells are shown in orange (Mikkelsen et al. 2007). RNA-seq and H3K27ac in E11.5 limb and E14.5 cortex, and H3K27me3 in E11.5 limb and E11.5 cortex are shown (E14.5 cortex RNA obtained from Ayoub et al. (2011). (B) 3C analysis of E11.5 limb and E14.5 cortex interactions between the Wnt7a promoter (dashed line) and distal sites across the locus, normalized to a crosslinking control at Ercc3. Each data point represents average interaction frequency and error bars represent standard error from three independent qPCR reactions (see Supplemental Fig. S5B for biological replicate). (C) Diagram of a subset of bivalent ES cell promoters involved in SMC1A or CTCF ChIA-PET interactions (Handoko et al. 2011). Only interactions with concordant chromatin states at both the promoter and distal site were considered. (I) Interactions resolving to active H3K27ac in limb; (II) interactions resolving to repressive H3K27me3 in limb; (III) interactions resolving to opposite chromatin states in limb and cortex. Gene names in red are involved in interactions detected in both ES cells (Handoko et al. 2011) and limb. The full diagram can be found in Supplemental Figure S5. (D) Gene expression of promoters involved in poised, activated, or repressed interactions. Promoters of H3K27ac marked limb interactions show significantly higher expression than bivalently marked promoters in ES cells ([*] Wilcoxon P-value = 1.6 × 10⁻¹¹) (Shen et al. 2012) and promoters in H3K27me3 marked interactions ([**] Wilcoxon P-value = 6.1 × 10⁻¹⁰).
Figure 5. Tissue-dependent activation or repression of poised cohesin interactions. (A) SMC1A/CTCF interaction at Wnt7a in ES cells (Handoko et al. 2011) and limb. Bivalent sites (H3K4me3 and H3K27me3) in ES cells are shown in orange (Mikkelsen et al. 2007). RNA-seq and H3K27ac in E11.5 limb and E14.5 cortex, and H3K27me3 in E11.5 limb and E11.5 cortex are shown (E14.5 cortex RNA obtained from Ayoub et al. (2011). (B) 3C analysis of E11.5 limb and E14.5 cortex interactions between the Wnt7a promoter (dashed line) and distal sites across the locus, normalized to a crosslinking control at Ercc3. Each data point represents average interaction frequency and error bars represent standard error from three independent qPCR reactions (see Supplemental Fig. S5B for biological replicate). (C) Diagram of a subset of bivalent ES cell promoters involved in SMC1A or CTCF ChIA-PET interactions (Handoko et al. 2011). Only interactions with concordant chromatin states at both the promoter and distal site were considered. (I) Interactions resolving to active H3K27ac in limb; (II) interactions resolving to repressive H3K27me3 in limb; (III) interactions resolving to opposite chromatin states in limb and cortex. Gene names in red are involved in interactions detected in both ES cells (Handoko et al. 2011) and limb. The full diagram can be found in Supplemental Figure S5. (D) Gene expression of promoters involved in poised, activated, or repressed interactions. Promoters of H3K27ac marked limb interactions show significantly higher expression than bivalently marked promoters in ES cells ([*] Wilcoxon P-value = 1.6 × 10⁻¹¹) (Shen et al. 2012) and promoters in H3K27me3 marked interactions ([**] Wilcoxon P-value = 6.1 × 10⁻¹⁰).CC BY-NC · PubMed Central
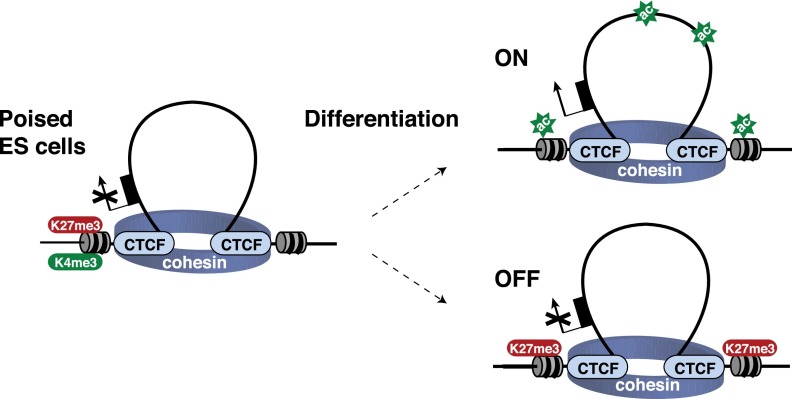
Figure 6. Distal regulatory sites can act as both enhancers and repressors in a tissue-dependent context. A model of tissue-specific gene regulation obtained via stable chromatin interactions. Bivalent promoters in embryonic stem cells are held in a poised, looped conformation with a distal site. Upon differentiation, the distal site is either activated by tissue-specific regulatory factors, leading to deposition H3K27ac and gene transcription, or repressed by recruitment of PRC2, as indicated by H3K27me3 marking.
Figure 6. Distal regulatory sites can act as both enhancers and repressors in a tissue-dependent context. A model of tissue-specific gene regulation obtained via stable chromatin interactions. Bivalent promoters in embryonic stem cells are held in a poised, looped conformation with a distal site. Upon differentiation, the distal site is either activated by tissue-specific regulatory factors, leading to deposition H3K27ac and gene transcription, or repressed by recruitment of PRC2, as indicated by H3K27me3 marking.CC BY-NC · PubMed Central

Verification

Claims the paper makes

The claims and statistics of this paper haven’t been checked yet.

Run the check — free, no account needed. It reads the open-access text and checks the sources it cites.

A few free checks a day · papers already verified open instantly · results are public

Claims other papers make about this one

Each is checked against this paper’s own text: does it say what the citing paper says it does?

Self-check

Percentages, sums and reported differences re-computed from the paper’s own numbers.

The self-check needs the paper’s full text.

Citations

Cites

Show all 63 references

Cited by

Sorted by citations

See all 114

Metadata

Authors
DeMare, L. E., Leng, J., Cotney, J., Reilly, S. K., Yin, J., Sarro, R., & Noonan, J. P.
Affiliations
Yale University (US)
Corresponding author
Noonan, James P.
Venue
Genome Research
Published
2013-05-23
Volume
23
Issue
8
Pages
1224-1234
ISSN
1088-9051 (ISSN-L)
OpenAlex
W2024640399
Cited by
114
References
63
Citations by year
2026: 2 · 2025: 2 · 2024: 2 · 2023: 5 · 2022: 4 · 2021: 2 · 2020: 10 · 2019: 6 · 2018: 3 · 2017: 20 · 2016: 12 · 2015: 19 · 2014: 18 · 2013: 9
Type
posted content
Language
en
Open access
Locations
  • Genome Research (publishedVersion)
  • Europe PMC (PubMed Central) (publishedVersion, cc-by-nc)
  • PubMed Central (publishedVersion, cc-by-nc)
  • PubMed (publishedVersion)
  • HighWire Press Open Archive (submittedVersion)
Funders
  • National Science Foundation
  • Howard Hughes Medical Institute
  • Edward Mallinckrodt, Jr. Foundation
  • National Institutes of Health
  • National Institute of General Medical Sciences (T32GM007223, GM094780, R01GM094780)
  • Eunice Kennedy Shriver National Institute of Child Health and Human Development (T32HD007149)
Topics
  • Life Sciences › Biochemistry, Genetics and Molecular Biology › Molecular Biology › Genomics and Chromatin Dynamics
  • Life Sciences › Biochemistry, Genetics and Molecular Biology › Molecular Biology › Chromatin Remodeling and Cancer
  • Life Sciences › Biochemistry, Genetics and Molecular Biology › Molecular Biology › Epigenetics and DNA Methylation
Keywords
cohesin, SMC1A, CTCF, chromatin interactions, enhancer-promoter interactions, insulator proteins, tissue-specific gene regulation, limb development, embryonic stem cells, chromatin looping, regulatory architecture, mouse embryo
MeSH terms
CCCTC-Binding Factor, Cohesins, Structural Maintenance of Chromosome Protein 1, Animals, Binding Sites, Chromatin, Chromosomal Proteins, Non-Histone, Enhancer Elements, Genetic, Histones, Mice, Inbred C57BL, Organ Specificity, Promoter Regions, Genetic, Repressor Proteins, Genome, Gene Expression Regulation, Developmental, Cell Cycle Proteins, Limb Buds, Protein Subunits, Chromatin Immunoprecipitation, Mice

About these checks

Registry, retraction, Cites and statistics results are computed, not judged, with one exception: a printed reference that no index lists is read once by a model before it counts as a citation error. Claims are extracted by a model and kept only when their quote appears verbatim in the text; each cited source is then checked, with a model’s help, for whether it says what the claim relies on. Those verdicts can be wrong — read the claim’s quote and the cited source before relying on one.

Statistics and arithmetic are recomputed, not judged.

Confidence bands are shown only for fields calibrated on our annotated test set. None is calibrated yet, so no band is shown.

What counts as a claim ›How we measure confidence ›How we check this ›

Are you an author, or do you see a problem with this page? Request a review