

The DOI matches its Crossref record; 66 of the 66 references it cites were found in a registry or an index; none of the 59 sources its claims cite is checked for support yet.
YY1 and CTCF orchestrate a 3D chromatin looping switch during early neural lineage commitment
Open accessAbstract
CTCF is an architectural protein with a critical role in connecting higher-order chromatin folding in pluripotent stem cells. Recent reports have suggested that CTCF binding is more dynamic during development than previously appreciated. Here, we set out to understand the extent to which shifts in genome-wide CTCF occupancy contribute to the 3D reconfiguration of fine-scale chromatin folding during early neural lineage commitment. Unexpectedly, we observe a sharp decrease in CTCF occupancy during the transition from naïve/primed pluripotency to multipotent primary neural progenitor cells (NPCs). Many pluripotency gene-enhancer interactions are anchored by CTCF, and its occupancy is lost in parallel with loop decommissioning during differentiation. Conversely, CTCF binding sites in NPCs are largely preexisting in pluripotent stem cells. Only a small number of CTCF sites arise de novo in NPCs. We identify another zinc finger protein, Yin Yang 1 (YY1), at the base of looping interactions between NPC-specific genes and enhancers. Putative NPC-specific enhancers exhibit strong YY1 signal when engaged in 3D contacts and negligible YY1 signal when not in loops. Moreover, siRNA knockdown of Yy1 specifically disrupts interactions between key NPC enhancers and their target genes. YY1-mediated interactions between NPC regulatory elements are often nested within constitutive loops anchored by CTCF. Together, our results support a model in which YY1 acts as an architectural protein to connect developmentally regulated looping interactions; the location of YY1-mediated interactions may be demarcated in development by a preexisting topological framework created by constitutive CTCF-mediated interactions.
Overview
AI snapshot
Written from the paper’s full text.
TL;DR
During early neural lineage commitment, CTCF occupancy is globally pruned from pluripotent stem cells to multipotent neural progenitor cells (NPCs), while NPC-specific enhancer–gene loops are instead anchored by YY1. The paper proposes that YY1-mediated NPC looping interactions arise within a preexisting constitutive CTCF-anchored topological framework.
Key findings
- CTCF binding decreases stepwise across ES 2i, ES serum, and NPCs: 56,138, 50,185, and 28,860 sites, respectively, with 60,688 unique sites total. Of these, 26,435 were constitutive, 8,832 were “2i only,” 20,068 were “2i+Serum,” and only 1,119 were “NPC-only”; CTCF gene expression and protein levels also decreased in NPCs.
- 5C analysis identified 141 constitutive loops, 46 “2i+Serum” loops lost in NPCs, and 75 NPC-only loops. “2i+Serum” loops were enriched for “2i+Serum” CTCF sites, and the pluripotency-specific Sox2–ES enhancer loop broke concurrently with CTCF loss.
- NPC-only loops were not enriched for NPC-only CTCF binding: almost 40% of NPC-only interactions lacked CTCF anchoring, versus <5% of constitutive and <10% of “2i+serum” interactions. Instead, YY1 was strongly enriched at NPC-only loops and at NPC-specific enhancers engaged in 3D contacts, with negligible YY1 signal at NPC-specific enhancers not in loops.
- YY1 sites were less constitutive than CTCF sites (36%, 39%, and 25% constitutive across ES serum, NPCs, and pro-B cells; n = 3,474). NPC-specific enhancers were enriched in NPC-only loops when bound by YY1 without CTCF, but not when bound by CTCF without YY1. Yy1 siRNA knockdown produced >50% reduction in Yy1 expression/protein, disrupted the Sox2–enhancer loop, decreased Sox2 expression, and also reduced Klf4 and Zfp462 looping and Nes/Olig1/Olig2 expression.
Methods
- ChIP-seq was performed for CTCF in mouse ES 2i, ES serum, and NPCs, with ENCODE mouse brain CTCF data reanalyzed; RNA-seq and Western blot assessed CTCF expression/protein. YY1 and H3K27ac ChIP-seq datasets were also analyzed.
- 5C with high-throughput sequencing generated fine-scale chromatin architecture maps at ~4- to 12-kb matrix resolution across >7 Mb of the mouse genome, using n = 2 biological replicates and reanalyzed published 5C libraries. A new computational pipeline used donut and lower-left background filters, logistic-distribution P-values, interaction scores, and seven looping classes; top five dynamic classes had empirical FDR <15%.
- Yy1 knockdown in NPCs used Dharmacon siRNA pools at 20 nM for 78 h, followed by Western blot, qPCR, and 3C/5C analysis.
Limitations
- Stated: the authors cannot rule out that heterogeneity in ENCODE brain tissues contributed to the aggregate CTCF decrease, though their NPC cultures were >90% SOX2 positive. The role of YY1 in ES cells remains unclear because of possible greater ES reliance on CTCF, different ChIP methods between ES and NPC YY1 datasets, or a different regulatory role for YY1 in the two cell types.
- Stated: technical issues with poor library complexity prevented high-complexity 5C maps at Olig1, Olig2, and Nes after Yy1 knockdown; for those loci, only expression reductions were observed.
- Evident: 5C covered selected regions (>7 Mb) rather than the whole genome, and the Yy1 perturbation was an siRNA knockdown with >50% reduction rather than a complete knockout, so some conclusions about YY1’s architectural role remain correlative or partial.
Model-written summary. Check it against the paper before relying on it.
Integrity signals
Registry
Cites
Statistics
Figures
Verification
Claims the paper makes
65 Own result · 39 Not checked yet · 25 Own interpretation · 6 Own method
A result the paper reports from its own data — it cites no other source for it, so there is none to check. The quote shows it is in the paper.
In the paper
“We identify another zinc finger protein, Yin Yang 1 (YY1), at the base of looping interactions between NPC-specific genes and enhancers.”
§ YY1 and CTCF orchestrate a 3D chromatin looping switch during early neural lineage commitment > Abstract
plaincorrelational- Asserted: passes — The authors put it forward as true.
- Checkable: passes — It can be checked against evidence.
- Load-bearing: passes — The paper’s conclusions depend on it.
- Based: passes — The paper gives a reason why it holds.
A result the paper reports from its own data — it cites no other source for it, so there is none to check. The quote shows it is in the paper.
In the paper
“Conversely, CTCF binding sites in NPCs are largely preexisting in pluripotent stem cells.”
§ YY1 and CTCF orchestrate a 3D chromatin looping switch during early neural lineage commitment > Abstract
plain- Asserted: passes — The authors put it forward as true.
- Checkable: passes — It can be checked against evidence.
- Load-bearing: passes — The paper’s conclusions depend on it.
- Based: passes — The paper gives a reason why it holds.
A result the paper reports from its own data — it cites no other source for it, so there is none to check. The quote shows it is in the paper.
In the paper
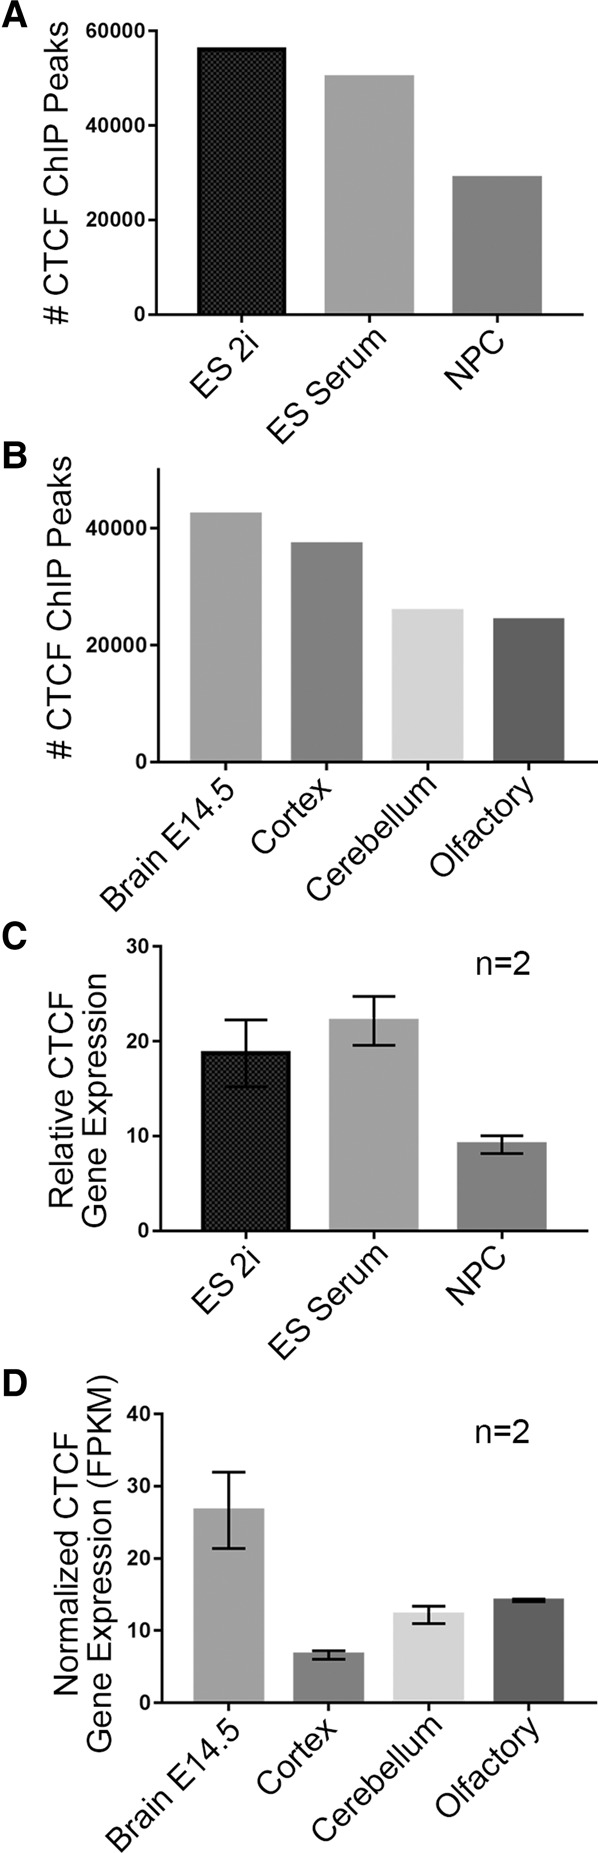
“We first noticed that the number of CTCF binding sites decreased in a stepwise manner during the transition from naïve pluripotency to multipotency, with the sharpest drop in binding sites between ES serum and NPC conditions (Fig. 1A).”
§ YY1 and CTCF orchestrate a 3D chromatin looping switch during early neural lineage commitment > Results > CTCF engagement with the genome decreases during neural development
plaincorrelational- Asserted: passes — The authors put it forward as true.
- Checkable: passes — It can be checked against evidence.
- Load-bearing: passes — The paper’s conclusions depend on it.
- Based: passes — The paper gives a reason why it holds.
A result the paper reports from its own data — it cites no other source for it, so there is none to check. The quote shows it is in the paper.
In the paper
“Unexpectedly, we observe a sharp decrease in CTCF occupancy during the transition from naïve/primed pluripotency to multipotent primary neural progenitor cells (NPCs).”
§ YY1 and CTCF orchestrate a 3D chromatin looping switch during early neural lineage commitment > Abstract
plaindirect- Asserted: passes — The authors put it forward as true.
- Checkable: passes — It can be checked against evidence.
- Load-bearing: passes — The paper’s conclusions depend on it.
- Based: passes — The paper gives a reason why it holds.
A result the paper reports from its own data — it cites no other source for it, so there is none to check. The quote shows it is in the paper.
In the paper
“YY1-mediated interactions between NPC regulatory elements are often nested within constitutive loops anchored by CTCF.”
§ YY1 and CTCF orchestrate a 3D chromatin looping switch during early neural lineage commitment > Abstract
plaincorrelational- Asserted: passes — The authors put it forward as true.
- Checkable: passes — It can be checked against evidence.
- Load-bearing: passes — The paper’s conclusions depend on it.
- Based: passes — The paper gives a reason why it holds.
A result the paper reports from its own data — it cites no other source for it, so there is none to check. The quote shows it is in the paper.
In the paper
“Only a small number of CTCF sites arise de novo in NPCs.”
§ YY1 and CTCF orchestrate a 3D chromatin looping switch during early neural lineage commitment > Abstract
plain- Asserted: passes — The authors put it forward as true.
- Checkable: passes — It can be checked against evidence.
- Load-bearing: passes — The paper’s conclusions depend on it.
- Based: passes — The paper gives a reason why it holds.
A result the paper reports from its own data — it cites no other source for it, so there is none to check. The quote shows it is in the paper.
In the paper
“Moreover, Western blot analysis of CTCF protein levels showed a similar decrease in NPCs compared to pluripotent ES cells (Supplemental Fig. 1C).”
§ YY1 and CTCF orchestrate a 3D chromatin looping switch during early neural lineage commitment > Results > CTCF engagement with the genome decreases during neural development
plaincorrelational- Asserted: passes — The authors put it forward as true.
- Checkable: passes — It can be checked against evidence.
- Load-bearing: unclear — It is unclear whether the paper’s conclusions depend on it.
- Based: passes — The paper gives a reason why it holds.
A result the paper reports from its own data — it cites no other source for it, so there is none to check. The quote shows it is in the paper.
In the paper
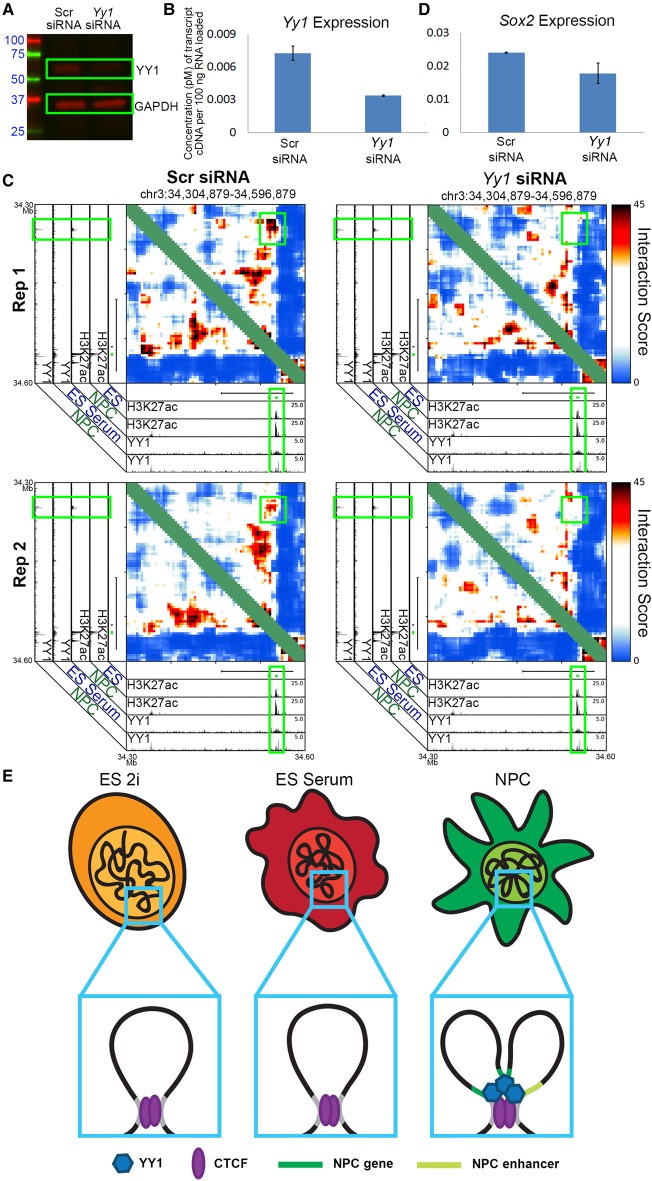
“Moreover, siRNA knockdown of Yy1 specifically disrupts interactions between key NPC enhancers and their target genes.”
§ YY1 and CTCF orchestrate a 3D chromatin looping switch during early neural lineage commitment > Abstract
plaindirect- Asserted: passes — The authors put it forward as true.
- Checkable: passes — It can be checked against evidence.
- Load-bearing: passes — The paper’s conclusions depend on it.
- Based: passes — The paper gives a reason why it holds.
In the paper
“Consistent with trends in our cellular models, published ENCODE CTCF ChIP-seq peaks also showed a global decrease in adult brain regions (cortex, cerebellum, olfactory) compared to the E14.5 brain tissue (Fig. 1B).”
§ YY1 and CTCF orchestrate a 3D chromatin looping switch during early neural lineage commitment > Results > CTCF engagement with the genome decreases during neural development
What the sources say
- Not checked yetcites Shen et al. 2012
plaincorrelational- Asserted: passes — The authors put it forward as true.
- Checkable: passes — It can be checked against evidence.
- Load-bearing: unclear — It is unclear whether the paper’s conclusions depend on it.
- Based: passes — The paper gives a reason why it holds.
A result the paper reports from its own data — it cites no other source for it, so there is none to check. The quote shows it is in the paper.
In the paper
“Finally, we assessed the orientation of the CTCF motifs at loop anchors and confirmed that loops in all three cell types were highly enriched for convergently oriented motifs compared with divergent or tandem orientations (Supplemental Fig. 9A,B).”
§ YY1 and CTCF orchestrate a 3D chromatin looping switch during early neural lineage commitment > Results > The 3D genome is reconfigured during early neural development
boostedcorrelational- Asserted: passes — The authors put it forward as true.
- Checkable: passes — It can be checked against evidence.
- Load-bearing: unclear — It is unclear whether the paper’s conclusions depend on it.
- Based: passes — The paper gives a reason why it holds.
- It may state two separate claims as one. 32
- Probably not a substantial claim. 35
- The quote only partly states this claim. 1
A result the paper reports from its own data — it cites no other source for it, so there is none to check. The quote shows it is in the paper.
In the paper
“Many pluripotency gene-enhancer interactions are anchored by CTCF, and its occupancy is lost in parallel with loop decommissioning during differentiation.”
§ YY1 and CTCF orchestrate a 3D chromatin looping switch during early neural lineage commitment > Abstract
plaincorrelational- Asserted: passes — The authors put it forward as true.
- Checkable: passes — It can be checked against evidence.
- Load-bearing: passes — The paper’s conclusions depend on it.
- Based: passes — The paper gives a reason why it holds.
It may state two separate claims as one.
A result the paper reports from its own data — it cites no other source for it, so there is none to check. The quote shows it is in the paper.
In the paper
“Putative NPC-specific enhancers exhibit strong YY1 signal when engaged in 3D contacts and negligible YY1 signal when not in loops.”
§ YY1 and CTCF orchestrate a 3D chromatin looping switch during early neural lineage commitment > Abstract
hedgedcorrelational- Asserted: passes — The authors put it forward as true.
- Checkable: passes — It can be checked against evidence.
- Load-bearing: passes — The paper’s conclusions depend on it.
- Based: passes — The paper gives a reason why it holds.
It may state two separate claims as one.
A result the paper reports from its own data — it cites no other source for it, so there is none to check. The quote shows it is in the paper.
In the paper
“Notably, when we investigated other developmental lineages, we found that CTCF binding can display the opposite trend, in some cases increasing between the embryonic and adult stages (Supplemental Fig. 1A,B).”
§ YY1 and CTCF orchestrate a 3D chromatin looping switch during early neural lineage commitment > Results > CTCF engagement with the genome decreases during neural development
plaindirect- Asserted: passes — The authors put it forward as true.
- Checkable: passes — It can be checked against evidence.
- Load-bearing: fails — The paper’s conclusions may not depend on it.
- Based: passes — The paper gives a reason why it holds.
Probably not a substantial claim. The paper’s conclusions may not depend on it.
A result the paper reports from its own data — it cites no other source for it, so there is none to check. The quote shows it is in the paper.
In the paper
“We observed a general accordance between the ChIP-seq and RNA-seq results in our cellular models: CTCF gene expression decreased between the pluripotent stem cell states and multipotent NPCs (Fig. 1C) and also between the embryonic mouse brain and mature adult brain regions (Fig. 1D).”
§ YY1 and CTCF orchestrate a 3D chromatin looping switch during early neural lineage commitment > Results > CTCF engagement with the genome decreases during neural development
plaincorrelational- Asserted: passes — The authors put it forward as true.
- Checkable: passes — It can be checked against evidence.
- Load-bearing: passes — The paper’s conclusions depend on it.
- Based: passes — The paper gives a reason why it holds.
It may state two separate claims as one.
A result the paper reports from its own data — it cites no other source for it, so there is none to check. The quote shows it is in the paper.
In the paper
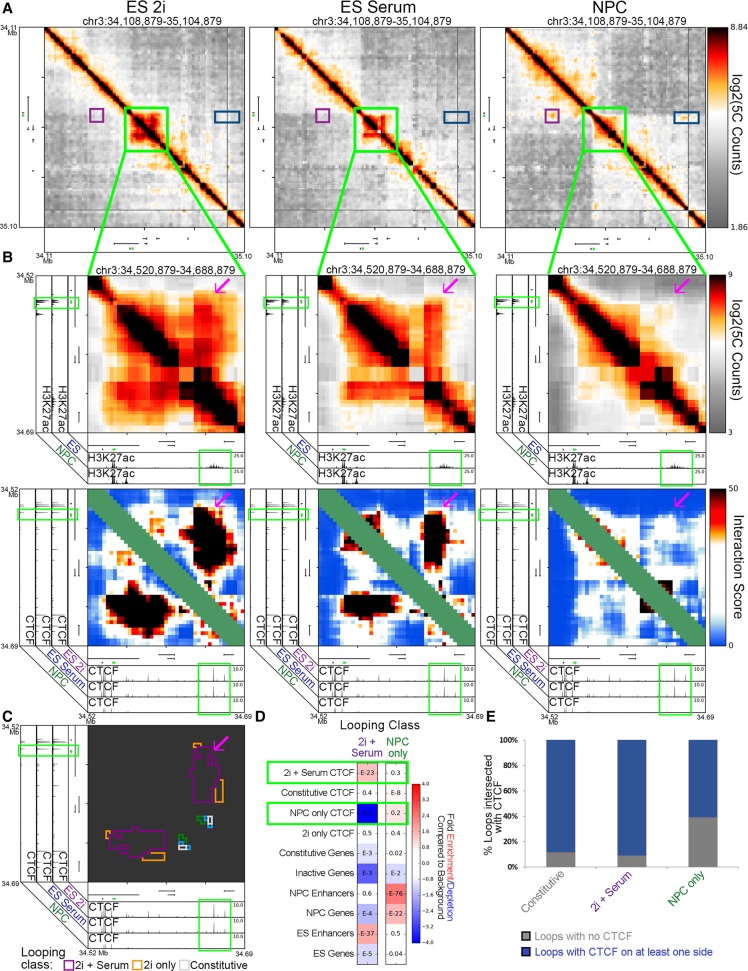
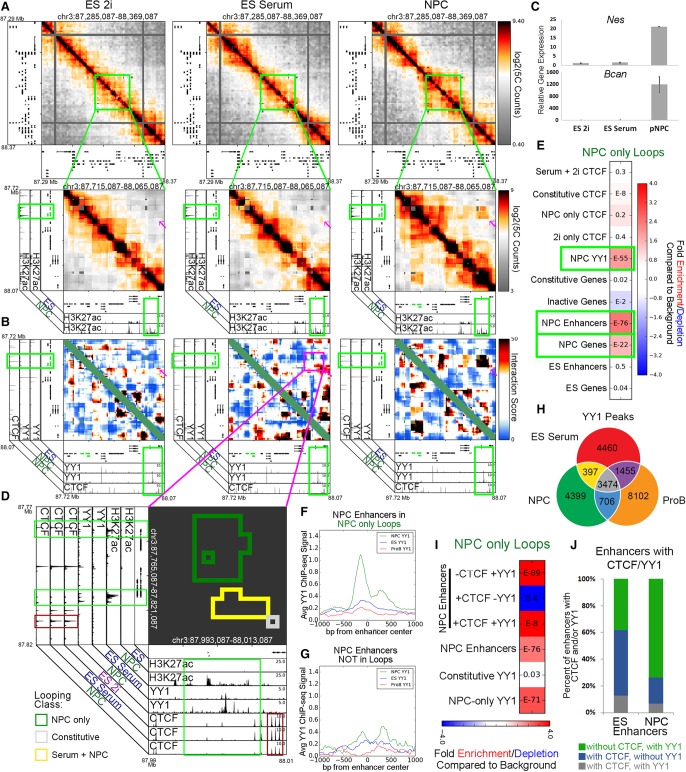
“Notably, when we explored the percentage of key looping classes anchored by CTCF, we found that almost 40% of “NPC-only” interactions were not anchored by CTCF binding, whereas only <5% and <10% of “constitutive” and “2i+serum” interactions lacked CTCF binding, respectively (Fig. 4E, black bars).”
§ YY1 and CTCF orchestrate a 3D chromatin looping switch during early neural lineage commitment > Results > CTCF binding correlates with loss of 3D interactions during the departure from pluripotency
plaincorrelational- Asserted: passes — The authors put it forward as true.
- Checkable: passes — It can be checked against evidence.
- Load-bearing: passes — The paper’s conclusions depend on it.
- Based: passes — The paper gives a reason why it holds.
It may state two separate claims as one.
A result the paper reports from its own data — it cites no other source for it, so there is none to check. The quote shows it is in the paper.
In the paper
“During the departure from pluripotency, CTCF binding is lost, and the looping interaction connecting the Sox2 gene to the putative ES-specific enhancer concurrently breaks apart (Fig. 4B,C; Supplemental Fig. 10A,B, red arrow).”
§ YY1 and CTCF orchestrate a 3D chromatin looping switch during early neural lineage commitment > Results > CTCF binding correlates with loss of 3D interactions during the departure from pluripotency
plaincorrelational- Asserted: passes — The authors put it forward as true.
- Checkable: passes — It can be checked against evidence.
- Load-bearing: passes — The paper’s conclusions depend on it.
- Based: passes — The paper gives a reason why it holds.
It may state two separate claims as one.
A result the paper reports from its own data — it cites no other source for it, so there is none to check. The quote shows it is in the paper.
In the paper
“CTCF signal was negligible at all classes of YY1 binding, suggesting that YY1 and CTCF do not, for the most part, directly colocalize (Supplemental Fig. 12F,G).”
§ YY1 and CTCF orchestrate a 3D chromatin looping switch during early neural lineage commitment > Results > YY1 binding is enriched at looping interactions connecting NPC-specific genes and distal regulatory elements
hedged- Asserted: passes — The authors put it forward as true.
- Checkable: passes — It can be checked against evidence.
- Load-bearing: passes — The paper’s conclusions depend on it.
- Based: passes — The paper gives a reason why it holds.
It may state two separate claims as one.
A result the paper reports from its own data — it cites no other source for it, so there is none to check. The quote shows it is in the paper.
In the paper
“We found strong YY1 signal at NPC-specific enhancers engaged in “NPC-only” looping interactions and negligible YY1 binding at NPC-specific enhancers that do not loop.”
§ YY1 and CTCF orchestrate a 3D chromatin looping switch during early neural lineage commitment > Results > YY1 binding is enriched at looping interactions connecting NPC-specific genes and distal regulatory elements
boostedcorrelational- Asserted: passes — The authors put it forward as true.
- Checkable: passes — It can be checked against evidence.
- Load-bearing: passes — The paper’s conclusions depend on it.
- Based: passes — The paper gives a reason why it holds.
It may state two separate claims as one.
A result the paper reports from its own data — it cites no other source for it, so there is none to check. The quote shows it is in the paper.
In the paper
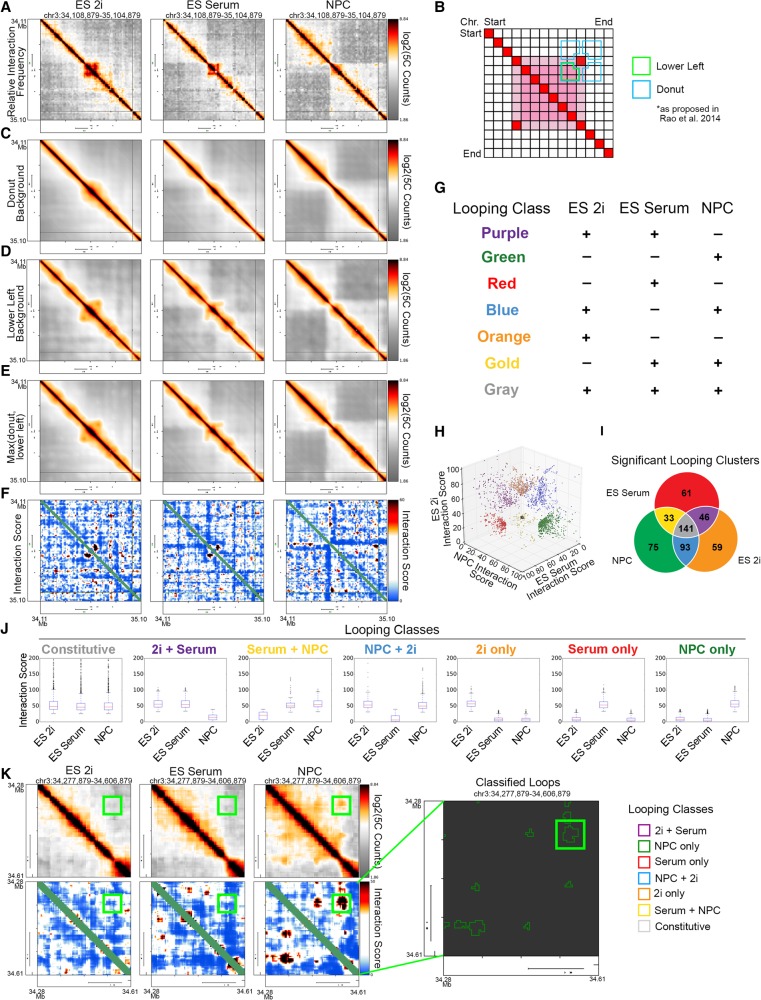
“Altogether, we identified several classes of 3D interactions (Fig. 3I) and elected to focus our analysis on three main groups: (1) 141 loops present in all three cell types (“Constitutive,” gray class); (2) 46 loops present in both ES 2i and ES serum but lost in NPCs (“2i+Serum,” purple class); and (3) 75 loops specific to the NPC state (“NPC-only,” green class).”
§ YY1 and CTCF orchestrate a 3D chromatin looping switch during early neural lineage commitment > Results > The 3D genome is reconfigured during early neural development
plain- Asserted: passes — The authors put it forward as true.
- Checkable: passes — It can be checked against evidence.
- Load-bearing: passes — The paper’s conclusions depend on it.
- Based: passes — The paper gives a reason why it holds.
It may state two separate claims as one.
A result the paper reports from its own data — it cites no other source for it, so there is none to check. The quote shows it is in the paper.
In the paper
“In contrast, a markedly lower proportion of classified YY1 sites were constitutive among ES serum, NPCs, and primary pro-B cells (36%, 39%, and 25%, respectively; n = 3474), indicating that YY1 might exhibit more cell-type–specific binding than CTCF (Fig. 5H).”
§ YY1 and CTCF orchestrate a 3D chromatin looping switch during early neural lineage commitment > Results > YY1 binding is enriched at looping interactions connecting NPC-specific genes and distal regulatory elements
hedgedcorrelationaln = 3,474- Asserted: passes — The authors put it forward as true.
- Checkable: passes — It can be checked against evidence.
- Load-bearing: passes — The paper’s conclusions depend on it.
- Based: passes — The paper gives a reason why it holds.
It may state two separate claims as one.
A result the paper reports from its own data — it cites no other source for it, so there is none to check. The quote shows it is in the paper.
In the paper
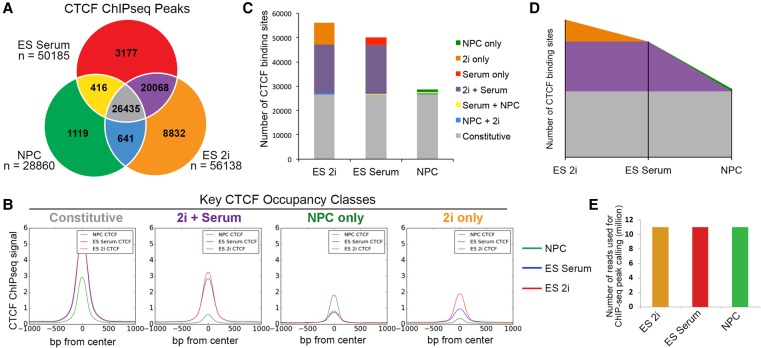
“First, we find that CTCF occupancy is predominantly lost in the transition from ES cells to multipotent NPCs, suggesting that the CTCF occupancy landscape might be saturated in naïve pluripotency and regulated primarily through selective pruning of CTCF binding sites.”
- Also stated in: § Discussion · plain
“Here, we find that CTCF occupancy is highest in the naïve pluripotent stem cell state and globally decreases in parallel with its expression during the commitment to multipotent NPCs.”
§ YY1 and CTCF orchestrate a 3D chromatin looping switch during early neural lineage commitment > Discussion
plaincorrelational- Asserted: passes — The authors put it forward as true.
- Checkable: passes — It can be checked against evidence.
- Load-bearing: passes — The paper’s conclusions depend on it.
- Based: passes — The paper gives a reason why it holds.
It may state two separate claims as one.
- Also stated in: § Discussion · plain
A result the paper reports from its own data — it cites no other source for it, so there is none to check. The quote shows it is in the paper.
In the paper
“Several key NPC-specific enhancer-gene looping interactions were ablated upon Yy1 knockdown.”
§ YY1 and CTCF orchestrate a 3D chromatin looping switch during early neural lineage commitment > Discussion
plaindirect- Asserted: passes — The authors put it forward as true.
- Checkable: passes — It can be checked against evidence.
- Load-bearing: passes — The paper’s conclusions depend on it.
- Based: passes — The paper gives a reason why it holds.
It may state two separate claims as one. The quote only partly states this claim.
A result the paper reports from its own data — it cites no other source for it, so there is none to check. The quote shows it is in the paper.
In the paper
“A large cohort of roughly 8000 and roughly 20,000 CTCF sites are lost during the transition from ES 2i to ES serum and ES serum to NPCs, respectively.”
§ YY1 and CTCF orchestrate a 3D chromatin looping switch during early neural lineage commitment > Discussion
plaindirect- Asserted: passes — The authors put it forward as true.
- Checkable: passes — It can be checked against evidence.
- Load-bearing: passes — The paper’s conclusions depend on it.
- Based: passes — The paper gives a reason why it holds.
It may state two separate claims as one.
A result the paper reports from its own data — it cites no other source for it, so there is none to check. The quote shows it is in the paper.
In the paper
“Rather, we detected high levels of occupancy of the zinc finger protein YY1 at NPC-specific genes and enhancers when engaged in NPC-specific 3D interactions and negligible YY1 levels when these regulatory elements did not interact.”
§ YY1 and CTCF orchestrate a 3D chromatin looping switch during early neural lineage commitment > Discussion
plaincorrelational- Asserted: passes — The authors put it forward as true.
- Checkable: passes — It can be checked against evidence.
- Load-bearing: passes — The paper’s conclusions depend on it.
- Based: passes — The paper gives a reason why it holds.
It may state two separate claims as one.
A result the paper reports from its own data — it cites no other source for it, so there is none to check. The quote shows it is in the paper.
In the paper
“Additionally, “2i+serum” looping interactions were enriched for ES-specific enhancers regardless of CTCF and YY1 occupancy, whereas ES-specific genes were only enriched in “2i+serum” looping interactions when bound by CTCF without YY1 (Supplemental Fig. 12J,L).”
§ YY1 and CTCF orchestrate a 3D chromatin looping switch during early neural lineage commitment > Results > YY1 binding is enriched at looping interactions connecting NPC-specific genes and distal regulatory elements
plaincorrelational- Asserted: passes — The authors put it forward as true.
- Checkable: passes — It can be checked against evidence.
- Load-bearing: unclear — It is unclear whether the paper’s conclusions depend on it.
- Based: passes — The paper gives a reason why it holds.
It may state two separate claims as one.
A result the paper reports from its own data — it cites no other source for it, so there is none to check. The quote shows it is in the paper.
In the paper
“YY1 occupancy signal was low and diffuse across putative ES-specific regulatory elements and did not show a clear preference between those engaged in loops versus nonloops (Supplemental Fig. 12D,E).”
§ YY1 and CTCF orchestrate a 3D chromatin looping switch during early neural lineage commitment > Results > YY1 binding is enriched at looping interactions connecting NPC-specific genes and distal regulatory elements
plain- Asserted: passes — The authors put it forward as true.
- Checkable: passes — It can be checked against evidence.
- Load-bearing: passes — The paper’s conclusions depend on it.
- Based: passes — The paper gives a reason why it holds.
It may state two separate claims as one.
A result the paper reports from its own data — it cites no other source for it, so there is none to check. The quote shows it is in the paper.
In the paper
“By focusing on distal cell-type–specific regulatory elements that overlap binding sites of CTCF, YY1, or both (and not considering those bound by neither), we observed that the majority of architectural protein-bound NPC-specific enhancers were bound by YY1 without CTCF, whereas the majority of ES-specific enhancers were bound by CTCF without YY1 (Fig. 5J).”
§ YY1 and CTCF orchestrate a 3D chromatin looping switch during early neural lineage commitment > Results > YY1 binding is enriched at looping interactions connecting NPC-specific genes and distal regulatory elements
plaincorrelational- Asserted: passes — The authors put it forward as true.
- Checkable: passes — It can be checked against evidence.
- Load-bearing: passes — The paper’s conclusions depend on it.
- Based: passes — The paper gives a reason why it holds.
It may state two separate claims as one.
None of the sources cited for this claim have been checked yet.
In the paper
“Looping interactions and sub-TADs often link genes to developmentally regulated enhancers and are markedly reorganized between cellular states (Tolhuis et al. 2002; Sanyal et al. 2012; Phillips-Cremins et al. 2013; Dowen et al. 2014; Smith et al. 2016).”
§ YY1 and CTCF orchestrate a 3D chromatin looping switch during early neural lineage commitment > Abstract
What the sources say
- Not checked yetcites Tolhuis et al. 2002
- Not checked yetcites Sanyal et al. 2012
- Not checked yetcites Phillips-Cremins et al. 2013
plaincorrelational- Asserted: passes — The authors put it forward as true.
- Checkable: passes — It can be checked against evidence.
- Load-bearing: passes — The paper’s conclusions depend on it.
- Based: passes — The paper gives a reason why it holds.
Probably not a substantial claim. It may state two separate claims as one.
A conclusion the paper draws from its own results — it cites no other source for it, so there is none to check. The quote shows it is in the paper.
In the paper
“Thus, although CTCF occupancy appears to decrease during the transition from pluripotency to early neuronal lineage commitment, it is not a pervasive trend across all developmental lineages.”
§ YY1 and CTCF orchestrate a 3D chromatin looping switch during early neural lineage commitment > Results > CTCF engagement with the genome decreases during neural development
hedgedcorrelational- Asserted: passes — The authors put it forward as true.
- Checkable: passes — It can be checked against evidence.
- Load-bearing: unclear — It is unclear whether the paper’s conclusions depend on it.
- Based: passes — The paper gives a reason why it holds.
It may state two separate claims as one.
None of the sources cited for this claim have been checked yet.
In the paper
“CTCF is found at the base of looping interactions, and knockdown of the protein abrogates chromatin connections (Kurukuti et al. 2006; Hadjur et al. 2009; Handoko et al. 2011; Splinter et al. 2012).”
§ YY1 and CTCF orchestrate a 3D chromatin looping switch during early neural lineage commitment > Abstract
What the sources say
- Not checked yetcites Kurukuti et al. 2006
- Not checked yetcites Hadjur et al. 2009
- Not checked yetcites Handoko et al. 2011
plaindirect- Asserted: passes — The authors put it forward as true.
- Checkable: passes — It can be checked against evidence.
- Load-bearing: passes — The paper’s conclusions depend on it.
- Based: passes — The paper gives a reason why it holds.
It may state two separate claims as one.
In the paper
“Corroborating our results, while this manuscript was under review, an independent study also reported a decrease in CTCF protein levels in whole mouse brains during the transition from E15 to post-natal week 1 (Sams et al. 2016).”
§ YY1 and CTCF orchestrate a 3D chromatin looping switch during early neural lineage commitment > Results > CTCF engagement with the genome decreases during neural development
What the sources say
- Not checked yetcites Sams et al. 2016
plaincorrelational- Asserted: passes — The authors put it forward as true.
- Checkable: passes — It can be checked against evidence.
- Load-bearing: fails — The paper’s conclusions may not depend on it.
- Based: passes — The paper gives a reason why it holds.
Probably not a substantial claim. The paper’s conclusions may not depend on it.
None of the sources cited for this claim have been checked yet.
In the paper
“CTCF-mediated interactions can be disrupted by mutation, inversion, and/or deletion of the CTCF motif, indicating that consensus orientation is a critical contributing factor in loop establishment and/or maintenance (de Wit et al. 2015; Guo et al. 2015; Sanborn et al. 2015).”
§ YY1 and CTCF orchestrate a 3D chromatin looping switch during early neural lineage commitment > Abstract
What the sources say
- Not checked yetcites de Wit et al. 2015
- Not checked yetcites Guo et al. 2015
- Not checked yetcites Sanborn et al. 2015
hedgeddirect- Asserted: passes — The authors put it forward as true.
- Checkable: passes — It can be checked against evidence.
- Load-bearing: fails — The paper’s conclusions may not depend on it.
- Based: passes — The paper gives a reason why it holds.
Probably not a substantial claim. The paper’s conclusions may not depend on it.
A conclusion the paper draws from its own results — it cites no other source for it, so there is none to check. The quote shows it is in the paper.
In the paper
“Together, our results support a model in which YY1 acts as an architectural protein to connect developmentally regulated looping interactions; the location of YY1-mediated interactions may be demarcated in development by a preexisting topological framework created by constitutive CTCF-mediated interactions.”
§ YY1 and CTCF orchestrate a 3D chromatin looping switch during early neural lineage commitment > Abstract
hedgedconditional- Asserted: passes — The authors put it forward as true.
- Checkable: passes — It can be checked against evidence.
- Load-bearing: passes — The paper’s conclusions depend on it.
- Based: passes — The paper gives a reason why it holds.
It may state two separate claims as one.
None of the sources cited for this claim have been checked yet.
In the paper
“Importantly, of the subset of loops bound by CTCF with clear consensus sequences, 92% were anchored by consensus sequences pointed toward each other in a convergent orientation (Rao et al. 2014; Vietri Rudan et al. 2015).”
§ YY1 and CTCF orchestrate a 3D chromatin looping switch during early neural lineage commitment > Abstract
What the sources say
- Not checked yetcites Rao et al. 2014
- Not checked yetcites Vietri Rudan et al. 2015
plaincorrelational- Asserted: passes — The authors put it forward as true.
- Checkable: passes — It can be checked against evidence.
- Load-bearing: fails — The paper’s conclusions may not depend on it.
- Based: passes — The paper gives a reason why it holds.
Probably not a substantial claim. The paper’s conclusions may not depend on it.
In the paper
“A leading hypothesis is that CTCF's diverse regulatory roles can be explained by a unifying mechanism in which it functions as an architectural protein to connect higher-order chromatin configurations (Phillips and Corces 2009).”
§ YY1 and CTCF orchestrate a 3D chromatin looping switch during early neural lineage commitment > Abstract
What the sources say
- Not checked yetcites Phillips and Corces 2009
hedgeddirect- Asserted: passes — The authors put it forward as true.
- Checkable: passes — It can be checked against evidence.
- Load-bearing: passes — The paper’s conclusions depend on it.
- Based: passes — The paper gives a reason why it holds.
Probably not a substantial claim.
What the paper did — it cites no source for this, so there is none to check. The quote shows it is in the paper.
In the paper
“Thresholds were chosen so that our top five largest dynamic looping classes achieved an empirical false discovery rate less than 15% (Supplemental Methods; Supplemental Fig. S8B–D).”
§ YY1 and CTCF orchestrate a 3D chromatin looping switch during early neural lineage commitment > Results > The 3D genome is reconfigured during early neural development
plain- Asserted: passes — The authors put it forward as true.
- Checkable: passes — It can be checked against evidence.
- Load-bearing: passes — The paper’s conclusions depend on it.
- Based: passes — The paper gives a reason why it holds.
Probably not a substantial claim.
None of the sources cited for this claim have been checked yet.
In the paper
“CTCF has a well-established role in connecting long-range looping interactions (de Wit et al. 2015; Guo et al. 2015).”
§ YY1 and CTCF orchestrate a 3D chromatin looping switch during early neural lineage commitment > Results > The 3D genome is reconfigured during early neural development
What the sources say
- Not checked yetcites de Wit et al. 2015
- Not checked yetcites Guo et al. 2015
boostedcorrelational- Asserted: passes — The authors put it forward as true.
- Checkable: passes — It can be checked against evidence.
- Load-bearing: fails — The paper’s conclusions may not depend on it.
- Based: passes — The paper gives a reason why it holds.
Probably not a substantial claim. The paper’s conclusions may not depend on it.
In the paper
“Sox2 forms a pluripotency-specific loop with a putative ES-specific enhancer ∼120 kb downstream that is essential for proper expression of the gene in ES cells (Fig. 4A,B, magenta arrowhead; Li et al. 2014).”
§ YY1 and CTCF orchestrate a 3D chromatin looping switch during early neural lineage commitment > Results > CTCF binding correlates with loss of 3D interactions during the departure from pluripotency
What the sources say
- Not checked yetcites Li et al. 2014
hedgeddirect- Asserted: passes — The authors put it forward as true.
- Checkable: passes — It can be checked against evidence.
- Load-bearing: passes — The paper’s conclusions depend on it.
- Based: passes — The paper gives a reason why it holds.
It may state two separate claims as one.
In the paper
“Sams et al. also identified differential CTCF levels across neurons, astrocytes, and oligodendrocytes from the hippocampus, highlighting that we cannot rule out the possibility that heterogeneity in cells derived from ENCODE tissues may contribute to the aggregate decrease in CTCF levels.”
§ YY1 and CTCF orchestrate a 3D chromatin looping switch during early neural lineage commitment > Results > CTCF engagement with the genome decreases during neural development
What the sources say
- Not checked yetcites Sams et al. 2016
hedgedconditional- Asserted: passes — The authors put it forward as true.
- Checkable: passes — It can be checked against evidence.
- Load-bearing: fails — The paper’s conclusions may not depend on it.
- Based: passes — The paper gives a reason why it holds.
Probably not a substantial claim. The paper’s conclusions may not depend on it.
What the paper did — it cites no source for this, so there is none to check. The quote shows it is in the paper.
In the paper
“ChIP-seq experiments were conducted in the same batch, sequenced on the same flow cell, and down-sampled to the same read depth to attenuate technical artifacts that might influence our observed results (Fig. 2E).”
§ YY1 and CTCF orchestrate a 3D chromatin looping switch during early neural lineage commitment > Results > CTCF occupancy in NPCs is largely preestablished in the pluripotent state
plain- Asserted: passes — The authors put it forward as true.
- Checkable: passes — It can be checked against evidence.
- Load-bearing: passes — The paper’s conclusions depend on it.
- Based: passes — The paper gives a reason why it holds.
Probably not a substantial claim. It may state two separate claims as one.
None of the sources cited for this claim have been checked yet.
In the paper
“These results confirm and extend recent reports suggesting that there is a larger class of dynamically occupied CTCF sites than previously appreciated (Shen et al. 2012; Maurano et al. 2015).”
§ YY1 and CTCF orchestrate a 3D chromatin looping switch during early neural lineage commitment > Results > CTCF occupancy in NPCs is largely preestablished in the pluripotent state
What the sources say
- Not checked yetcites Shen et al. 2012
- Not checked yetcites Maurano et al. 2015
hedged- Asserted: passes — The authors put it forward as true.
- Checkable: passes — It can be checked against evidence.
- Load-bearing: fails — The paper’s conclusions may not depend on it.
- Based: passes — The paper gives a reason why it holds.
Probably not a substantial claim. The paper’s conclusions may not depend on it.
In the paper
“Our NPC cultures exhibited a highly consistent morphology throughout the population, and >90% were SOX2 positive (Beagan et al. 2016), suggesting that our NPC preparations were substantially less heterogeneous than brain tissue lysates.”
§ YY1 and CTCF orchestrate a 3D chromatin looping switch during early neural lineage commitment > Results > CTCF engagement with the genome decreases during neural development
What the sources say
- Not checked yetcites Beagan et al. 2016
plain- Asserted: passes — The authors put it forward as true.
- Checkable: passes — It can be checked against evidence.
- Load-bearing: passes — The paper’s conclusions depend on it.
- Based: passes — The paper gives a reason why it holds.
It may state two separate claims as one.
A conclusion the paper draws from its own results — it cites no other source for it, so there is none to check. The quote shows it is in the paper.
In the paper
“Our data indicate that CTCF gene and protein expression levels decrease in the transition from pluripotency to multipotent neural progenitor cells in parallel with a global decrease in the number of genome-wide CTCF binding sites.”
§ YY1 and CTCF orchestrate a 3D chromatin looping switch during early neural lineage commitment > Results > CTCF engagement with the genome decreases during neural development
hedgedcorrelational- Asserted: passes — The authors put it forward as true.
- Checkable: passes — It can be checked against evidence.
- Load-bearing: passes — The paper’s conclusions depend on it.
- Based: passes — The paper gives a reason why it holds.
It may state two separate claims as one.
A conclusion the paper draws from its own results — it cites no other source for it, so there is none to check. The quote shows it is in the paper.
In the paper
“Rather, a large proportion of CTCF sites are preestablished at least as early in development as naïve pluripotency and selectively lost in early neural lineage commitment (Fig. 2D, orange and purple classes).”
§ YY1 and CTCF orchestrate a 3D chromatin looping switch during early neural lineage commitment > Results > CTCF occupancy in NPCs is largely preestablished in the pluripotent state
plaindirect- Asserted: passes — The authors put it forward as true.
- Checkable: passes — It can be checked against evidence.
- Load-bearing: passes — The paper’s conclusions depend on it.
- Based: passes — The paper gives a reason why it holds.
It may state two separate claims as one.
A conclusion the paper draws from its own results — it cites no other source for it, so there is none to check. The quote shows it is in the paper.
In the paper
“These data suggest that YY1 is present at NPC regulatory elements engaged in 3D interactions and support our working hypothesis that YY1 might serve as an architectural protein to connect NPC-specific genes and enhancers.”
§ YY1 and CTCF orchestrate a 3D chromatin looping switch during early neural lineage commitment > Results > YY1 binding is enriched at looping interactions connecting NPC-specific genes and distal regulatory elements
hedgedconditional- Asserted: passes — The authors put it forward as true.
- Checkable: passes — It can be checked against evidence.
- Load-bearing: passes — The paper’s conclusions depend on it.
- Based: passes — The paper gives a reason why it holds.
It may state two separate claims as one.
A conclusion the paper draws from its own results — it cites no other source for it, so there is none to check. The quote shows it is in the paper.
In the paper
“Because CTCF binding is anti-correlated with DNA methylation, we posit that a notable proportion of the large class (n = ∼20,000) of “2i+serum” CTCF sites might be methylated during the initial establishment of the neural lineage and subsequently remain methylated and unbound through terminal differentiation in the developing/maturing brain.”
§ YY1 and CTCF orchestrate a 3D chromatin looping switch during early neural lineage commitment > Discussion
hedgedconditional- Asserted: fails — The authors may not put it forward as true.
- Checkable: passes — It can be checked against evidence.
- Load-bearing: fails — The paper’s conclusions may not depend on it.
- Based: passes — The paper gives a reason why it holds.
Probably not a substantial claim. The authors may not put it forward as true. The paper’s conclusions may not depend on it. It may state two separate claims as one.
- Rests on an assumption: CTCF binding is anti-correlated with DNA methylation.
What the paper did — it cites no source for this, so there is none to check. The quote shows it is in the paper.
In the paper
“Due to technical issues related to poor library complexity across all conditions in this batch of experiments, we were unable to obtain high complexity 5C maps at Olig1, Olig2, and Nes regions.”
§ YY1 and CTCF orchestrate a 3D chromatin looping switch during early neural lineage commitment > Results > Yy1 knockdown results in the loss of key NPC enhancer to gene looping interactions
plaindirect- Asserted: passes — The authors put it forward as true.
- Checkable: passes — It can be checked against evidence.
- Load-bearing: fails — The paper’s conclusions may not depend on it.
- Based: passes — The paper gives a reason why it holds.
Probably not a substantial claim. The paper’s conclusions may not depend on it.
A conclusion the paper draws from its own results — it cites no other source for it, so there is none to check. The quote shows it is in the paper.
In the paper
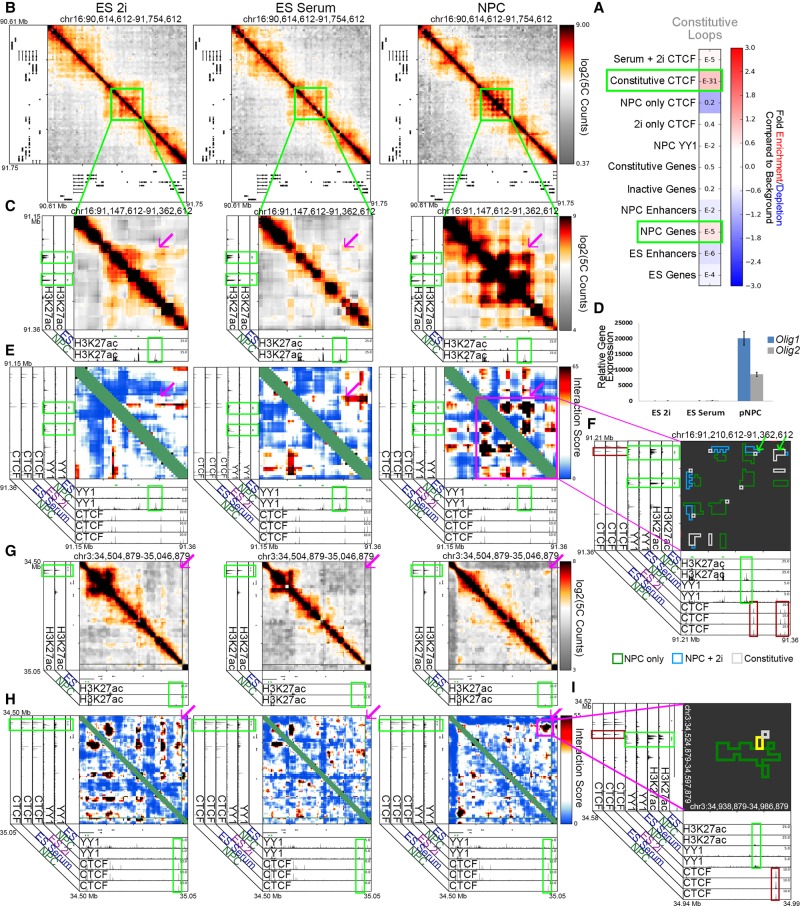
“Together, these results support a working model of 3D genome folding in which developmentally regulated genes such as Nes, Olig1, Olig2, and Sox2 form de novo connections to their target enhancers via YY1 within a larger topological framework preexisting from naïve pluripotency and connected by constitutive CTCF.”
- Also stated in: § Discussion · plain
“Our data support a model in which YY1-anchored looping interactions arise de novo in NPCs within a larger topological framework established prior to or during naïve pluripotency and connected by constitutively bound CTCF (Fig. 7E).”
§ YY1 and CTCF orchestrate a 3D chromatin looping switch during early neural lineage commitment > Results > YY1-mediated developmentally regulated looping interactions are often nested within a larger framework mediated by constitutive CTCF
plaindirect- Asserted: passes — The authors put it forward as true.
- Checkable: passes — It can be checked against evidence.
- Load-bearing: passes — The paper’s conclusions depend on it.
- Based: passes — The paper gives a reason why it holds.
It may state two separate claims as one.
- Also stated in: § Discussion · plain
A conclusion the paper draws from its own results — it cites no other source for it, so there is none to check. The quote shows it is in the paper.
In the paper
“suggesting that the CTCF occupancy landscape might be saturated in naïve pluripotency and regulated primarily through selective pruning of CTCF binding sites.”
§ YY1 and CTCF orchestrate a 3D chromatin looping switch during early neural lineage commitment > Discussion
hedgedconditional- Asserted: passes — The authors put it forward as true.
- Checkable: passes — It can be checked against evidence.
- Load-bearing: passes — The paper’s conclusions depend on it.
- Based: passes — The paper gives a reason why it holds.
It may state two separate claims as one.
In the paper
“The Olig1 and Olig2 genes encode bHLH transcription factors involved in differentiation along the oligodendrocyte lineage (Zhou et al. 2000).”
§ YY1 and CTCF orchestrate a 3D chromatin looping switch during early neural lineage commitment > Results > YY1-mediated developmentally regulated looping interactions are often nested within a larger framework mediated by constitutive CTCF
What the sources say
- Not checked yetcites Zhou et al. 2000
plaincorrelational- Asserted: passes — The authors put it forward as true.
- Checkable: passes — It can be checked against evidence.
- Load-bearing: fails — The paper’s conclusions may not depend on it.
- Based: passes — The paper gives a reason why it holds.
Probably not a substantial claim. The paper’s conclusions may not depend on it.
In the paper
“(2) it is necessary for the formation of specific 3D interactions in B cells (Medvedovic et al. 2013);”
§ YY1 and CTCF orchestrate a 3D chromatin looping switch during early neural lineage commitment > Discussion
What the sources say
- Not checked yetcites Medvedovic et al. 2013
plaindirect- Asserted: passes — The authors put it forward as true.
- Checkable: passes — It can be checked against evidence.
- Load-bearing: fails — The paper’s conclusions may not depend on it.
- Based: passes — The paper gives a reason why it holds.
Probably not a substantial claim. The paper’s conclusions may not depend on it.
None of the sources cited for this claim have been checked yet.
In the paper
“in which cells have consistently been found to exhibit an extreme state of hypomethylation across the genome (Ficz et al. 2013; Habibi et al. 2013; Leitch et al. 2013).”
§ YY1 and CTCF orchestrate a 3D chromatin looping switch during early neural lineage commitment > Discussion
What the sources say
- Not checked yetcites Ficz et al. 2013
- Not checked yetcites Habibi et al. 2013
- Not checked yetcites Leitch et al. 2013
boosted- Asserted: passes — The authors put it forward as true.
- Checkable: passes — It can be checked against evidence.
- Load-bearing: passes — The paper’s conclusions depend on it.
- Based: passes — The paper gives a reason why it holds.
Probably not a substantial claim.
A conclusion the paper draws from its own results — it cites no other source for it, so there is none to check. The quote shows it is in the paper.
In the paper
“Thus we posit that architectural proteins such as YY1 might cooperatively build upon a constitutive CTCF architectural “seed” scaffold to connect nearby developmentally regulated genes and enhancers.”
§ YY1 and CTCF orchestrate a 3D chromatin looping switch during early neural lineage commitment > Discussion
hedgedconditional- Asserted: passes — The authors put it forward as true.
- Checkable: passes — It can be checked against evidence.
- Load-bearing: passes — The paper’s conclusions depend on it.
- Based: fails — The paper may give no reason why it holds.
Probably not a substantial claim. The paper may give no reason why it holds.
A conclusion the paper draws from its own results — it cites no other source for it, so there is none to check. The quote shows it is in the paper.
In the paper
“It is not clear to what extent our observed differences between ES and NPC YY1 are due to (1) an increased reliance by ES cells on CTCF as the primary architectural protein; (2) different ChIP methods between the ES and NPC YY1 data sets (Supplemental Methods); or (3) a different regulatory role for YY1 in the two cell types.”
§ YY1 and CTCF orchestrate a 3D chromatin looping switch during early neural lineage commitment > Results > YY1 binding is enriched at looping interactions connecting NPC-specific genes and distal regulatory elements
hedged- Asserted: passes — The authors put it forward as true.
- Checkable: passes — It can be checked against evidence.
- Load-bearing: passes — The paper’s conclusions depend on it.
- Based: passes — The paper gives a reason why it holds.
Probably not a substantial claim.
A conclusion the paper draws from its own results — it cites no other source for it, so there is none to check. The quote shows it is in the paper.
In the paper
“Thus, although our data indicate that YY1 might be important for developmentally regulated looping in somatic cells, we cannot conclusively define or rule out any role for YY1 in mediating loops in ES cells.”
§ YY1 and CTCF orchestrate a 3D chromatin looping switch during early neural lineage commitment > Results > YY1 binding is enriched at looping interactions connecting NPC-specific genes and distal regulatory elements
hedged- Asserted: passes — The authors put it forward as true.
- Checkable: passes — It can be checked against evidence.
- Load-bearing: passes — The paper’s conclusions depend on it.
- Based: passes — The paper gives a reason why it holds.
It may state two separate claims as one.
In the paper
“Previous studies have shown that the REPO domain of YY1 physically interacts with cohesin (Pan et al. 2013).”
§ YY1 and CTCF orchestrate a 3D chromatin looping switch during early neural lineage commitment > Discussion
What the sources say
- Not checked yetcites Pan et al. 2013
plaincorrelational- Asserted: passes — The authors put it forward as true.
- Checkable: passes — It can be checked against evidence.
- Load-bearing: fails — The paper’s conclusions may not depend on it.
- Based: passes — The paper gives a reason why it holds.
Probably not a substantial claim. The paper’s conclusions may not depend on it.
In the paper
“Furthermore, a recent genomics analysis showed that up to 30% of YY1 sites bind at locations directly adjacent to CTCF and might work together to cooperatively influence occupancy (Schwalie et al. 2013).”
§ YY1 and CTCF orchestrate a 3D chromatin looping switch during early neural lineage commitment > Discussion
What the sources say
- Not checked yetcites Schwalie et al. 2013
hedgedconditional- Asserted: passes — The authors put it forward as true.
- Checkable: passes — It can be checked against evidence.
- Load-bearing: fails — The paper’s conclusions may not depend on it.
- Based: passes — The paper gives a reason why it holds.
Probably not a substantial claim. The paper’s conclusions may not depend on it. It may state two separate claims as one.
In the paper
“5C primer biases were corrected by adapting and modifying the Express matrix balancing algorithm (Sauria et al. 2015).”
§ YY1 and CTCF orchestrate a 3D chromatin looping switch during early neural lineage commitment > Methods > 5C analyses
What the sources say
- Not checked yetcites Sauria et al. 2015
plaindirect- Asserted: passes — The authors put it forward as true.
- Checkable: passes — It can be checked against evidence.
- Load-bearing: fails — The paper’s conclusions may not depend on it.
- Based: passes — The paper gives a reason why it holds.
Probably not a substantial claim. The paper’s conclusions may not depend on it.
In the paper
“In agreement with this idea, Ruan and colleagues reported evidence that CTCF-mediated looping interactions might function to coordinate nearby interactions involving RNA Pol II (Tang et al. 2015).”
§ YY1 and CTCF orchestrate a 3D chromatin looping switch during early neural lineage commitment > Discussion
What the sources say
- Not checked yetcites Tang et al. 2015
hedgedconditional- Asserted: passes — The authors put it forward as true.
- Checkable: passes — It can be checked against evidence.
- Load-bearing: fails — The paper’s conclusions may not depend on it.
- Based: passes — The paper gives a reason why it holds.
Probably not a substantial claim. The paper’s conclusions may not depend on it.
None of the sources cited for this claim have been checked yet.
In the paper
“Marko, Mirny, Lieberman-Aiden and colleagues have posited that a chromatin molecular motor, such as cohesin/condensin, might extrude chromatin until blocked by architectural proteins, resulting in looped out chromatin (Alipour and Marko 2012; Sanborn et al. 2015; Fudenberg et al. 2016).”
§ YY1 and CTCF orchestrate a 3D chromatin looping switch during early neural lineage commitment > Discussion
What the sources say
- Not checked yetcites Alipour and Marko 2012
- Not checked yetcites Sanborn et al. 2015
- Not checked yetcites Fudenberg et al. 2016
hedgedconditional- Asserted: passes — The authors put it forward as true.
- Checkable: passes — It can be checked against evidence.
- Load-bearing: fails — The paper’s conclusions may not depend on it.
- Based: passes — The paper gives a reason why it holds.
Probably not a substantial claim. The paper’s conclusions may not depend on it.
None of the sources cited for this claim have been checked yet.
In the paper
“Recent reports suggest that the largest rearrangement of DNA methylation during neural development occurs upon the departure from pluripotency (Ziller et al. 2015; Sharma et al. 2016).”
§ YY1 and CTCF orchestrate a 3D chromatin looping switch during early neural lineage commitment > Discussion
What the sources say
- Not checked yetcites Ziller et al. 2015
- Not checked yetcites Sharma et al. 2016
hedgedcorrelational- Asserted: passes — The authors put it forward as true.
- Checkable: passes — It can be checked against evidence.
- Load-bearing: passes — The paper’s conclusions depend on it.
- Based: passes — The paper gives a reason why it holds.
Probably not a substantial claim.
None of the sources cited for this claim have been checked yet.
In the paper
“Seminal genome-wide CTCF occupancy studies based on two to three cell types initially suggested that the CTCF binding landscape remains largely unchanged across mammalian lineages (Kim et al. 2007; Cuddapah et al. 2009).”
§ YY1 and CTCF orchestrate a 3D chromatin looping switch during early neural lineage commitment > Discussion
What the sources say
- Not checked yetcites Kim et al. 2007
- Not checked yetcites Cuddapah et al. 2009
hedged- Asserted: passes — The authors put it forward as true.
- Checkable: passes — It can be checked against evidence.
- Load-bearing: fails — The paper’s conclusions may not depend on it.
- Based: passes — The paper gives a reason why it holds.
Probably not a substantial claim. The paper’s conclusions may not depend on it.
In the paper
“DNA methylation is a critical regulator of neural lineage commitment (Meissner et al. 2008) and CTCF binding (Renda et al. 2007).”
§ YY1 and CTCF orchestrate a 3D chromatin looping switch during early neural lineage commitment > Discussion
What the sources say
- Not checked yetcites Meissner et al. 2008
plaindirect- Asserted: passes — The authors put it forward as true.
- Checkable: passes — It can be checked against evidence.
- Load-bearing: passes — The paper’s conclusions depend on it.
- Based: passes — The paper gives a reason why it holds.
Probably not a substantial claim.
In the paper
“(3) it can connect a long-range interaction in B cells in the absence of its transcriptional activation domain (Mehra et al. 2016);”
§ YY1 and CTCF orchestrate a 3D chromatin looping switch during early neural lineage commitment > Discussion
What the sources say
- Not checked yetcites Mehra et al. 2016
plaindirect- Asserted: passes — The authors put it forward as true.
- Checkable: passes — It can be checked against evidence.
- Load-bearing: fails — The paper’s conclusions may not depend on it.
- Based: passes — The paper gives a reason why it holds.
Probably not a substantial claim. The paper’s conclusions may not depend on it.
In the paper
“Biochemical studies have indicated that the zinc fingers of YY1 may interact with the N terminus of CTCF (Donohoe et al. 2007), suggesting that YY1 could anchor loops via homodimerization (Supplemental Fig. 16A) or heterodimerization (Supplemental Fig. 16B) mechanisms.”
§ YY1 and CTCF orchestrate a 3D chromatin looping switch during early neural lineage commitment > Discussion
What the sources say
- Not checked yetcites Donohoe et al. 2007
hedgedconditional- Asserted: passes — The authors put it forward as true.
- Checkable: passes — It can be checked against evidence.
- Load-bearing: fails — The paper’s conclusions may not depend on it.
- Based: passes — The paper gives a reason why it holds.
Probably not a substantial claim. The paper’s conclusions may not depend on it.
None of the sources cited for this claim have been checked yet.
In the paper
“A leading hypothesis is that sub-TAD/TAD boundaries, anchored by constitutive CTCF, might constrain developmentally regulated enhancers from aberrantly looping to off-target genes (Dowen et al. 2014; Symmons et al. 2014; Lupiáñez et al. 2015; Flavahan et al. 2016; Hnisz et al. 2016).”
§ YY1 and CTCF orchestrate a 3D chromatin looping switch during early neural lineage commitment > Discussion
What the sources say
- Not checked yetcites Dowen et al. 2014
- Not checked yetcites Symmons et al. 2014
- Not checked yetcites Lupiáñez et al. 2015
hedgedconditional- Asserted: fails — The authors may not put it forward as true.
- Checkable: passes — It can be checked against evidence.
- Load-bearing: passes — The paper’s conclusions depend on it.
- Based: passes — The paper gives a reason why it holds.
Probably not a substantial claim. The authors may not put it forward as true.
None of the sources cited for this claim have been checked yet.
In the paper
“We and others have previously reported that pluripotency genes connect to enhancers in smaller looping interactions nested within larger constitutive structures (Phillips-Cremins et al. 2013; Dowen et al. 2014).”
§ YY1 and CTCF orchestrate a 3D chromatin looping switch during early neural lineage commitment > Discussion
What the sources say
- Not checked yetcites Phillips-Cremins et al. 2013
- Not checked yetcites Dowen et al. 2014
plaincorrelational- Asserted: passes — The authors put it forward as true.
- Checkable: passes — It can be checked against evidence.
- Load-bearing: passes — The paper’s conclusions depend on it.
- Based: passes — The paper gives a reason why it holds.
Probably not a substantial claim.
In the paper
“A more recent comparison of CTCF occupancy across 40 cell types revealed that at least 80% of CTCF sites are dynamic across cellular states (Maurano et al. 2015).”
§ YY1 and CTCF orchestrate a 3D chromatin looping switch during early neural lineage commitment > Discussion
What the sources say
- Not checked yetcites Maurano et al. 2015
plaincorrelational- Asserted: passes — The authors put it forward as true.
- Checkable: passes — It can be checked against evidence.
- Load-bearing: fails — The paper’s conclusions may not depend on it.
- Based: passes — The paper gives a reason why it holds.
Probably not a substantial claim. The paper’s conclusions may not depend on it.
In the paper
“(4) it is required for proper neural development (He et al. 2007).”
§ YY1 and CTCF orchestrate a 3D chromatin looping switch during early neural lineage commitment > Discussion
What the sources say
- Not checked yetcites He et al. 2007
plaindirect- Asserted: passes — The authors put it forward as true.
- Checkable: passes — It can be checked against evidence.
- Load-bearing: fails — The paper’s conclusions may not depend on it.
- Based: passes — The paper gives a reason why it holds.
Probably not a substantial claim. The paper’s conclusions may not depend on it.
What the paper did — it cites no source for this, so there is none to check. The quote shows it is in the paper.
In the paper
“To facilitate the comparison of ChIP-seq libraries across cell types, the mapped reads were filtered to remove optical and PCR duplicates and then down-sampled to equivalent read numbers across cellular states.”
§ YY1 and CTCF orchestrate a 3D chromatin looping switch during early neural lineage commitment > Methods > ChIP-seq peak calling
plaindirect- Asserted: passes — The authors put it forward as true.
- Checkable: passes — It can be checked against evidence.
- Load-bearing: passes — The paper’s conclusions depend on it.
- Based: passes — The paper gives a reason why it holds.
Probably not a substantial claim.
In the paper
“Binned 5C counts were normalized for the expected background interaction frequency with local “donut” and “lower left” filters (Rao et al. 2014) as detailed in the Supplemental Methods.”
§ YY1 and CTCF orchestrate a 3D chromatin looping switch during early neural lineage commitment > Methods > 5C analyses
What the sources say
- Not checked yetcites Rao et al. 2014
plain- Asserted: passes — The authors put it forward as true.
- Checkable: passes — It can be checked against evidence.
- Load-bearing: passes — The paper’s conclusions depend on it.
- Based: passes — The paper gives a reason why it holds.
Probably not a substantial claim.
What the paper did — it cites no source for this, so there is none to check. The quote shows it is in the paper.
In the paper
“Background-corrected interaction frequencies for each independent replicate and region were fitted with a logistic distribution, and P-values were assigned to each bin–bin pair.”
§ YY1 and CTCF orchestrate a 3D chromatin looping switch during early neural lineage commitment > Methods > 5C analyses
plain- Asserted: passes — The authors put it forward as true.
- Checkable: passes — It can be checked against evidence.
- Load-bearing: passes — The paper’s conclusions depend on it.
- Based: passes — The paper gives a reason why it holds.
Probably not a substantial claim. It may state two separate claims as one.
The paper relies on this without support.
The 5C interrogated regions are representative of genome-wide 3D chromatin architecture.
“We generated fine-scale chromatin architecture maps (∼4- to12-kb matrix resolution) across >7 Mb of the mouse genome surrounding key developmentally regulated genes with Chromosome-Conformation-Capture-Carbon-Copy (5C) and high-throughput sequencing.”
The paper relies on this without support.
Putative NPC-specific enhancers are bona fide regulatory enhancers.
“we parsed our putative genome-wide NPC-specific enhancers (Supplemental Methods) into those that engage in “NPC-only” loops (Fig. 5F) and those that do not participate in long-range interactions (Fig. 5G).”
The paper relies on this without support.
CTCF binding is anti-correlated with DNA methylation.
“Because CTCF binding is anti-correlated with DNA methylation, we posit that a notable proportion of the large class (n = ∼20,000) of “2i+serum” CTCF sites might be methylated during the initial establishment of the neural lineage and subsequently remain methylated and unbound through terminal differentiation in the developing/maturing brain.”
The paper relies on this without support.
The putative NPC-specific enhancers marked by H3K27ac are functional enhancers that regulate the associated genes.
“In NPCs, putative enhancer(s) marked by NPC-specific H3K27ac connect to both Olig1 and Olig2 in a rosette-like structure, and these genes show markedly increased expression in NPCs compared to ES 2i/ES serum (Fig. 6B–D, magenta arrows).”
The paper relies on this without support.
The Yy1-targeting siRNA specifically reduces YY1 without off-target effects.
“Transfection of the Yy1-targeting siRNA pool produced a >50% decrease in Yy1 expression and protein levels compared to a control nontargeting pool condition (Fig. 7A,B).”
Claims other papers make about this one
Each is checked against this paper’s own text: does it say what the citing paper says it does?
The source backs part of the claim, not all of it — or backs it for a different population, condition or comparison.
In the citing paper
“Recent studies have confirmed its global role in connecting cell type-specific active enhancers and promoters in a range of mammalian cell types including mESCs [295] and neural progenitor cells [365].”
From Transcriptional enhancers and their communication with gene promoters (2021) · cites this paper as [365]
Experimental — accuracy not yet measuredThe source backs part of the claim, not all of it — or backs it for a different population, condition or comparison.
In the citing paper
“YY1 and ZNF143 are both zinc finger TFs with DNA binding domains that have recently been implicated as looping factors mediating interactions between active regulatory elements [295, 362–365].”
From Transcriptional enhancers and their communication with gene promoters (2021) · cites this paper as [365]
Experimental — accuracy not yet measuredIn the citing paper
“No statistical methods were used to pre-determine sample sizes but our sample sizes are similar to those reported in previous publications17,27,28.”
From Three-dimensional genome restructuring across timescales of activity-induced neuronal gene expression (2020) · cites this paper as [27]
Self-check
Percentages, sums and reported differences re-computed from the paper’s own numbers.
Each contradiction between two passages listed here was confirmed by an independent check.
Rated minor: it would not touch a result — a value no result rests on, a p-value that stays on the same side of the significance level, or a conflict that is clerical, resolved elsewhere in the paper, or outside its own findings.
In the paper
§ YY1 and CTCF orchestrate a 3D chromatin looping switch during early neural lineage commitment > Results > Yy1 knockdown results in the loss of key NPC enhancer to gene looping interactions
“We also observed loop ablation upon Yy1 knockout at interactions between the Klf4 gene and a downstream putative NPC-enhancer”
§ YY1 and CTCF orchestrate a 3D chromatin looping switch during early neural lineage commitment > Results > Yy1 knockdown results in the loss of key NPC enhancer to gene looping interactions
“We performed Yy1 knockdown using an siRNA pool purchased from Dharmacon (Supplemental Methods) to target multiple sites along the Yy1 transcript.”
Citations
Cites
Ultrafast and memory-efficient alignment of short DNA sequences to the human genome.
Langmead, B., Trapnell, C., Pop, M., & Salzberg, S. L. (2009) · Genome Biology · doi:10.1186/gb-2009-10-3-r25 · Cited by 21,849 · cited 1×
“Reads were aligned to mouse genome build mm9 using Bowtie with default mismatch parameters (Langmead et al. 2009).”
Model-based Analysis of ChIP-Seq (MACS)
Zhang, Y., Liu, T., Meyer, C. A., Eeckhoute, J., Johnson, D. S., Bernstein, B. E., Nusbaum, C., Myers, R. M., Brown, M., Li, W., et al. (2008) · Genome Biology · doi:10.1186/gb-2008-9-9-r137 · Cited by 18,386 · cited 1×
“0 (MACS2 [Zhang et al. 2008]).”
A 3D Map of the Human Genome at Kilobase Resolution Reveals Principles of Chromatin Looping
Rao, S. S. P., Huntley, M. H., Durand, N. C., Stamenova, E. K., Bochkov, I. D., Robinson, J. T., Sanborn, A. L., Machol, I., Omer, A. D., Lander, E. S., et al. (2014) · Cell · doi:10.1016/j.cell.2014.11.021 · Cited by 9,212 · cited 9×
“Looping interactions can be detected in 5C heatmaps as concentrated points of high interaction frequency compared to the surrounding localbackground (Rao et al. 2014).”
InfluentialComprehensive Mapping of Long-Range Interactions Reveals Folding Principles of the Human Genome
Lieberman-Aiden, E., van Berkum, N. L., Williams, L., Imakaev, M., Ragoczy, T., Telling, A., Amit, I., Lajoie, B. R., Sabo, P. J., Dorschner, M. O., et al. (2009) · Science · doi:10.1126/science.1181369 · Cited by 8,898 · cited 1×
“Within individual chromosomes, open chromatin and active genes tend to spatially cluster into “ A ” compartments, whereas closed, inactive chromatin spatially segregates into “ B ” compartments (Lieberman-Aiden et al. 2009; Rao et al. 2014).”
Topological domains in mammalian genomes identified by analysis of chromatin interactions
Dixon, J. R., Selvaraj, S., Yue, F., Kim, A., Li, Y., Shen, Y., Hu, M., Liu, J. S., & Ren, B. (2012) · Nature · doi:10.1038/nature11082 · Cited by 6,829 · cited 9×
“Thus, the emerging model is that mammalian genomes are arranged into a nested hierarchy of unique structural features, ofwhichthefiner,sub-megabasescaleconfigurations withinTADs are critical for the proper activation and inactivation of genes during development.”
InfluentialThe ground state of embryonic stem cell self-renewal
Ying, Q.-L., Wray, J., Nichols, J., Batlle-Morera, L., Doble, B., Woodgett, J., Cohen, P., & Smith, A. (2008) · Nature · doi:10.1038/nature06968 · Cited by 3,442 · cited 2×
“We used well-established cellular models of early neural lineage commitment: (1) mouse embryonic stem (ES) cells cultured in GSK3/MEK inhibitors (“2i” conditions) representing a state of naïve pluripotency from the earliest stages of a preimplantation embryo (Ying et al. 2008);”
CNS stem cells express a new class of intermediate filament protein
Lendahl, U., Zimmerman, L. B., & McKay, R. D. G. (1990) · Cell · doi:10.1016/0092-8674(90)90662-x · Cited by 3,164 · cited 2×
“Since its discovery, the Nes genehasbeenawidelyreferencedmarkerofproliferatingNPCs (Lendahl et al. 1990; Park et al. 2010).”
Spatial partitioning of the regulatory landscape of the X-inactivation centre
Nora, E. P., Lajoie, B. R., Schulz, E. G., Giorgetti, L., Okamoto, I., Servant, N., Piolot, T., van Berkum, N. L., Meisig, J., Sedat, J., et al. (2012) · Nature · doi:10.1038/nature11049 · Cited by 2,895 · cited 2×
“CTCF is also enriched at the boundaries of TADs (Dixon et al. 2012; Nora et al. 2012), and deletion or inversion of these motifs can perturb domain boundaries and disrupt nearby gene expression (Dowen et al. 2014; de Wit et al. 2015; Guo et al. 2015; Lupiáñez et al. 2015; Narendra et al. 2015;…”
Chen, X., Han, X., Yuan, P., Fang, F., Huss, M., Vega, V. B., Wong, E., Orlov, Y. L., Zhang, W., Jiang, J., et al. (2008) · Cell · doi:10.1016/j.cell.2008.04.043 · Cited by 2,547 · cited 2×
“across more than 100 mammalian cell types (Kim et al. 2007; Chen et al. 2008; Cuddapah et al. 2009; Wang et al. 2012; Maurano et al. 2015).”
Genome-scale DNA methylation maps of pluripotent and differentiated cells
Meissner, A., Mikkelsen, T. S., Gu, H., Wernig, M., Hanna, J., Sivachenko, A., Zhang, X., Bernstein, B. E., Nusbaum, C., Jaffe, D. B., et al. (2008) · Nature · doi:10.1038/nature07107 · Cited by 2,536 · cited 2×
“DNAmethylation is a critical regulator of neural lineage commitment (Meissner et al. 2008) and CTCF binding (Renda et al.”
Cited by
Sorted by citations
Organizational principles of 3D genome architecture
Rowley, M. J., & Corces, V. G. (2018) · Nature Reviews Genetics · doi:10.1038/s41576-018-0060-8 · Cited by 1,171
Long-range enhancer–promoter contacts in gene expression control
Schoenfelder, S., & Fraser, P. (2019) · Nature Reviews Genetics · doi:10.1038/s41576-019-0128-0 · Cited by 1,102
YY1 Is a Structural Regulator of Enhancer-Promoter Loops
Weintraub, A. S., Li, C. H., Zamudio, A. V., Sigova, A. A., Hannett, N. M., Day, D. S., Abraham, B. J., Cohen, M. A., Nabet, B., Buckley, D. L., et al. (2017) · Cell · doi:10.1016/j.cell.2017.11.008 · Cited by 992
“As this manuscript was completed, a paper appeared reporting that YY1 is present at the base of interactions between neuronal precursor cell-specific enhancers and genes and that YY1 knockdown causes a loss of these interactions (Beagan et al., 2017).”
Resolving the 3D Landscape of Transcription-Linked Mammalian Chromatin Folding
Hsieh, T.-H. S., Cattoglio, C., Slobodyanyuk, E., Hansen, A. S., Rando, O. J., Tjian, R., & Darzacq, X. (2020) · Molecular Cell · doi:10.1016/j.molcel.2020.03.002 · Cited by 661
Hsieh, T.-H. S., Cattoglio, C., Slobodyanyuk, E., Hansen, A. S., Darzacq, X., & Tjian, R. (2022) · Nature Genetics · doi:10.1038/s41588-022-01223-8 · Cited by 406
Metadata
- Authors
- Beagan, J. A., Duong, M. T., Titus, K. R., Zhou, L., Cao, Z., Ma, J., Lachanski, C. V., Gillis, D. R., & Phillips-Cremins, J. E.
- Affiliations
- University of Pennsylvania (US)
- Venue
- Genome Research
- Publisher
- Cold Spring Harbor Laboratory
- Published
- 2017-05-23
- Volume
- 27
- Issue
- 7
- Pages
- 1139-1152
- ISSN
- 1088-9051 (ISSN-L)
- 1549-5469
- PMC
- PMC5495066
- OpenAlex
- W2616964127
- Semantic Scholar
- ef47c2402c2ca8c046dfd6f1c16e7268ea95d80a
- Cited by
- 299
- References
- 66
- Citations by year
- 2026: 19 · 2025: 32 · 2024: 24 · 2023: 33 · 2022: 36 · 2021: 46 · 2020: 38 · 2019: 30 · 2018: 36 · 2017: 5
- Type
- posted content
- Language
- en
- Open access
- green
- www.ncbi.nlm.nih.gov
- Licence
- cc-by-nc
- Locations
- Genome Research (publishedVersion)
- PubMed Central (publishedVersion, cc-by-nc)
- PubMed (publishedVersion)
- HighWire Press Open Archive (submittedVersion)
- Funders
- The New York Stem Cell Foundation
- Alfred P. Sloan Foundation
- NIH Director's New Innovator Award from the National Institute of Mental Health (1DP2MH11024701)
- 4D Nucleome (NIH) Common (1U01HL12999801)
- NSF-NIGMS (1562665)
- National Science Foundation (DGE-1321851)
- Topics
- Life Sciences › Biochemistry, Genetics and Molecular Biology › Molecular Biology › Genomics and Chromatin Dynamics
- Life Sciences › Biochemistry, Genetics and Molecular Biology › Molecular Biology › Chromatin Remodeling and Cancer
- Life Sciences › Biochemistry, Genetics and Molecular Biology › Molecular Biology › Pluripotent Stem Cells Research
- Keywords
- CTCF, YY1, neural progenitor cells, enhancer-promoter interactions, chromatin structure, pluripotency, zinc finger proteins, chromatin looping
- MeSH terms
- Human Embryonic Stem Cells, CCCTC-Binding Factor, Cell Differentiation, Cell Line, Chromatin, Enhancer Elements, Genetic, Humans, Chromatin Assembly and Disassembly, YY1 Transcription Factor, Genome-Wide Association Study, Neural Stem Cells
About these checks
Registry, retraction, Cites and statistics results are computed, not judged, with one exception: a printed reference that no index lists is read once by a model before it counts as a citation error. Claims are extracted by a model and kept only when their quote appears verbatim in the text; each cited source is then checked, with a model’s help, for whether it says what the claim relies on. Those verdicts can be wrong — read the claim’s quote and the cited source before relying on one.
A language model drew the claims from the paper on 2026-10-10, under version 3 of the claim definition (model deepseek-v4.1-flash, prompt extract-v3).
A second model labelled each claim on 2026-10-10 (model jev-1.13-20260917, definition revision gold-guideline-v0.2).
Statistics and arithmetic are recomputed, not judged.
Confidence bands are shown only for fields calibrated on our annotated test set. None is calibrated yet, so no band is shown.
What counts as a claim ›How we measure confidence ›How we check this ›
Are you an author, or do you see a problem with this page? Request a review
