Cited by 14Enzyme Structure and FunctionX-ray Diffraction in CrystallographyCrystal structures of chemical compounds

The DOI matches its Crossref record; 2 of the 2 references it cites were found in a registry or an index.

Elucidating polymorphs of crystal structures by intensity-based hierarchical clustering analysis of multiple diffraction data sets

Open access

Published version of a preprint

Abstract

In macromolecular structure determination using X-ray diffraction from multiple crystals, the presence of different structures (structural polymorphs) necessitates the classification of the diffraction data for appropriate structural analysis. Hierarchical clustering analysis (HCA) is a promising technique that has so far been used to extract isomorphous data, mainly for single-structure determination. Although in principle the use of HCA can be extended to detect polymorphs, the absence of a reference to define the threshold used to group the isomorphous data sets (the `isomorphic threshold') poses a challenge. Here, unit-cell-based and intensity-based HCAs have been applied to data sets for apo trypsin and inhibitor-bound trypsin that were mixed post data acquisition to investigate the efficacy of HCA in classifying polymorphous data sets. Single-step intensity-based HCA successfully classified polymorphs with a certain `isomorphic threshold'. In data sets for several samples containing an unknown degree of structural heterogeneity, polymorphs could be identified by intensity-based HCA using the suggested `isomorphic threshold'. Polymorphs were also detected in single crystals using data collected using the continuous helical scheme. These findings are expected to facilitate the determination of multiple structural snapshots by exploiting automated data collection and analysis.

Overview

The claims and statistics of this paper haven’t been checked yet.

Run the check — free, no account needed. It reads the open-access text and checks the sources it cites.

A few free checks a day · papers already verified open instantly · results are public

Integrity signals

Registry

Crossref · 10.1107/s2059798323007039

Cites

2 of 2 references verified0 citation errors · 0 not checkable

Statistics

Figures

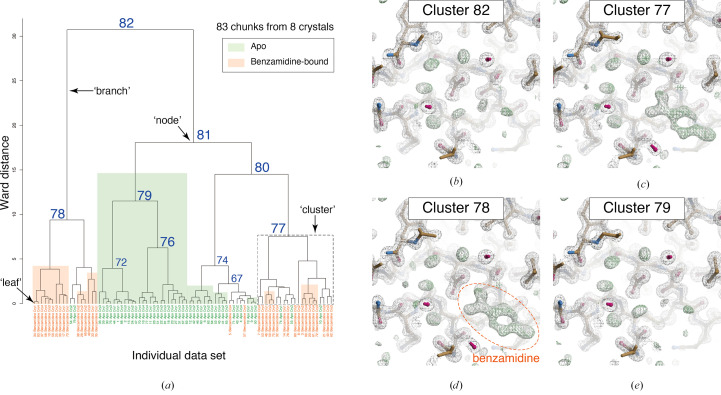
Figure 1 Results of unit-cell-based HCA of in silico mixed data sets containing apo and benzamidine-bound trypsin. (a) Resultant dendrogram. The definitions of ‘node’, ‘branch’ and ‘cluster’ used in this study are illustrated in the dendrogram. Cluster numbers and data labels are depicted on the resultant dendrogram from unit-cell-based HCA. The blue numbers indicate the cluster numbers at each node. Chunks for apo trypsin are shaded green and those for benzamidine-bound trypsin are colored orange. (b)–(e) Electron-density maps around the inhibitor-binding site of trypsin in different clusters. The contour level of the 2F o − F c map (gray mesh) is 1.0σ and that of the F o − F c map (green mesh) is 3.0σ. The maps were generated by Coot in the NABE system.
Figure 1 Results of unit-cell-based HCA of in silico mixed data sets containing apo and benzamidine-bound trypsin. (a) Resultant dendrogram. The definitions of ‘node’, ‘branch’ and ‘cluster’ used in this study are illustrated in the dendrogram. Cluster numbers and data labels are depicted on the resultant dendrogram from unit-cell-based HCA. The blue numbers indicate the cluster numbers at each node. Chunks for apo trypsin are shaded green and those for benzamidine-bound trypsin are colored orange. (b)–(e) Electron-density maps around the inhibitor-binding site of trypsin in different clusters. The contour level of the 2F o − F c map (gray mesh) is 1.0σ and that of the F o − F c map (green mesh) is 3.0σ. The maps were generated by Coot in the NABE system.CC BY · PubMed Central
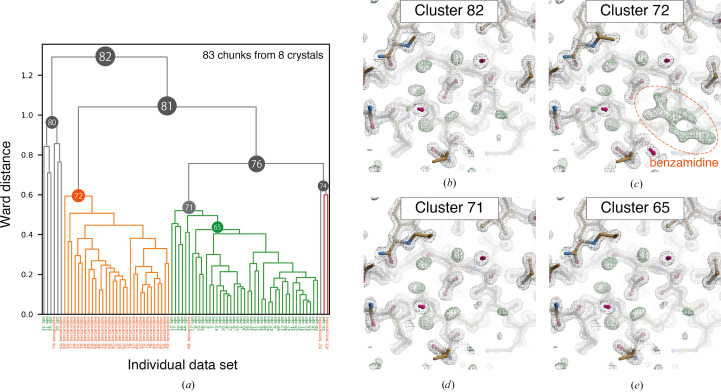
Figure 2 Results of intensity-based HCA on in silico mixed data sets containing apo and benzamidine-bound trypsin. (a) Resultant dendrogram. Data labels are shown at the bottom: green, apo trypsin; orange, benzamidine-bound trypsin. The color threshold for the dendrogram is set to 0.6. (b)–(e) Electron-density maps around the inhibitor-binding site obtained from the merged data in different clusters. The contour levels of the 2F o − F c map (gray mesh) and the F o − F c map (green mesh) are 1.0σ and 3.0σ, respectively. The maps were generated by Coot in the NABE system.
Figure 2 Results of intensity-based HCA on in silico mixed data sets containing apo and benzamidine-bound trypsin. (a) Resultant dendrogram. Data labels are shown at the bottom: green, apo trypsin; orange, benzamidine-bound trypsin. The color threshold for the dendrogram is set to 0.6. (b)–(e) Electron-density maps around the inhibitor-binding site obtained from the merged data in different clusters. The contour levels of the 2F o − F c map (gray mesh) and the F o − F c map (green mesh) are 1.0σ and 3.0σ, respectively. The maps were generated by Coot in the NABE system.CC BY · PubMed Central
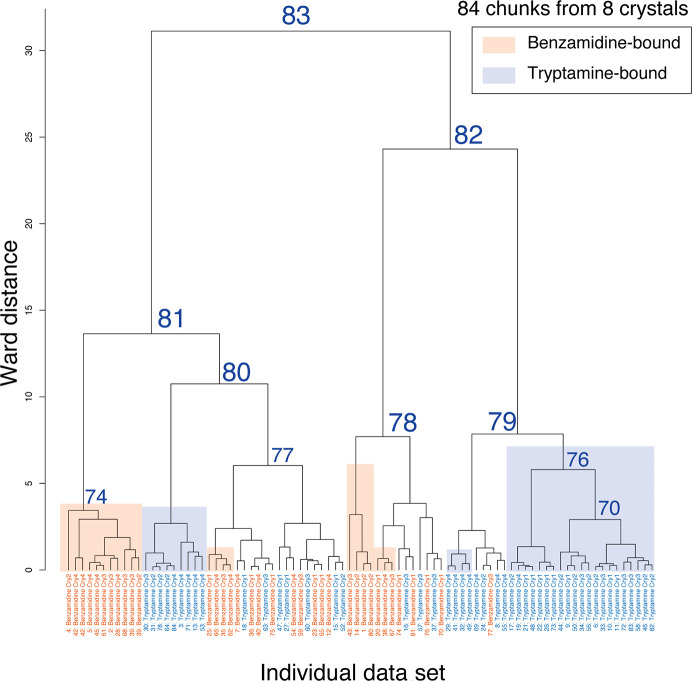
Figure 3 Dendrogram from unit-cell-based clustering of mixed data sets including benzamidine-bound and tryptamine-bound trypsin. Cluster numbers and data labels are depicted on the resultant dendrogram from unit-cell-based HCA. To evaluate the clustering effect, each cluster leaf is shaded according to the original data set: orange, benzamidine-bound trypsin; blue, tryptamine-bound trypsin. The number labeled at each cluster node indicates the cluster number output from BLEND.
Figure 3 Dendrogram from unit-cell-based clustering of mixed data sets including benzamidine-bound and tryptamine-bound trypsin. Cluster numbers and data labels are depicted on the resultant dendrogram from unit-cell-based HCA. To evaluate the clustering effect, each cluster leaf is shaded according to the original data set: orange, benzamidine-bound trypsin; blue, tryptamine-bound trypsin. The number labeled at each cluster node indicates the cluster number output from BLEND.CC BY · PubMed Central
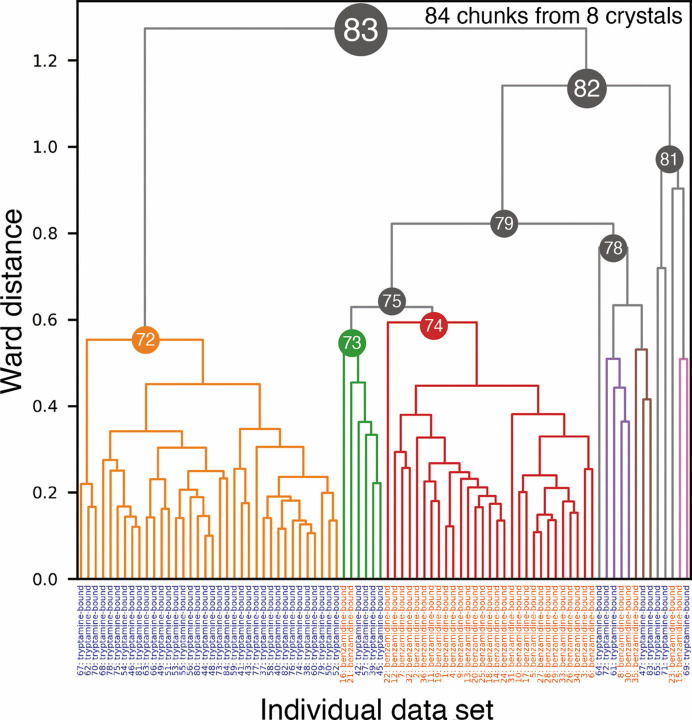
Figure 4 Dendrogram from intensity-based HCA of mixed data sets including benzamidine-bound and tryptamine-bound trypsin. The data labels at the bottom are in orange for benzamidine-bound trypsin and in blue for tryptamine-bound trypsin.
Figure 4 Dendrogram from intensity-based HCA of mixed data sets including benzamidine-bound and tryptamine-bound trypsin. The data labels at the bottom are in orange for benzamidine-bound trypsin and in blue for tryptamine-bound trypsin.CC BY · PubMed Central
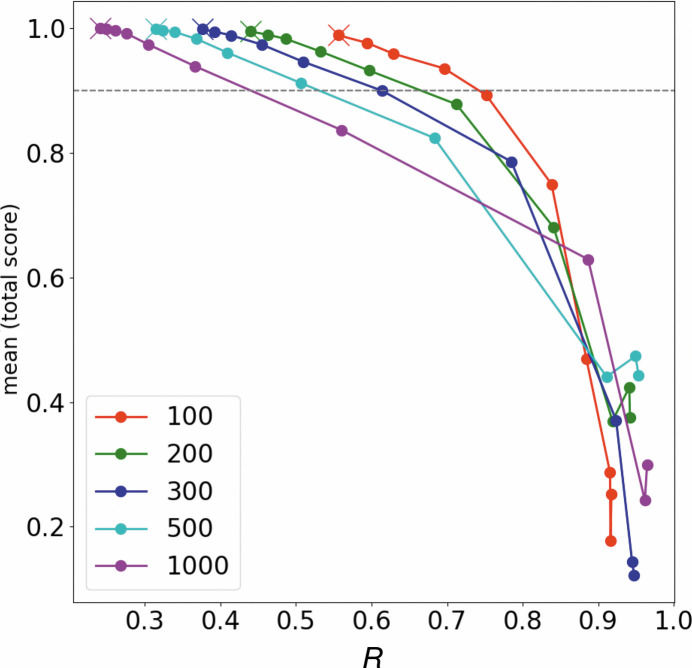
Figure 5 R in equation (1) and classification score in our HCA simulations (details are described in Section 2.4 and Supplementary Section S2). The line plots illustrate the scores assuming 100, 200, 300, 500 and 1000 data sets. The lowest R in each plot is shown as a cross mark and is the result of HCA using the original CC model (Supplementary Fig. S13a ). HCA simulations were performed with the CCapo–benz and CCbenz–benz positions gradually approaching each other in ten steps, making classification more difficult.
Figure 5 R in equation (1) and classification score in our HCA simulations (details are described in Section 2.4 and Supplementary Section S2). The line plots illustrate the scores assuming 100, 200, 300, 500 and 1000 data sets. The lowest R in each plot is shown as a cross mark and is the result of HCA using the original CC model (Supplementary Fig. S13a ). HCA simulations were performed with the CCapo–benz and CCbenz–benz positions gradually approaching each other in ten steps, making classification more difficult.CC BY · PubMed Central
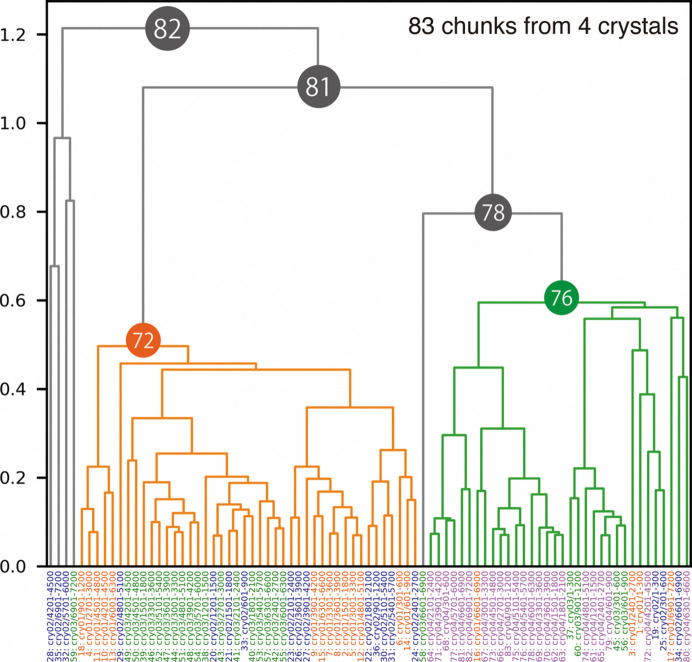
Figure 6 Dendrogram from intensity-based HCA for the Trn1–peptide complex. Data labels are shown at the bottom and are colored by crystals. Clusters 72 and 76 were used for further structural analysis because these two clusters appeared to have different structures (polymorphs).
Figure 6 Dendrogram from intensity-based HCA for the Trn1–peptide complex. Data labels are shown at the bottom and are colored by crystals. Clusters 72 and 76 were used for further structural analysis because these two clusters appeared to have different structures (polymorphs).CC BY · PubMed Central
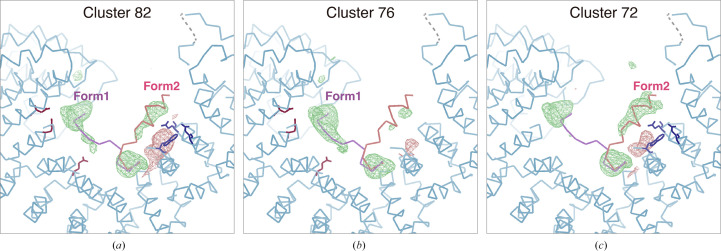
Figure 7 Peptide-omitted F o − F c maps from different nodes resulting from intensity-based HCA for the Trn1–peptide complex. F o − F c maps calculated from merged data at (a) Cluster 82, (b) Cluster 76 and (c) Cluster 72 are depicted. The contour level for each figure is set to 3.0σ. The binding peptide was omitted during map calculation. The figures were generated by Coot.
Figure 7 Peptide-omitted F o − F c maps from different nodes resulting from intensity-based HCA for the Trn1–peptide complex. F o − F c maps calculated from merged data at (a) Cluster 82, (b) Cluster 76 and (c) Cluster 72 are depicted. The contour level for each figure is set to 3.0σ. The binding peptide was omitted during map calculation. The figures were generated by Coot.CC BY · PubMed Central
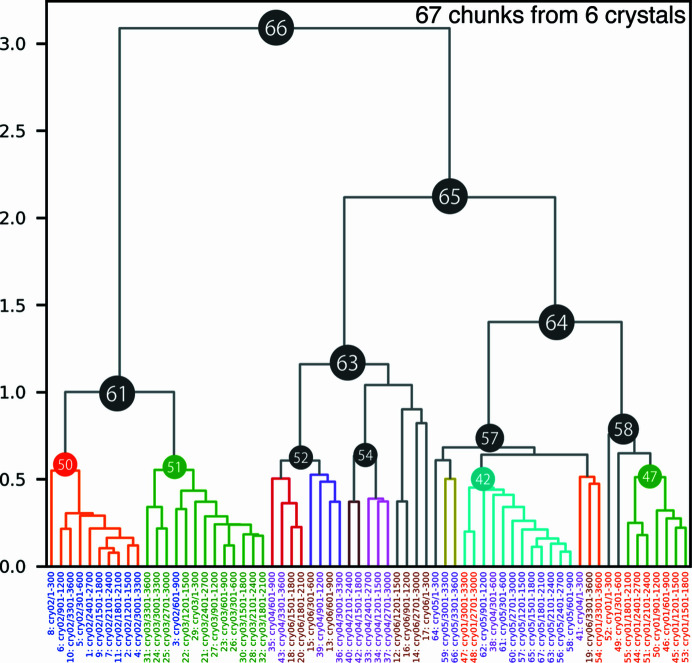
Figure 8 Dendrogram from intensity-based HCA on the AaHypD-C360S variant. Data labels are shown at the bottom, colored by crystals. Due to the significant deviation among the data sets, some clusters were not satisfied with sufficient completeness for further analysis. Accordingly, Clusters 52 and 54 were selected based on the results with a threshold of 0.8. Each data cluster consists of chunks from one or two crystals, indicating that inter-crystal differences are more prominent than intra-crystal differences in AaHypD-C360S.
Figure 8 Dendrogram from intensity-based HCA on the AaHypD-C360S variant. Data labels are shown at the bottom, colored by crystals. Due to the significant deviation among the data sets, some clusters were not satisfied with sufficient completeness for further analysis. Accordingly, Clusters 52 and 54 were selected based on the results with a threshold of 0.8. Each data cluster consists of chunks from one or two crystals, indicating that inter-crystal differences are more prominent than intra-crystal differences in AaHypD-C360S.CC BY · PubMed Central
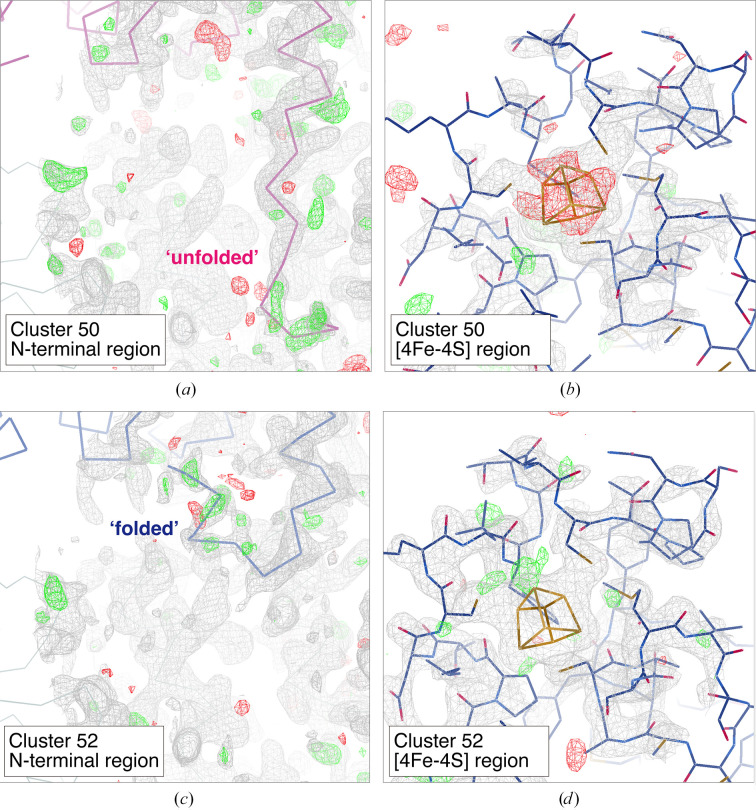
Figure 9 Electron-density maps around the N-terminal region and [4Fe–4S] cluster obtained from merged data at different clusters: (a, b) Cluster 50 and (c, d) Cluster 52. The contour level for the 2F o − F c map (gray mesh) is set to 1.0σ except for the [4Fe–4S] region in Cluster 52, where it is set to 1.5σ. The contour level for the F o − F c map is set to 3.0σ (green mesh, positive; red mesh, negative) in all figures. Only the main chain is depicted in the N-terminal region: ‘unfolded’ (purple) and ‘folded’ (blue). The variable N-terminal region (Ser7–Tyr12) was omitted and the occupancy for the [4Fe–4S] cluster was set to 1.0 in map calculation. The figures were generated by Coot.
Figure 9 Electron-density maps around the N-terminal region and [4Fe–4S] cluster obtained from merged data at different clusters: (a, b) Cluster 50 and (c, d) Cluster 52. The contour level for the 2F o − F c map (gray mesh) is set to 1.0σ except for the [4Fe–4S] region in Cluster 52, where it is set to 1.5σ. The contour level for the F o − F c map is set to 3.0σ (green mesh, positive; red mesh, negative) in all figures. Only the main chain is depicted in the N-terminal region: ‘unfolded’ (purple) and ‘folded’ (blue). The variable N-terminal region (Ser7–Tyr12) was omitted and the occupancy for the [4Fe–4S] cluster was set to 1.0 in map calculation. The figures were generated by Coot.CC BY · PubMed Central
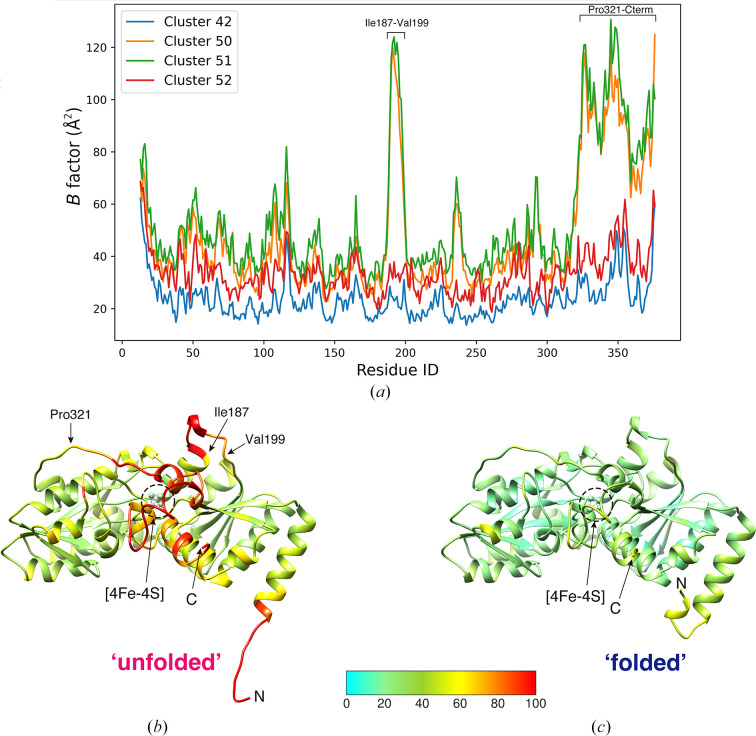
Figure 10 B-factor analysis of AaHypD-C360S structures obtained from different clusters in intensity-based HCA. (a) Plot of the B factors of Cα atoms in data from different clusters. (b, c) Main-chain trace of AaHypD-C360S with an ‘unfolded’ N-terminus obtained from Cluster 50 (b) and with a ‘folded’ N-terminus obtained from Cluster 52 (c). B-factor-based coloring was applied using Coot. The N-terminus and C-terminus are depicted in the figure as ‘N’ and ‘C’, respectively. The structure with the ‘unfolded’ N-terminus showed a significantly high B factor around the [4Fe–4S] cluster. The figures were generated by UCSF Chimera (Pettersen et al., 2004 ▸).
Figure 10 B-factor analysis of AaHypD-C360S structures obtained from different clusters in intensity-based HCA. (a) Plot of the B factors of Cα atoms in data from different clusters. (b, c) Main-chain trace of AaHypD-C360S with an ‘unfolded’ N-terminus obtained from Cluster 50 (b) and with a ‘folded’ N-terminus obtained from Cluster 52 (c). B-factor-based coloring was applied using Coot. The N-terminus and C-terminus are depicted in the figure as ‘N’ and ‘C’, respectively. The structure with the ‘unfolded’ N-terminus showed a significantly high B factor around the [4Fe–4S] cluster. The figures were generated by UCSF Chimera (Pettersen et al., 2004 ▸).CC BY · PubMed Central

Verification

Claims the paper makes

The claims and statistics of this paper haven’t been checked yet.

Run the check — free, no account needed. It reads the open-access text and checks the sources it cites.

A few free checks a day · papers already verified open instantly · results are public

Self-check

Percentages, sums and reported differences re-computed from the paper’s own numbers.

The self-check needs the paper’s full text.

Citations

Cites

Research works printed but not linked: 53

  1. Baba, 2021, J. Synchrotron Rad., 28, 1284, 10.1107/S1600577521008067 · DOI
  2. Baek, 2021, Science, 373, 871, 10.1126/science.abj8754 · DOI · Paper page
  3. Barends, 2022, Nat. Rev. Methods Primers, 2, 60, 10.1038/s43586-022-00141-7 · DOI
  4. Basu, 2019, J. Synchrotron Rad., 26, 244, 10.1107/S1600577518016570 · DOI
  5. Bernstein, 2020, Struct. Dyn., 7, 014302, 10.1063/1.5128498 · DOI
  6. Bowler, 2016, Crystallogr. Rev., 22, 233, 10.1080/0889311X.2016.1155050 · DOI
  7. Casanas, 2016, Acta Cryst. D, 72, 1036, 10.1107/S2059798316012304 · DOI
  8. Cherezov, 2007, Science, 318, 1258, 10.1126/science.1150577 · DOI
  9. Delagenière, 2011, Bioinformatics, 27, 3186, 10.1093/bioinformatics/btr535 · DOI
  10. Emsley, 2010, Acta Cryst. D, 66, 486, 10.1107/S0907444910007493 · DOI · Paper page
  11. Fisher, 2015, J. Appl. Cryst., 48, 927, 10.1107/S1600576715004847 · DOI
  12. Flot, 2010, J. Synchrotron Rad., 17, 107, 10.1107/S0909049509041168 · DOI
  13. Foadi, 2013, Acta Cryst. D, 69, 1617, 10.1107/S0907444913012274 · DOI
  14. Gati, 2014, IUCrJ, 1, 87, 10.1107/S2052252513033939 · DOI
  15. Giordano, 2012, Acta Cryst. D, 68, 649, 10.1107/S0907444912006841 · DOI
  16. Grosse-Kunstleve, 2002, J. Appl. Cryst., 35, 126, 10.1107/S0021889801017824 · DOI
  17. Hasegawa, 2017, J. Synchrotron Rad., 24, 29, 10.1107/S1600577516016362 · DOI
  18. Healey, 2021, Cell Rep. Methods, 1, 100102, 10.1016/j.crmeth.2021.100102 · DOI
  19. Hirata, 2013, J. Phys. Conf. Ser., 425, 012002, 10.1088/1742-6596/425/1/012002 · DOI
  20. Hirata, 2019, Acta Cryst. D, 75, 138, 10.1107/S2059798318017795 · DOI
  21. Incardona, 2009, J. Synchrotron Rad., 16, 872, 10.1107/S0909049509036681 · DOI
  22. Kabsch, 2010, Acta Cryst. D, 66, 125, 10.1107/S0907444909047337 · DOI · Paper page
  23. Katoh, 2020, Nat. Chem., 12, 1081, 10.1038/s41557-020-0525-1 · DOI
  24. Liebschner, 2019, Acta Cryst. D, 75, 861, 10.1107/S2059798319011471 · DOI · Paper page
  25. Martiel, 2020, J. Synchrotron Rad., 27, 860, 10.1107/S1600577520002416 · DOI
  26. McCoy, 2007, J. Appl. Cryst., 40, 658, 10.1107/S0021889807021206 · DOI · Paper page
  27. Merritt, 1997, Methods Enzymol., 277, 505, 10.1016/S0076-6879(97)77028-9 · DOI
  28. Monaco, 2013, J. Appl. Cryst., 46, 804, 10.1107/S0021889813006195 · DOI
  29. Murakami, 2020, Acta Cryst. D, 76, 155, 10.1107/S2059798320000030 · DOI
  30. Muraki, 2019, Commun. Biol., 2, 385, 10.1038/s42003-019-0631-z · DOI
  31. Murshudov, 2011, Acta Cryst. D, 67, 355, 10.1107/S0907444911001314 · DOI
  32. Murtagh, 2014, J. Classif., 31, 274, 10.1007/s00357-014-9161-z · DOI
  33. Nguyen, 2022, Acta Cryst. D, 78, 268, 10.1107/S2059798321013425 · DOI
  34. Nomura, 2021, Proc. Natl Acad. Sci. USA, 118, e2101481118, 10.1073/pnas.2101481118 · DOI
  35. Nurizzo, 2016, Acta Cryst. D, 72, 966, 10.1107/S205979831601158X · DOI
  36. Oide, 2020, FEBS J., 287, 3472, 10.1111/febs.15224 · DOI
  37. Papp, 2017, Acta Cryst. D, 73, 841, 10.1107/S2059798317013596 · DOI
  38. Pettersen, 2004, J. Comput. Chem., 25, 1605, 10.1002/jcc.20084 · DOI
  39. Rosenbaum, 2007, Science, 318, 1266, 10.1126/science.1150609 · DOI
  40. Sanchez-Weatherby, 2019, J. Synchrotron Rad., 26, 291, 10.1107/S1600577518015114 · DOI
  41. Santoni, 2017, J. Appl. Cryst., 50, 1844, 10.1107/S1600576717015229 · DOI
  42. Soares, 2022, Acta Cryst. F, 78, 281, 10.1107/S2053230X22006422 · DOI
  43. Ursby, 2020, J. Synchrotron Rad., 27, 1415, 10.1107/S1600577520008723 · DOI
  44. Virtanen, 2020, Nat. Methods, 17, 261, 10.1038/s41592-019-0686-2 · DOI · Paper page
  45. Vonrhein, 2011, Acta Cryst. D, 67, 293, 10.1107/S0907444911007773 · DOI
  46. Wang, 2022, Acta Cryst. D, 78, 890, 10.1107/S2059798322005745 · DOI
  47. Winter, 2010, J. Appl. Cryst., 43, 186, 10.1107/S0021889809045701 · DOI
  48. Winter, 2011, Methods, 55, 81, 10.1016/j.ymeth.2011.06.010 · DOI
  49. Wojdyr, 2013, Acta Cryst. A, 69, s299, 10.1107/S0108767313097419 · DOI
  50. Yamada, 2013, J. Phys. Conf. Ser., 425, 012017, 10.1088/1742-6596/425/1/012017 · DOI
  51. Yamane, 2011, J. Appl. Cryst., 44, 798, 10.1107/S0021889811017717 · DOI
  52. Yamashita, 2018, Acta Cryst. D, 74, 441, 10.1107/S2059798318004576 · DOI
  53. Zander, 2015, Acta Cryst. D, 71, 2328, 10.1107/S1399004715017927 · DOI

Metadata

Authors
Matsuura, H., Sakai, N., Toma-Fukai, S., Muraki, N., Hayama, K., Kamikubo, H., Aono, S., Kawano, Y., Yamamoto, M., & Hirata, K.
Affiliations
  • SPring-8 (JP)
  • Japan Agency for Medical Research and Development (JP)
  • National Institutes of Natural Sciences (JP)
  • Nara Institute of Science and Technology (JP)
Corresponding author
Hirata, Kunio
Venue
Acta Crystallographica Section D Structural Biology
Published
2023-09-25
Volume
79
Issue
10
Pages
909-924
ISSN
2059-7983 (ISSN-L)
OpenAlex
W4387002666
Cited by
14
References
2
Citations by year
2026: 5 · 2025: 5 · 2024: 4
FWCI
1.03
Type
journal article
Language
en
Open access
Locations
  • Acta Crystallographica Section D Structural Biology (publishedVersion, cc-by)
  • bioRxiv (Cold Spring Harbor Laboratory) (acceptedVersion, cc-by-nc-nd)
  • PubMed Central (publishedVersion, cc-by)
  • PubMed (publishedVersion)
Funders
  • Ministry of Education, Culture, Sports, Science and Technology (21K06031)
  • Japan Society for the Promotion of Science (JP20K06517, 19H05783, JP19H05762, JP22K06107)
  • Japan Agency for Medical Research and Development (22gm1410010s0202, JP20am0101070, JP21am0101072)
  • Japan Science and Technology Agency, Adaptable and Seamless Technology Transfer Program through Target-Driven R and D (JPMJTR224A)
Topics
  • Life Sciences › Biochemistry, Genetics and Molecular Biology › Structural Biology › Enzyme Structure and Function
  • Physical Sciences › Materials Science › Materials Chemistry › X-ray Diffraction in Crystallography
  • Physical Sciences › Chemistry › Inorganic Chemistry › Crystal structures of chemical compounds
Keywords
structural polymorphism, hierarchical clustering, trypsin-inhibitor complex, structural heterogeneity, crystal structure classification, automated data collection
MeSH terms
Trypsin, X-Ray Diffraction, Molecular Structure, Cluster Analysis, Crystallography, X-Ray

About these checks

Registry, retraction, Cites and statistics results are computed, not judged, with one exception: a printed reference that no index lists is read once by a model before it counts as a citation error. Claims are extracted by a model and kept only when their quote appears verbatim in the text; each cited source is then checked, with a model’s help, for whether it says what the claim relies on. Those verdicts can be wrong — read the claim’s quote and the cited source before relying on one.

Statistics and arithmetic are recomputed, not judged.

Confidence bands are shown only for fields calibrated on our annotated test set. None is calibrated yet, so no band is shown.

What counts as a claim ›How we measure confidence ›How we check this ›

Are you an author, or do you see a problem with this page? Request a review