

The DOI matches its Crossref record; 2 of the 2 references it cites were found in a registry or an index.
Factors affecting macromolecule orientations in thin films formed in cryo-EM
Open accessPublished version of a preprint
Abstract
The formation of a vitrified thin film embedded with randomly oriented macromolecules is an essential prerequisite for cryogenic sample electron microscopy. Most commonly, this is achieved using the plunge-freeze method first described nearly 40 years ago. Although this is a robust method, the behaviour of different macromolecules shows great variation upon freezing and often needs to be optimized to obtain an isotropic, high-resolution reconstruction. For a macromolecule in such a film, the probability of encountering the air–water interface in the time between blotting and freezing and adopting preferred orientations is very high. 3D reconstruction using preferentially oriented particles often leads to anisotropic and uninterpretable maps. Currently, there are no general solutions to this prevalent issue, but several approaches largely focusing on sample preparation with the use of additives and novel grid modifications have been attempted. In this study, the effect of physical and chemical factors on the orientations of macromolecules was investigated through an analysis of selected well studied macromolecules, and important parameters that determine the behaviour of proteins on cryo-EM grids were revealed. These insights highlight the nature of the interactions that cause preferred orientations and can be utilized to systematically address orientation bias for any given macromolecule and to provide a framework to design small-molecule additives to enhance sample stability and behaviour.
Overview
The claims and statistics of this paper haven’t been checked yet.
Run the check — free, no account needed. It reads the open-access text and checks the sources it cites.
Integrity signals
Registry
Cites
Statistics
Figures
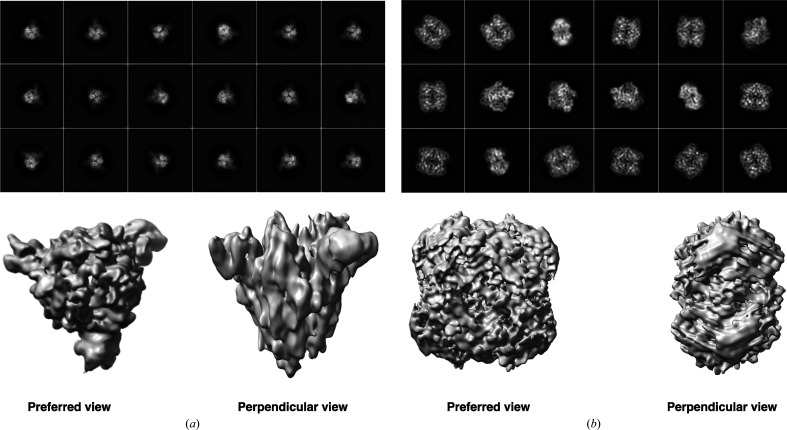
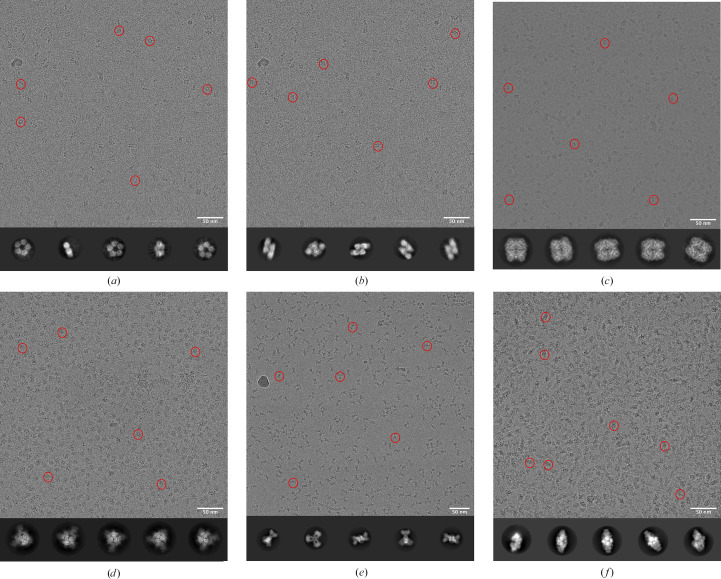
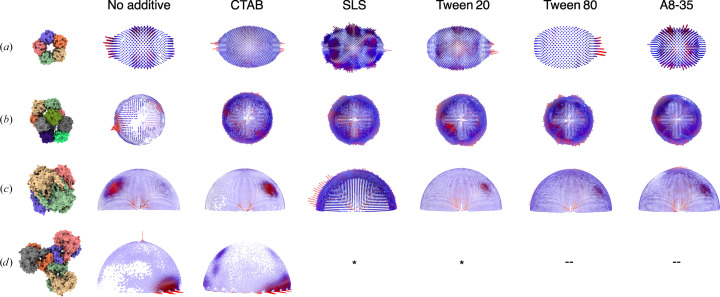
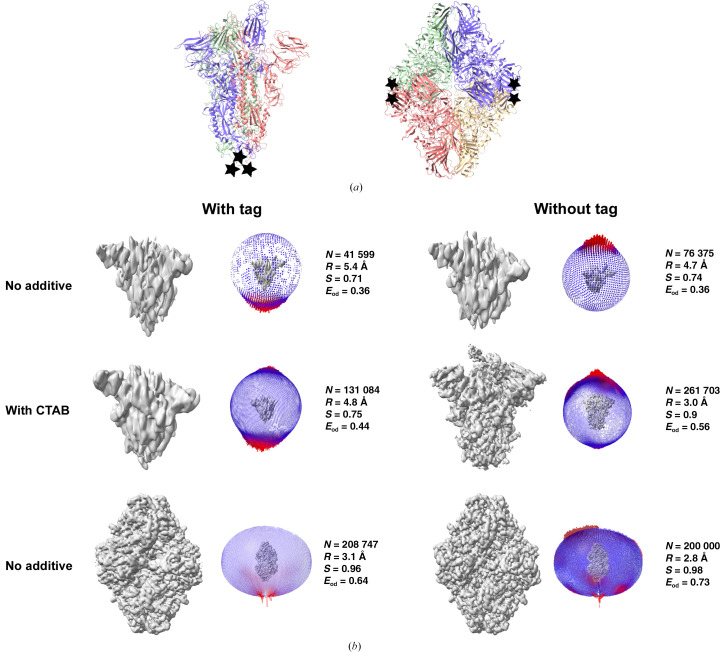
Verification
Claims the paper makes
The claims and statistics of this paper haven’t been checked yet.
Run the check — free, no account needed. It reads the open-access text and checks the sources it cites.
Self-check
Percentages, sums and reported differences re-computed from the paper’s own numbers.
The self-check needs the paper’s full text.
Citations
Cites
Highly accurate protein structure prediction with AlphaFold
Jumper, J., Evans, R., Pritzel, A., Green, T., Figurnov, M., Ronneberger, O., Tunyasuvunakool, K., Bates, R., Žídek, A., Potapenko, A., et al. (2021) · Nature · doi:10.1038/s41586-021-03819-2 · Cited by 43,764
Accurate prediction of protein structures and interactions using a 3-track network
Baek, M., DiMaio, F., Anishchenko, I., Dauparas, J., Ovchinnikov, S., Lee, G. R., Wang, J., Cong, Q., Kinch, L. N., Schaeffer, R. D., et al. (2021) · doi:10.1101/2021.06.14.448402 · Cited by 5,549
Research works printed but not linked: 95
- Adrian, 1984, Nature, 308, 32, 10.1038/308032a0 · DOI
- Afonine, 2018, Acta Cryst. D, 74, 531, 10.1107/S2059798318006551 · DOI
- Aiyer, 2024, Nat. Commun., 15, 389, 10.1038/s41467-023-44555-7 · DOI
- Baek, 2021, Science, 373, 871, 10.1126/science.abj8754 · DOI · Paper page
- Bai, 2021, Trends Biochem. Sci., 46, 253, 10.1016/j.tibs.2021.01.001 · DOI
- Baker, 2021, Commun. Biol., 4, 625, 10.1038/s42003-021-02156-4 · DOI
- Bangaru, 2020, Science, 370, 1089, 10.1126/science.abe1502 · DOI · Paper page
- Bartesaghi, 2018, Structure, 26, 848, 10.1016/j.str.2018.04.004 · DOI
- Bodakuntla, 2023, Front. Mol. Biosci., 10, 1252529, 10.3389/fmolb.2023.1252529 · DOI
- Bromberg, 2022, Front. Mol. Biosci., 9, 912072, 10.3389/fmolb.2022.912072 · DOI
- Campbell, 2015, eLife, 4, e06380, 10.7554/eLife.06380 · DOI
- Carter-Fenk, 2021, Chem. Sci., 12, 8320, 10.1039/D1SC01276B · DOI
- Chaplin, 2009, Water, 1, 1, 10.3390/w1010001 · DOI
- Chen, 2019, J. Struct. Biol. X, 1, 100005
- Chen, 2022, Microscopy, 71, i51, 10.1093/jmicro/dfab037 · DOI
- Cheng, 2023, J. Am. Chem. Soc., 145, 8073, 10.1021/jacs.3c00659 · DOI
- Cheng, 2015, Cell, 161, 450, 10.1016/j.cell.2015.03.049 · DOI
- Chua, 2022, Annu. Rev. Biochem., 91, 1, 10.1146/annurev-biochem-032620-110705 · DOI
- Dandey, 2020, Nat. Methods, 17, 897, 10.1038/s41592-020-0925-6 · DOI
- D'Imprima, 2019, eLife, 8, e42747, 10.7554/eLife.42747 · DOI
- Drulyte, 2018, Acta Cryst. D, 74, 560, 10.1107/S2059798318006496 · DOI
- Drzymala, 1999, J. Colloid Interface Sci., 220, 229, 10.1006/jcis.1999.6528 · DOI
- Dubochet, 1988, Q. Rev. Biophys., 21, 129, 10.1017/S0033583500004297 · DOI · Paper page
- Dubochet, 1985, Trends Biochem. Sci., 10, 143, 10.1016/0968-0004(85)90150-1 · DOI
- Dubochet, 1982, J. Microsc., 128, 219, 10.1111/j.1365-2818.1982.tb04625.x · DOI
- Dubochet, 1981, J. Microsc., 124, 3, 10.1111/j.1365-2818.1981.tb02483.x · DOI
- Emsley, 2010, Acta Cryst. D, 66, 486, 10.1107/S0907444910007493 · DOI · Paper page
- Esfahani, 2024, bioRxiv, 20240124577038
- Fan, 2021, Nat. Commun., 12, 7257, 10.1038/s41467-021-27596-8 · DOI
- Frederik, 1989, J. Microsc., 153, 81, 10.1111/j.1365-2818.1989.tb01469.x · DOI
- Glaeser, 2017, Biophys. Rep., 3, 1, 10.1007/s41048-016-0026-3 · DOI
- Hardenbrook, 2022, Curr. Opin. Virol., 52, 123, 10.1016/j.coviro.2021.11.011 · DOI
- Harvey, W. T., Carabelli, A. M., Jackson, B., Gupta, R. K., Thomson, E. C., Harrison, E. M., Ludden, C., Reeve, R., Rambaut, A., COVID-19 Genomics UK (COG-UK) Consortium, Peacock, S. J. & Robertson, D. L. (2021). Nat. Rev. Microbiol. 19, 409-424. · DOI · Paper page
- He, 2023, Nat. Commun., 14, 3217, 10.1038/s41467-023-39031-1 · DOI
- Henderson, 1995, Q. Rev. Biophys., 28, 171, 10.1017/S003358350000305X · DOI · Paper page
- Hesketh, 2018, Nat. Commun., 9, 2369, 10.1038/s41467-018-04793-6 · DOI
- Hochuli, 1988, Nat. Biotechnol., 6, 1321, 10.1038/nbt1188-1321 · DOI · Paper page
- Huang, 2020, Acta Pharmacol. Sin., 41, 1141, 10.1038/s41401-020-0485-4 · DOI
- Huber, 2022, eLife, 11, e72629, 10.7554/eLife.72629 · DOI
- Jain, 2012, J. Struct. Biol., 179, 68, 10.1016/j.jsb.2012.04.020 · DOI
- Juers, 2000, Protein Sci., 9, 1685, 10.1110/ps.9.9.1685 · DOI
- Juers, 2012, Protein Sci., 21, 1792, 10.1002/pro.2165 · DOI
- Jurrus, 2018, Protein Sci., 27, 112, 10.1002/pro.3280 · DOI
- Kampjut, 2021, iScience, 24, 102139, 10.1016/j.isci.2021.102139 · DOI
- Ko, 2000, Acta Cryst. D, 56, 241, 10.1107/S0907444999015930 · DOI
- Li, 2021, J. Struct. Biol., 213, 107783, 10.1016/j.jsb.2021.107783 · DOI
- Liebschner, 2019, Acta Cryst. D, 75, 861, 10.1107/S2059798319011471 · DOI · Paper page
- Liu, 2023, J. Mol. Biol., 435, 167926, 10.1016/j.jmb.2022.167926 · DOI
- Lu, 2022, Nat. Commun., 13, 6718, 10.1038/s41467-022-34579-w · DOI
- Lyumkis, 2019, J. Biol. Chem., 294, 5181, 10.1074/jbc.REV118.005602 · DOI
- Martins-Costa, 2023, J. Am. Chem. Soc., 145, 1400, 10.1021/jacs.2c12089 · DOI
- Merchant, 1998, Nat. Biotechnol., 16, 677, 10.1038/nbt0798-677 · DOI
- Murshudov, 2011, Acta Cryst. D, 67, 355, 10.1107/S0907444911001314 · DOI
- Naydenova, 2017, Nat. Commun., 8, 629, 10.1038/s41467-017-00782-3 · DOI
- Nguyen, 2020, J. Oleo Sci., 69, 519, 10.5650/jos.ess20024 · DOI
- Noble, 2018, eLife, 7, e34257, 10.7554/eLife.34257 · DOI
- Noble, 2018, Nat. Methods, 15, 793, 10.1038/s41592-018-0139-3 · DOI
- Nogales, 2016, Nat. Methods, 13, 24, 10.1038/nmeth.3694 · DOI · Paper page
- Noone, 2021, Front. Immunol., 12, 757633, 10.3389/fimmu.2021.757633 · DOI
- Okemefuna, 2010, J. Biol. Chem., 285, 1041, 10.1074/jbc.M109.044495 · DOI
- Patwardhan, 2017, Acta Cryst. D, 73, 503, 10.1107/S2059798317004181 · DOI
- Pettersen, 2004, J. Comput. Chem., 25, 1605, 10.1002/jcc.20084 · DOI · Paper page
- Pettersen, 2021, Protein Sci., 30, 70, 10.1002/pro.3943 · DOI
- Pintilie, 2020, Nat. Methods, 17, 328, 10.1038/s41592-020-0731-1 · DOI
- Quispe, 2007, Microsc. Microanal., 13, 365, 10.1017/S1431927607070791 · DOI
- Rabe, 2020, Eur. Biophys. J., 49, 533, 10.1007/s00249-020-01459-4 · DOI
- Ramírez-Aportela, 2022, IUCrJ, 9, 632, 10.1107/S2052252522006959 · DOI
- Rosenthal, 2003, J. Mol. Biol., 333, 721, 10.1016/j.jmb.2003.07.013 · DOI · Paper page
- Russo, 2016, J. Struct. Biol., 193, 33, 10.1016/j.jsb.2015.11.006 · DOI
- Samanta, 2011, Chem. Eng. Res. Des., 89, 2344, 10.1016/j.cherd.2011.04.006 · DOI
- Sanchez-Garcia, 2021, Commun. Biol., 4, 874, 10.1038/s42003-021-02399-1 · DOI
- Sathyanarayanan, 2019, Nat. Commun., 10, 4127, 10.1038/s41467-019-11931-1 · DOI
- Schauperl, 2022, J. Chem. Inf. Model., 62, 3142, 10.1021/acs.jcim.2c00026 · DOI · Paper page
- Scheres, 2012, J. Struct. Biol., 180, 519, 10.1016/j.jsb.2012.09.006 · DOI · Paper page
- Schürmann, 2017, Ultramicroscopy, 182, 10, 10.1016/j.ultramic.2017.06.003 · DOI
- Sorzano, 2022, Acta Cryst. D, 78, 410, 10.1107/S2059798322001978 · DOI
- Sorzano, 2021, J. Struct. Biol., 213, 107695, 10.1016/j.jsb.2020.107695 · DOI
- Szymczyk, 2018, J. Solution Chem., 47, 1824, 10.1007/s10953-018-0823-z · DOI
- Tan, 2017, Nat. Methods, 14, 793, 10.1038/nmeth.4347 · DOI
- Tang, 2020, Chem. Rev., 120, 3633, 10.1021/acs.chemrev.9b00512 · DOI
- Tang, 2007, J. Struct. Biol., 157, 38, 10.1016/j.jsb.2006.05.009 · DOI
- Taylor, 1974, Science, 186, 1036, 10.1126/science.186.4168.1036 · DOI
- Tobiasson, 2022, Nat. Commun., 13, 6132, 10.1038/s41467-022-33582-5 · DOI
- Vinothkumar, 2016, Q. Rev. Biophys., 49, e13, 10.1017/S0033583516000068 · DOI
- Vogel, 1986, Nature, 320, 533, 10.1038/320533a0 · DOI
- Wei, 2018, J. Struct. Biol., 202, 170, 10.1016/j.jsb.2018.01.001 · DOI
- Wrapp, 2020, Science, 367, 1260, 10.1126/science.abb2507 · DOI · Paper page
- Wrobel, 2023, Curr. Opin. Struct. Biol., 81, 102619, 10.1016/j.sbi.2023.102619 · DOI
- Xu, 2021, SmartMat, 2, 202, 10.1002/smm2.1045 · DOI
- Yamashita, 2021, Acta Cryst. D, 77, 1282, 10.1107/S2059798321009475 · DOI
- Zhang, 2016, J. Struct. Biol., 193, 1, 10.1016/j.jsb.2015.11.003 · DOI
- Zheng, 2023, Nat. Methods, 20, 123, 10.1038/s41592-022-01693-y · DOI
- Zhong, 2019, Annu. Rev. Phys. Chem., 70, 45, 10.1146/annurev-physchem-042018-052311 · DOI
- Zivanov, 2018, eLife, 7, e42166, 10.7554/eLife.42166 · DOI · Paper page
- Zivanov, 2019, IUCrJ, 6, 5, 10.1107/S205225251801463X · DOI
Metadata
- Authors
- Yadav, S., & Vinothkumar, K. R.
- Affiliations
- Tata Institute of Fundamental Research (IN)
- Venue
- Acta Crystallographica Section D Structural Biology
- Published
- 2024-06-27
- Volume
- 80
- Issue
- 7
- Pages
- 535-550
- ISSN
- 2059-7983 (ISSN-L)
- PMC
- PMC11220838
- OpenAlex
- W4400103674
- Cited by
- 7
- References
- 2
- Citations by year
- 2026: 5 · 2025: 2
- FWCI
- 1.28
- Type
- journal article
- Language
- en
- Open access
- hybrid
- doi.org
- Licence
- cc-by
- creativecommons.org/licenses/by/4.0/legalcode (vor)
- creativecommons.org/licenses/by/4.0/legalcode (tdm)
- Locations
- Acta Crystallographica Section D Structural Biology (publishedVersion, cc-by)
- bioRxiv (Cold Spring Harbor Laboratory) (acceptedVersion, cc-by-nc-nd)
- PubMed Central (publishedVersion, cc-by)
- PubMed (publishedVersion)
- Funders
- Department of Biotechnology, Ministry of Science and Technology, India (DBT/PR12422/MED/31/287/2014)
- Department of Atomic Energy, Government of India (RTI4006)
- National Centre for Biological Sciences
- Topics
- Life Sciences › Biochemistry, Genetics and Molecular Biology › Structural Biology › Advanced Electron Microscopy Techniques and Applications
- Life Sciences › Biochemistry, Genetics and Molecular Biology › Structural Biology › Enzyme Structure and Function
- Life Sciences › Biochemistry, Genetics and Molecular Biology › Molecular Biology › Protein Structure and Dynamics
- Keywords
- crystallographic texture, orientation bias, air-water interface, protein adsorption, sample preparation, 3D reconstruction, vitrification
- MeSH terms
- SARS-CoV-2, Escherichia coli, Humans, Models, Molecular, Proteins, Surface-Active Agents, Temperature, Protein Structure, Tertiary, Cryoelectron Microscopy, Protein Structure, Quaternary
About these checks
Registry, retraction, Cites and statistics results are computed, not judged, with one exception: a printed reference that no index lists is read once by a model before it counts as a citation error. Claims are extracted by a model and kept only when their quote appears verbatim in the text; each cited source is then checked, with a model’s help, for whether it says what the claim relies on. Those verdicts can be wrong — read the claim’s quote and the cited source before relying on one.
Statistics and arithmetic are recomputed, not judged.
Confidence bands are shown only for fields calibrated on our annotated test set. None is calibrated yet, so no band is shown.
What counts as a claim ›How we measure confidence ›How we check this ›
Are you an author, or do you see a problem with this page? Request a review
Data sources
Bibliographic data: Semantic Scholar, OpenAlex, Crossref.
Contains information from the Semantic Scholar Academic Graph Datasets, made available under the ODC Attribution License (ODC-BY 1.0).
Semantic Scholar’s data is described in: Kinney, R., et al. (2023). The Semantic Scholar Open Data Platform. arXiv:2301.10140.
