

The DOI matches its Crossref record; 60 of the 60 references it cites were found in a registry or an index; none of the 67 sources its claims cite is checked for support yet.
Effortful listening under the microscope: Examining relations between pupillometric and subjective markers of effort and tiredness from listening
Open accessAbstract
Effort during listening is commonly measured using the task‐evoked pupil response (TEPR); a pupillometric marker of physiological arousal. However, studies to date report no association between TEPR and perceived effort. One possible reason for this is the way in which self‐report effort measures are typically administered, namely as a single data point collected at the end of a testing session. Another possible reason is that TEPR might relate more closely to the experience of tiredness from listening than to effort per se. To examine these possibilities, we conducted two preregistered experiments that recorded subjective ratings of effort and tiredness from listening at multiple time points and examined their covariance with TEPR over the course of listening tasks varying in levels of acoustic and attentional demand. In both experiments, we showed a within‐subject association between TEPR and tiredness from listening, but no association between TEPR and effort. The data also suggest that the effect of task difficulty on the experience of tiredness from listening may go undetected using the traditional approach of collecting a single data point at the end of a listening block. Finally, this study demonstrates the utility of a novel correlation analysis technique (“rmcorr”), which can be used to overcome statistical power constraints commonly found in the literature. Teasing apart the subjective and physiological mechanisms that underpin effortful listening is a crucial step toward addressing these difficulties in older and/or hearing‐impaired individuals.
Overview
CoChat Summary
TL;DR
Across two preregistered experiments, task-evoked pupil response (TEPR) tracked within-subject changes in tiredness from listening but not subjective effort. The authors argue TEPR may be a physiological marker of listening-related tiredness/arousal rather than effort per se.
Key findings
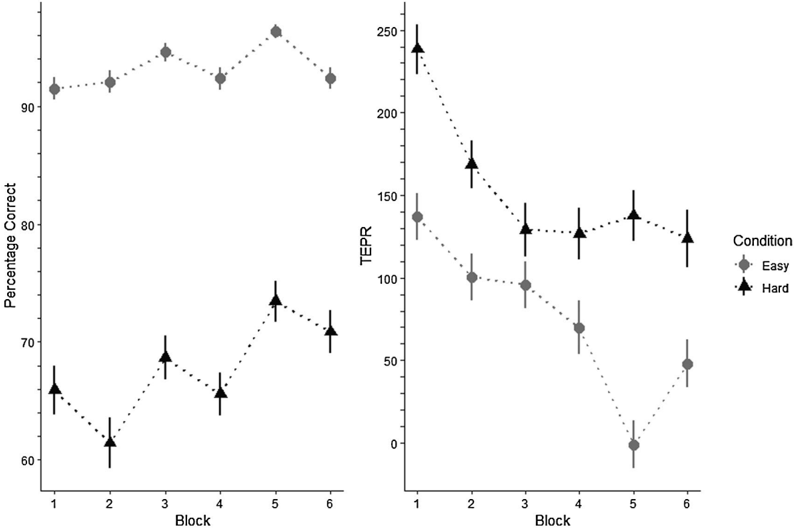
- In Experiment 1, TEPR was larger in the hard than easy condition (hard M = 154.94, SE = 25.79; easy M = 77.06, SE = 19.98; F(1,27) = 30.51, p < .001, partial η² = 0.53), and TEPR decreased over time (F(1,27) = 39.82, p < .001, partial η² = 0.60).
- Subjective effort and tiredness from listening were higher in the hard than easy condition in Experiment 1: effort hard M = 66.49, SE = 2.23 vs. easy M = 32.28, SE = 2.49, F(1,27) = 196.78, p < .001, partial η² = 0.88; tiredness hard M = 16.85, SE = 2.69 vs. easy M = 7.07, SE = 2.77, F(1,27) = 5.35, p = .03, partial η² = 0.17.
- Rmcorr showed a negative within-subject association between TEPR and tiredness from listening in Experiment 1 (r = −.40, 95% CI [−.53, −.25]) and Experiment 2 (r = −.48, 95% CI [−.63, −.31]), but no association between TEPR and effort in either experiment (Exp 1 r = .03, 95% CI [−.14, .19]; Exp 2 r = .03, 95% CI [−.18, .23]).
- In Experiment 2, TEPR decreased over time (F(1,18) = 35.54, p < .001, partial η² = 0.66) and tiredness from listening increased over time (F(1,19) = 77.61, p < .001, partial η² = 0.80), while effort ratings showed no linear change over time (F(1,19) = 0.65, p = .43, partial η² = 0.03).
Methods
- Two preregistered experiments used speech recognition with IEEE sentences in a competing female-talker masker. Experiment 1 included 28 young adults (5 male), aged 18–30, with normal hearing; participants completed easy and hard SNR blocks (hard mean adapted SNR = −9.5 dB, SD = 1.75; easy = hard + 10 dB). Experiment 2 included 20 healthy young adults (2 male), aged 18–30, who completed one hard condition only (mean adapted SNR = −8.6 dB, SD = 1.88) over 120 trials lasting approximately 35–40 min.
- Pupil size was recorded with EyeLink 1000 Plus at 250 Hz; TEPR was baseline-corrected using the 2-s masker preceding target onset and calculated as relative change during the 3-s window after target speech onset.
- Subjective effort, tiredness from listening, and performance evaluation were collected repeatedly during listening. Analyses included repeated-measures ANOVAs, standard Pearson/Spearman correlations, and repeated-measures correlation (“rmcorr”) to examine within-subject associations.
Limitations
- The paper states that of 48 participants, only seven were male, so sex-related differences cannot be ruled out; it advocates a more balanced sex ratio in future research.
- The paper states that causality cannot be inferred from these correlational findings, and notes at least two possible causal interpretations for the negative TEPR–tiredness association.
- The text makes evident that both experiments used young, normal-hearing adults, so findings may not generalize to older and/or hearing-impaired individuals; Experiment 1’s rmcorr analyses were also not preregistered and were treated as exploratory.
Model-written summary. Check it against the paper before relying on it.
Integrity signals
Registry
Cites
Statistics
Figures


Verification
Claims the paper makes
0 Valid · 1 Not valid · 52 Not checked · 131 Own results and interpretations
A result the paper reports from its own data — it cites no other source for it, so there is none to check. The quote shows it is in the paper.
In the paper
“In both experiments, we showed a within-subject association between TEPR and tiredness from listening, but no association between TEPR and effort.”
§ Effortful listening under the microscope: Examining relations between pupillometric and subjective markers of effort and tiredness from listening > Abstract
plainstates an association- Asserted: passes — The authors put it forward as true.
- Checkable: passes — It can be checked against evidence.
- Load-bearing: passes — The paper’s conclusions depend on it.
- Based: passes — The paper gives a reason why it holds.
A result the paper reports from its own data — it cites no other source for it, so there is none to check. The quote shows it is in the paper.
In the paper
“In both experiments, we showed a within-subject association between TEPR and tiredness from listening, but no association between TEPR and effort.”
§ Effortful listening under the microscope: Examining relations between pupillometric and subjective markers of effort and tiredness from listening > Abstract
plain- Asserted: passes — The authors put it forward as true.
- Checkable: passes — It can be checked against evidence.
- Load-bearing: passes — The paper’s conclusions depend on it.
- Based: passes — The paper gives a reason why it holds.
A result the paper reports from its own data — it cites no other source for it, so there is none to check. The quote shows it is in the paper.
In the paper
“The data also suggest that the effect of task difficulty on the experience of tiredness from listening may go undetected using the traditional approach of collecting a single data point at the end of a listening block.”
§ Effortful listening under the microscope: Examining relations between pupillometric and subjective markers of effort and tiredness from listening > Abstract
hedged- Asserted: passes — The authors put it forward as true.
- Checkable: passes — It can be checked against evidence.
- Load-bearing: passes — The paper’s conclusions depend on it.
- Based: passes — The paper gives a reason why it holds.
- Rests on an assumption not shown here.
A result the paper reports from its own data — it cites no other source for it, so there is none to check. The quote shows it is in the paper.
In the paper
“There was a significant main effect of condition on performance accuracy (F (1,27) = 213.95,p < .001,partial η 2 = 0.89).”
§ Effortful listening under the microscope: Examining relations between pupillometric and subjective markers of effort and tiredness from listening > 1.3.1 | Speech recognition performance
plain- Asserted: passes — The authors put it forward as true.
- Checkable: passes — It can be checked against evidence.
- Load-bearing: passes — The paper’s conclusions depend on it.
- Based: passes — The paper gives a reason why it holds.
A result the paper reports from its own data — it cites no other source for it, so there is none to check. The quote shows it is in the paper.
In the paper
“There was a significant main effect of condition on effort ratings (F (1,27) = 196.78,p < .001,partial η 2 = 0.88).”
§ Effortful listening under the microscope: Examining relations between pupillometric and subjective markers of effort and tiredness from listening > 1.3.3 | Subjective ratings
plain- Asserted: passes — The authors put it forward as true.
- Checkable: passes — It can be checked against evidence.
- Load-bearing: passes — The paper’s conclusions depend on it.
- Based: passes — The paper gives a reason why it holds.
- Rests on an assumption not shown here.
105 more claims
Create a free account to see all 184 claims and to verify the 55 references still open.
- It may state two separate claims as one. 43
- Probably not a substantial claim. 37
- The quote only partly states this claim. 3
Statistics recomputed
Every reported test result, recomputed from its test statistic and degrees of freedom. A result shows as not adding up only once an independent check has confirmed it.
- ConsistentF(1, 27) = 213.95reported p < .001 · recomputed p < .001
“F (1,27) = 213.95,p < .001”
- ConsistentF(1, 27) = 29.6reported p < .001 · recomputed p < .001
“F (1,27) = 29.60,p < .001”
- ConsistentF(1, 27) = 2.64reported p = .12 · recomputed p = .116
“F (1,27) = 2.64, p = .12”
- ConsistentF(1, 27) = 30.51reported p < .001 · recomputed p < .001
“F (1,27) = 30.51,p < .001”
- ConsistentF(1, 27) = 39.82reported p < .001 · recomputed p < .001
“F (1,27) = 39.82,p < .001”
14 more recomputed tests
Create a free account to see every test the Stats check recomputed.
Self-check
Percentages, sums and reported differences re-computed from the paper’s own numbers.
Each contradiction between two passages listed here was confirmed by an independent check.
Rated minor: it would not touch a result — a value no result rests on, a p-value that stays on the same side of the significance level, or a conflict that is clerical, resolved elsewhere in the paper, or outside its own findings.
In the paper
§ Effortful listening under the microscope: Examining relations between pupillometric and subjective markers of effort and tiredness from listening > 3.1 | TEPR as a marker of tiredness from listening, not effort
“5. Speech recognition performance .05[-.16, .25]-.49 [-.62, -.32] .11”
§ Effortful listening under the microscope: Examining relations between pupillometric and subjective markers of effort and tiredness from listening > 3.1 | TEPR as a marker of tiredness from listening, not effort
“[-.30, .09].59[.44, .70]”
Rated minor: it would not touch a result — a value no result rests on, a p-value that stays on the same side of the significance level, or a conflict that is clerical, resolved elsewhere in the paper, or outside its own findings.
In the paper
§ Effortful listening under the microscope: Examining relations between pupillometric and subjective markers of effort and tiredness from listening > 3.2 | Relations between subjective measures
“Analyses of each condition subset in Experiment 1 yielded similar effect sizes for easy (r = .36)and hard (r = .28)conditions”
§ Effortful listening under the microscope: Examining relations between pupillometric and subjective markers of effort and tiredness from listening > 1.4 | Discussion
“4. Performance evaluation rating .05[-.22, .12]-.76 [-.83, -.69] -.36 [-.49, -.20]”
Citations
Cites
Statistical power analyses using G∗Power 3.1: tests for correlation and regression analyses
Faul, F., Erdfelder, E., Buchner, A., & Lang, A.-G. (2009) · Behavior Research Methods · doi:10.3758/brm.41.4.1149 · Cited by 37,615
Development of NASA-TLX (Task Load Index): Results of Empirical and Theoretical Research
(1988) · Advances in Psychology · doi:10.1016/s0166-4115(08)62386-9 · Cited by 15,003
Aston-Jones, G., & Cohen, J. D. (2005) · Annual Review of Neuroscience · doi:10.1146/annurev.neuro.28.061604.135709 · Cited by 4,472
The TRACE model of speech perception
McClelland, J. L., & Elman, J. L. (1986) · Cognitive Psychology · doi:10.1016/0010-0285(86)90015-0 · Cited by 2,956
Bakdash, J. Z., & Marusich, L. R. (2017) · Frontiers in Psychology · doi:10.3389/fpsyg.2017.00456 · Cited by 2,018
Hearing Impairment and Cognitive Energy: The Framework for Understanding Effortful Listening (FUEL)
Pichora-Fuller, M. K., Kramer, S. E., Eckert, M. A., Edwards, B., Hornsby, B. W. Y., Humes, L. E., Lemke, U., Lunner, T., Matthen, M., Mackersie, C. L., et al. (2016) · Ear & Hearing · doi:10.1097/aud.0000000000000312 · Cited by 1,318
IEEE Recommended Practice for Speech Quality Measurements
(1969) · IEEE Transactions on Audio and Electroacoustics · doi:10.1109/tau.1969.1162058 · Cited by 1,232
Pupillometry: Psychology, Physiology, and Function
Mathôt, S. (2018) · Journal of Cognition · doi:10.5334/joc.18 · Cited by 900
Voice and Articulation Drillbook
Seashore, C. E. (1940) · Music Educators Journal · doi:10.2307/3388520 · Cited by 892
Speech recognition in adverse conditions: A review.
Mattys, S. L., Davis, M. H., Bradlow, A. R., & Scott, S. K. (2012) · Language and Cognitive Processes · doi:10.1080/01690965.2012.705006 · Cited by 809
Self-citationMental fatigue and the control of cognitive processes: effects on perseveration and planning
van der Linden, D., Frese, M., & Meijman, T. F. (2003) · Acta Psychologica · doi:10.1016/s0001-6918(02)00150-6 · Cited by 646
Simple adaptive testing with the weighted up-down method
Kaernbach, C. (1991) · Perception & Psychophysics · doi:10.3758/bf03214307 · Cited by 627
McGarrigle, R., Munro, K. J., Dawes, P., Stewart, A. J., Moore, D. R., Barry, J. G., & Amitay, S. (2014) · International Journal of Audiology · doi:10.3109/14992027.2014.890296 · Cited by 532
Self-citationCognition counts: A working memory system for ease of language understanding (ELU)
Rönnberg, J., Rudner, M., Foo, C., & Lunner, T. (2008) · International Journal of Audiology · doi:10.1080/14992020802301167 · Cited by 489
Pupil Response as an Indication of Effortful Listening: The Influence of Sentence Intelligibility
Zekveld, A. A., Kramer, S. E., & Festen, J. M. (2010) · Ear & Hearing · doi:10.1097/aud.0b013e3181d4f251 · Cited by 437
The Psychology of Fatigue: Work, Effort and Control
Hockey, R. (2013) · doi:10.1017/cbo9781139015394 · Cited by 350
Winn, M. B., Wendt, D., Koelewijn, T., & Kuchinsky, S. E. (2018) · Trends in Hearing · doi:10.1177/2331216518800869 · Cited by 339
Hornsby, B. W. Y. (2013) · Ear & Hearing · doi:10.1097/aud.0b013e31828003d8 · Cited by 326
The Pupil Dilation Response to Auditory Stimuli: Current State of Knowledge
Zekveld, A. A., Koelewijn, T., & Kramer, S. E. (2018) · Trends in Hearing · doi:10.1177/2331216518777174 · Cited by 306
The window of my eyes: Task disengagement and mental fatigue covary with pupil dynamics
Hopstaken, J. F., van der Linden, D., Bakker, A. B., & Kompier, M. A. J. (2015) · Biological Psychology · doi:10.1016/j.biopsycho.2015.06.013 · Cited by 247
Self-Reported Listening-Related Effort and Fatigue in Hearing-Impaired Adults
Alhanbali, S., Dawes, P., Lloyd, S., & Munro, K. J. (2017) · Ear & Hearing · doi:10.1097/aud.0000000000000361 · Cited by 237
Fatigue as a Window to the Brain
(2005) · The MIT Press eBooks · doi:10.7551/mitpress/2967.001.0001 · Cited by 231
Pupil Dilation Uncovers Extra Listening Effort in the Presence of a Single-Talker Masker
Koelewijn, T., Zekveld, A. A., Festen, J. M., & Kramer, S. E. (2012) · Ear & Hearing · doi:10.1097/aud.0b013e3182310019 · Cited by 227
Kidd, G. D., Mason, C. R., Richards, V. M., Gallun, F. J., & Durlach, N. I. (2007) · Springer handbook of auditory research · doi:10.1007/978-0-387-71305-2_6 · Cited by 201
Dissociation between mental fatigue and motivational state during prolonged mental activity
Monika, G., Jacob, B., Olivier, E., & Zénon, A. (2015) · Frontiers in Behavioral Neuroscience · doi:10.3389/fnbeh.2015.00176 · Cited by 191
A taxonomy of fatigue concepts and their relation to hearing loss.
Hornsby, B. W. Y., Naylor, G., & Bess, F. H. (2016) · Ear & Hearing · doi:10.1097/aud.0000000000000289 · Cited by 188
Ohlenforst, B., Zekveld, A. A., Lunner, T., Wendt, D., Naylor, G., Wang, Y., Versfeld, N. J., & Kramer, S. E. (2017) · Hearing Research · doi:10.1016/j.heares.2017.05.012 · Cited by 185
Clayson, P. E., Carbine, K. A., Baldwin, S. A., & Larson, M. J. (2019) · Psychophysiology · doi:10.1111/psyp.13437 · Cited by 184
Qualitative analysis of the handicap associated with occupational hearing loss
Hétu, R., Riverin, L., Lalande, N., Getty, L., & St-cyr, C. (1988) · British Journal of Audiology · doi:10.3109/03005368809076462 · Cited by 174
Nachtegaal, J., Kuik, D. J., Anema, J. R., Goverts, S. T., Festen, J. M., & Kramer, S. E. (2009) · International Journal of Audiology · doi:10.1080/14992020902962421 · Cited by 168
Listening effort: Are we measuring cognition or affect, or both?
Francis, A. L., & Love, J. (2019) · Wiley Interdisciplinary Reviews Cognitive Science · doi:10.1002/wcs.1514 · Cited by 155
Strand, J. F., Brown, V. A., Merchant, M. B., Brown, H. E., & Smith, J. (2018) · Journal of Speech, Language, and Hearing Research · doi:10.1044/2018_jslhr-h-17-0257 · Cited by 133
Pupil diameter measurement errors as a function of gaze direction in corneal reflection eyetrackers
Brisson, J., Mainville, M., Mailloux, D., Beaulieu, C., Serres, J., & Sirois, S. (2013) · Behavior Research Methods · doi:10.3758/s13428-013-0327-0 · Cited by 129
Borghini, G., & Hazan, V. (2018) · Frontiers in Neuroscience · doi:10.3389/fnins.2018.00152 · Cited by 127
Neural indices of listening effort in noisy environments
Dimitrijevic, A., Smith, M. L., Kadis, D. S., & Moore, D. R. (2019) · Scientific Reports · doi:10.1038/s41598-019-47643-1 · Cited by 125
Wang, Y., Naylor, G., Kramer, S. E., Zekveld, A. A., Wendt, D., Ohlenforst, B., & Lunner, T. (2017) · Ear and Hearing · doi:10.1097/aud.0000000000000512 · Cited by 119
Synthesizing Views to Understand Sex Differences in Response to Early Life Adversity
Bath, K. G. (2020) · Trends in Neurosciences · doi:10.1016/j.tins.2020.02.004 · Cited by 119
Hornsby, B. W. Y., & Kipp, A. M. (2015) · Ear and Hearing · doi:10.1097/aud.0000000000000203 · Cited by 107
Hearing impairment and daily-life fatigue: a qualitative study
Holman, J. A., Drummond, A., Hughes, S. E., & Naylor, G. (2019) · International Journal of Audiology · doi:10.1080/14992027.2019.1597284 · Cited by 103
Speech‐perception training for older adults with hearing loss impacts word recognition and effort
Kuchinsky, S. E., Ahlstrom, J. B., Cute, S. L., Humes, L. E., Dubno, J. R., & Eckert, M. A. (2014) · Psychophysiology · doi:10.1111/psyp.12242 · Cited by 91
Development of an adaptive scaling method for subjective listening effort
Krueger, M., Schulte, M., Brand, T., & Holube, I. (2017) · The Journal of the Acoustical Society of America · doi:10.1121/1.4986938 · Cited by 88
Speech perception: Some new directions in research and theory
Pisoni, D. B. (1985) · The Journal of the Acoustical Society of America · doi:10.1121/1.392451 · Cited by 87
Rennies, J., Schepker, H., Holube, I., & Kollmeier, B. (2014) · The Journal of the Acoustical Society of America · doi:10.1121/1.4897398 · Cited by 87
Pupillometry reveals changes in physiological arousal during a sustained listening task.
McGarrigle, R., Dawes, P., Stewart, A. J., Kuchinsky, S. E., & Munro, K. J. (2017) · Psychophysiology · doi:10.1111/psyp.12772 · Cited by 84
Self-citationPeng, Z. E., & Wang, L. M. (2019) · Journal of Speech, Language, and Hearing Research · doi:10.1044/2018_jslhr-h-17-0423 · Cited by 81
A Potential Bias in Subjective Ratings of Mental Effort
Moore, T. M., & Picou, E. M. (2018) · Journal of Speech, Language, and Hearing Research · doi:10.1044/2018_jslhr-h-17-0451 · Cited by 72
Monitoring Alpha Oscillations and Pupil Dilation across a Performance-Intensity Function
McMahon, C. M., Boisvert, I., de Lissa, P., Granger, L., Ibrahim, R., Lo, C. Y., Miles, K., & Graham, P. L. (2016) · Frontiers in Psychology · doi:10.3389/fpsyg.2016.00745 · Cited by 68
Agus, T. R., Akeroyd, M. A., Gatehouse, S., & Warden, D. (2009) · The Journal of the Acoustical Society of America · doi:10.1121/1.3205403 · Cited by 67
Comparison of Psychophysiological and Dual-Task Measures of Listening Effort
Seeman, S., & Sims, R. (2015) · Journal of Speech, Language, and Hearing Research · doi:10.1044/2015_jslhr-h-14-0180 · Cited by 65
Task-evoked pupil response for accurately recognized accented speech
McLaughlin, D. J., & Van Engen, K. J. (2020) · The Journal of the Acoustical Society of America · doi:10.1121/10.0000718 · Cited by 59
Development of the Listening Self-Efficacy Questionnaire (LSEQ)
Smith, S. L., Pichora-Fuller, M. K., Watts, K. L., & More, C. L. (2011) · International Journal of Audiology · doi:10.3109/14992027.2011.553205 · Cited by 57
Rovetti, J., Goy, H., Pichora-Fuller, M. K., & Russo, F. (2019) · Trends in Hearing · doi:10.1177/2331216519886722 · Cited by 55
The Creativity-Verification Cycle in Psychological Science: New Methods to Combat Old Idols
Wagenmakers, E., Dutilh, G., & Sarafoglou, A. (2018) · Perspectives on Psychological Science · doi:10.1177/1745691618771357 · Cited by 54
Neural mechanisms of mental fatigue elicited by sustained auditory processing
Moore, T. M., Key, A. P., Thelen, A., & Hornsby, B. W. Y. (2017) · Neuropsychologia · doi:10.1016/j.neuropsychologia.2017.10.025 · Cited by 48
The relationship between speech recognition, behavioural listening effort, and subjective ratings
Picou, E. M., & Ricketts, T. A. (2018) · International Journal of Audiology · doi:10.1080/14992027.2018.1431696 · Cited by 39
The Effects of Directional Processing on Objective and Subjective Listening Effort
Picou, E. M., Moore, T. M., & Ricketts, T. A. (2017) · Journal of Speech, Language, and Hearing Research · doi:10.1044/2016_jslhr-h-15-0416 · Cited by 37
Thönes, S., Arnau, S., & Wascher, E. (2018) · Consciousness and Cognition · doi:10.1016/j.concog.2018.06.014 · Cited by 36
An analysis of the masking of speech by competing speech using self-report data
Agus, T. R., Akeroyd, M. A., Noble, W. G., & Bhullar, N. (2009) · The Journal of the Acoustical Society of America · doi:10.1121/1.3025915 · Cited by 28
Fatigue as a window to the brain
DeLuca, J. (2005) · Cited by 26
Pals, C., Sarampalis, A., van Dijk, M., & Başkent, D. (2018) · Ear and Hearing · doi:10.1097/aud.0000000000000587 · Cited by 12
Research works printed but not linked: 3
- Hart S. G., 1988, Advances in psychology, 139
- Nike, 2020, Speech in noise mixing, signal to noise ratio
- RStudio Team, 2019, RStudio: Integrated Development for R
Cited by
Contadini-Wright, C., Magami, K., Mehta, N., & Chait, M. (2023) · Journal of Neuroscience · doi:10.1523/jneurosci.0242-23.2023 · Cited by 49
Grenzebach, J., & Romanus, E. (2022) · Noise and Health · doi:10.4103/nah.nah_34_22 · Cited by 42
Shields, C., Sladen, M., Bruce, I. A., Kluk, K., & Nichani, J. (2023) · Trends in Hearing · doi:10.1177/23312165221137116 · Cited by 40
Listening effort and fatigue in native and non-native primary school children
Brännström, K. J., Rudner, M., Carlie, J., Sahlén, B., Gulz, A., Andersson, K., & Johansson, R. (2021) · Journal of Experimental Child Psychology · doi:10.1016/j.jecp.2021.105203 · Cited by 39
Older adults show a more sustained pattern of effortful listening than young adults.
McGarrigle, R., Knight, S., Rakusen, L. L., Geller, J., & Mattys, S. L. (2021) · Psychology and Aging · doi:10.1037/pag0000587 · Cited by 36
Self-citation
Metadata
- Authors
- McGarrigle, R., Rakusen, L., & Mattys, S.
- Affiliations
- University of York (GB)
- Corresponding author
- McGarrigle, Ronan
- Venue
- Psychophysiology
- Publisher
- Wiley
- Published
- 2020-10-08
- Volume
- 58
- Issue
- 1
- Pages
- e13703-e13703
- ISSN
- 0048-5772 (ISSN-L)
- 1469-8986
- OpenAlex
- W3092441470
- Cited by
- 43
- References
- 60
- Citations by year
- 2026: 1 · 2025: 8 · 2024: 8 · 2023: 14 · 2022: 5 · 2021: 7
- FWCI
- 5.83
- Type
- journal article
- Language
- en
- Open access
- hybrid
- doi.org
- Licence
- Locations
- Psychophysiology (publishedVersion, cc-by)
- PsyArXiv (OSF Preprints) (submittedVersion, cc-by)
- PubMed (publishedVersion)
- White Rose Research Online (University of Leeds, The University of Sheffield, University of York) (submittedVersion)
- PsyArXiv (OSF Preprints) (submittedVersion)
- Funders
- Economic and Social Research Council (ES/R003572/1)
- Topics
- Health Sciences › Health Professions › Speech and Hearing › Hearing Loss and Rehabilitation
- Life Sciences › Neuroscience › Sensory Systems › Hearing, Cochlea, Tinnitus, Genetics
- Life Sciences › Neuroscience › Cognitive Neuroscience › Neuroscience and Music Perception
- Keywords
- listening effort, pupillometry, perceived effort, task difficulty, attentional demands, statistical power, older adults, hearing-impaired listeners
- MeSH terms
- Adolescent, Adult, Attention, Female, Humans, Male, Pupil, Speech Acoustics, Speech Perception, Recognition, Psychology, Young Adult
About these checks
Registry, retraction, Cites and statistics results are computed, not judged, with one exception: a printed reference that no index lists is read once by a model before it counts as a citation error. Claims are extracted by a model and kept only when their quote appears verbatim in the text; each cited source is then checked, with a model’s help, for whether it says what the claim relies on. Those verdicts can be wrong — read the claim’s quote and the cited source before relying on one.
A language model drew the claims from the paper on 2026-11-19, under version 3 of the claim definition (model deepseek-v4.1-flash, prompt extract-v3).
A second model labelled each claim on 2026-11-19 (model jev-1.13-20260917, definition revision gold-guideline-v0.2).
Statistics and arithmetic are recomputed, not judged.
Confidence bands are shown only for fields calibrated on our annotated test set. None is calibrated yet, so no band is shown.
What counts as a claim ›How we measure confidence ›How we check this ›
Are you an author, or do you see a problem with this page? Request a review
Data sources
Bibliographic data: Semantic Scholar, OpenAlex, Crossref.
Contains information from the Semantic Scholar Academic Graph Datasets, made available under the ODC Attribution License (ODC-BY 1.0).
Semantic Scholar’s data is described in: Kinney, R., et al. (2023). The Semantic Scholar Open Data Platform. arXiv:2301.10140.
