

The DOI matches its Crossref record; 40 of the 42 references it cites were found in a registry or an index; 12 of the 28 sources its claims cite were checked for support.
Agricultural diversification promotes multiple ecosystem services without compromising yield
Open accessAbstract
Diversification practices benefit biodiversity, pollination, pest control, nutrient cycling, soil fertility, and water regulation.
Overview
CoChat Summary
TL;DR
A systematic review and second-order meta-analysis of 98 meta-analyses (456 effect sizes; 6167 original studies) found that agricultural diversification generally increases biodiversity and multiple ecosystem services while leaving crop yield neutral overall. The second-order meta-analysis (69 meta-analyses; 324 effect sizes; 41,946 comparisons) showed significant gains for biodiversity, pollination, pest control, nutrient cycling, water regulation, and soil fertility, with neutral crop yield and climate regulation.
Key findings
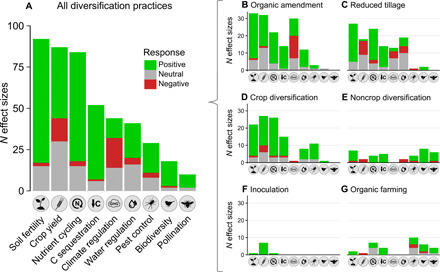
- The systematic review found that diversification effects were predominantly positive: 67% positive, 23% neutral, and 10% negative effect sizes. Soil fertility and nutrient cycling had the highest numbers of positive effect sizes, while crop yield and climate regulation had the highest proportions of negative responses (16 and 41%, respectively).
- In the second-order meta-analysis, crop yield was neutral [lnRR = 0.01; 95% CI = −0.12 to 0.14]. Diversification enhanced biodiversity (lnRR = 0.34; 95% CI = 0.15 to 0.53), pollination (0.28; 0.02 to 0.55), pest control (0.23; 0.04 to 0.41), nutrient cycling (0.18; 0.10 to 0.27), water regulation (0.18; 0.07 to 0.28), and soil fertility (0.17; 0.08 to 0.26); carbon sequestration was marginal (0.11; −0.01 to 0.23), and climate regulation was neutral (0.04; −0.08 to 0.15).
- Trade-off analysis used 111 crop yield–ecosystem service effect size combinations from 23 meta-analyses. It found mainly win-win scenarios (63% of combinations); climate regulation had the highest number of trade-offs, with 50% representing increased yield alongside decreased climate regulation. Among win-win situations, 74% included soil fertility, nutrient cycling, and water regulation.
- Practice-specific results: aboveground diversification (crop and noncrop diversity) increased pest control; belowground diversification (organic amendment, reduced tillage, inoculation) enhanced soil fertility and marginally carbon sequestration. Organic amendment increased water regulation, soil fertility, nutrient cycling, and carbon sequestration; reduced tillage enhanced soil fertility, nutrient cycling, and belowground biodiversity; crop diversity improved aboveground biodiversity, pest control, nutrient cycling, and water regulation.
Methods
- Systematic review of published meta-analyses identified through Web of Science and Google Scholar searches until November 2018, with inclusion criteria requiring quantitative effects of diversification practices on ecological processes in crop production. The final review included 98 statistically independent meta-analyses, 456 effect sizes, and 6167 original studies; independence was assessed by limiting shared original studies to a maximum of 30%, and study quality was scored.
- Second-order meta-analysis used the subset of 69 meta-analyses reporting comparable effect sizes (lnRR or closely related metrics), comprising 324 effect sizes, 5160 original studies, and 41,946 original comparisons. Effect sizes were transformed to lnRR and analyzed with multilevel mixed-effects models in the metafor package, including random effects and weighting by number of original comparisons; separate models examined aboveground practices, belowground practices, organic amendment, reduced tillage, and crop diversity.
- Robustness checks included publication bias assessment via funnel plot, Egger test, and Rosenberg’s fail-safe number, plus sensitivity analyses for study quality, repeated effect sizes, different shared-study thresholds, and a stricter ecosystem service classification.
Limitations
- The paper states research gaps: pollination, biodiversity, and pest control were less represented (10, 18, and 29 effect sizes, respectively), and noncrop diversification, inoculation, and organic farming were less represented (38, 9, and 34 effect sizes) and need further investigation. It also states that effects of diversification on multiple ecosystem services are a major research gap, with only 111 effect size combinations available.
- The paper states that crop yield response to diversification is highly context-dependent; climate regulation was highly variable and yielded the highest number of trade-offs and lose-lose relationships, mostly driven by increased greenhouse gas emissions from organic soil amendments. It also notes that geographical range was not included as an explanatory variable because of unbalanced distribution, and that interactions between ecosystem service category and diversification practice were not modeled because there were too many combinations (38 levels).
- Evident from the text: the second-order meta-analysis excluded meta-analyses using standardized mean differences (Hedges d) or correlation coefficients, so only 69 of the 98 reviewed meta-analyses were included in the quantitative synthesis. The systematic review’s vote-count approach is descriptive and does not weight effect sizes.
Model-written summary. Check it against the paper before relying on it.
Integrity signals
Registry
Cites
Statistics
Figures


Verification
Claims the paper makes
6 Valid · 2 Not valid · 12 Not checked · 85 Own results and interpretations
The cited sources support only part of this claim — read each source’s verdict below.
In the paper
“Enhancing the diversity of biological communities, both above and below ground, can increase resource use efficiency and the stability of ecosystem production over time (5–7).”
§ Agricultural diversification promotes multiple ecosystem services without compromising yield > INTRODUCTION
What the sources say
- Supportedcites [5] Cardinale B. J., Duffy J. E., Gonzalez A., Hooper D. U., Perrings C., Venail P., Narwani A., Mace G. M., Tilman D., Wardle D. A., Kinzig A. P., Daily G. C., Loreau M., Grace J. B., Larigauderie A., Srivastava D. S., Naeem S., Biodiversity loss and its impact on humanity. Nature 486, 59– 67 (2012). 22678280 source
Two section headers and their body text on p. 4 carry the claim: biodiversity loss 'reduces the efficiency by which whole communities capture biologically essential resources (nutrients, water, light, prey), and convert those resources into biomass', and 'theory and data both support greater temporal stability of a community property like total biomass at higher levels of diversity'. The above-/below-ground scope is covered by the same passage's statement that 'Biodiversity effects appear remarkably consistent across different groups of organisms, among trophic levels, and across the various ecosystems that have been studied', together with the paper's inclusion of genes, species and functional groups, litter diversity, decomposition and soil nutrient recycling (pp. 4, 21); the paper does not use the phrase 'above and below ground' but does not restrict the effects to either compartment. The hedged 'can increase' also matches the source's acknowledgement of exceptions and of variation around the mean effect (pp. 4-5). (LLM, conf=0.82)
- Partly supportedcites [6] Wagg C., Bender S. F., Widmer F., van der Heijden M. G., Soil biodiversity and soil community composition determine ecosystem multifunctionality. Proc. Natl. Acad. Sci. U.S.A. 111, 5266– 5270 (2014). 24639507 PMC3986181 sourceExperimental — accuracy not yet measured
Wagg et al. (2014) supports the diversity–functioning link for both compartments: the Significance (p. 1) and Results and Discussion (p. 2, p. 3) report that reduced soil biodiversity impairs plant diversity, decomposition, nutrient cycling and retention, and that 'a greater diversity of soil organisms can enhance litter break down, reduce nutrient leaching losses, and maintain resource turnover between above- and below-ground communities', while noting aboveground plant diversity is a key driver of ecosystem functioning (p. 3). That covers the resource-use-efficiency element (framed inversely, as loss reducing function). However, the claim's second element — increased stability of ecosystem production over time — is not supported: our copy contains no temporal-stability measurement, the experiments are short-term microcosm trials, and the only time-related statement is that effects of simplified soil communities 'may become progressively more inhibiting as time passes' (Results and Discussion, p. 3), which is not stability of production. (LLM, conf=0.78)
- Partly supportedcites [7] Renard D., Tilman D., National food production stabilized by crop diversity. Nature 571, 257– 260 (2019). 31217589 sourceExperimental — accuracy not yet measured
Renard & Tilman (2019) support only the aboveground, stability half of the claim: the Summary (p. 2) reports that 'greater effective diversity of crops at the national level is associated with increased temporal stability of total national harvest,' and the Introduction (p. 2) notes ecological experiments showing greater plant diversity leads to greater ecosystem productivity and stability. Our copy nowhere addresses belowground biological communities or resource use efficiency (searches for 'resource use efficiency', 'belowground/soil biodiversity' returned only reference lists and unrelated tables), and the Results (p. 3) state that mean national yield is 'statistically independent of effective crop species diversity,' so a diversity-driven gain in production efficiency is not what this paper shows. The claim's belowground component and its resource-use-efficiency component are therefore unsupported by this source. (LLM, conf=0.72)
plainstates a possible cause- Asserted: passes — The authors put it forward as true.
- Checkable: passes — It can be checked against evidence.
- Load-bearing: passes — The paper’s conclusions depend on it.
- Based: passes — The paper gives a reason why it holds.
- Supported
The cited sources support only part of this claim — read each source’s verdict below.
In the paper
“These were mostly driven by increased greenhouse gas emissions caused by the application of organic soil amendments (Fig. 1) (3, 19).”
§ Agricultural diversification promotes multiple ecosystem services without compromising yield > DISCUSSION
What the sources say
- Not checked yetcites [3] Ramankutty N., Mehrabi Z., Waha K., Jarvis L., Kremen C., Herrero M., Rieseberg L. H., Trends in global agricultural land use: Implications for environmental health and food security. Annu. Rev. Plant Biol. 69, 789– 815 (2018). 29489395 source
- Partly supportedcites [19] He Y., Zhou X., Jiang L., Li M., Du Z., Zhou G., Shao J., Wang X., Xu Z., Bai S. H., Wallace H., Xu C., Effects of biochar application on soil greenhouse gas fluxes: A meta-analysis. Glob. Change Biol. Bioenergy 9, 743– 755 (2017). sourceExperimental — accuracy not yet measured
The source supports the mechanism for one specific amendment: in 'Responses of GWP of soil GHGs to biochar application' it reports that biochar application significantly increased GWP by 46.22% [CI 19.72–82.20%], 'largely resulting from the significant stimulation of soil CO2 fluxes,' and the Abstract likewise attributes an increased GWP of total soil GHG fluxes to the large stimulation of CO2. However, our copy is a meta-analysis of biochar only (91 papers, 552 paired comparisons); it reports nothing on organic soil amendments as a class (compost, manure, etc.), so the citing generalization to 'organic soil amendments' goes beyond this source. The source also qualifies the direction: soil CO2 fluxes were suppressed and GWP decreased (−7.69%) when biochar was applied to N-fertilized soils, so the increase is not a general property of amendment application. (LLM, conf=0.72)
plainstates a cause- Asserted: passes — The authors put it forward as true.
- Checkable: passes — It can be checked against evidence.
- Load-bearing: passes — The paper’s conclusions depend on it.
- Based: passes — The paper gives a reason why it holds.
The cited sources support only part of this claim — read each source’s verdict below.
In the paper
“We only found 111 effect size combinations, highlighting that effects of diversification on multiple ecosystem services is a major research gap (16).”
§ Agricultural diversification promotes multiple ecosystem services without compromising yield > RESULTS > Trade-offs between crop yield and multiple ecosystem services
What the sources say
- Partly supportedcites [16] Tamburini G., De Simone S., Sigura M., Boscutti F., Marini L., Soil management shapes ecosystem service provision and trade-offs in agricultural landscapes. Proc. R. Soc. B 283, 20161369 (2016). PMC5013797 27559064 sourceExperimental — accuracy not yet measured
The Introduction says studies of how farming practices affect multiple ecosystem services are urgently needed and that few attempts have measured relationships among those services. This supports the general research-gap point, but the paper does not identify diversification specifically as the gap. The 111 effect-size combinations are presented as the citing authors’ own finding, not a result attributed to this source. (LLM, conf=0.82)
plain- Asserted: passes — The authors put it forward as true.
- Checkable: passes — It can be checked against evidence.
- Load-bearing: passes — The paper’s conclusions depend on it.
- Based: passes — The paper gives a reason why it holds.
- Partly supported
The sources with a verdict support this claim; the rest weren’t checked yet, have no full text we could read, or their verdicts aren’t rated yet.
In the paper
“Despite a rapidly growing body of research assessing the impacts of agricultural diversification practices on biodiversity and related ecosystem services (7, 10–12), there is no comprehensive quantitative synthesis of this information.”
§ Agricultural diversification promotes multiple ecosystem services without compromising yield > INTRODUCTION
What the sources say
- Supportedcites [7] Renard D., Tilman D., National food production stabilized by crop diversity. Nature 571, 257– 260 (2019). 31217589 source
The citation is attached to the sentence’s description of research on agricultural diversification, not to the citing authors’ statement that no comprehensive synthesis exists. In “National food production stabilized by crop diversity” (p. 2), Renard and Tilman report a quantitative study linking national crop diversity to the stability of food harvests, so the paper serves as an example of the cited research. (LLM, conf=0.86)
- Not checked yetcites [10] Rosa-Schleich J., Loos J., Mußhoff O., Tscharntke T., Ecological-economic trade-offs of diversified farming systems–A review. Ecol. Econ. 160, 251– 263 (2019). source
- Could not verifycites [11] Seufert V., Ramankutty N., Many shades of gray—The context-dependent performance of organic agriculture. Sci. Adv. 3, e1602638 (2017). 28345054 PMC5362009 sourceExperimental — accuracy not yet measured
The Biodiversity section reviews quantitative findings on organic management, and Knowledge Gaps identifies uncertainties in particular outcomes. Neither section says whether a comprehensive quantitative synthesis exists across agricultural diversification practices and related ecosystem services; searches for that synthesis and for diversification found no such statement. In the citing sentence, the citations appear after the background clause, not after the claim that no synthesis exists. (LLM, conf=0.75)
- Supportedcites [12] Beillouin D., Ben-Ari T., Makowski D., Evidence map of crop diversification strategies at the global scale. Environ. Res. Lett. 14, 123001 (2019). source
The citation is attached to the claim that research on diversification impacts is rapidly growing, not to the subsequent assertion that no comprehensive quantitative synthesis exists. Section 3.1 reports 99 meta-analyses covering more than 3,736 primary studies, with three-quarters of the meta-analyses published in the preceding six years. (LLM, conf=0.90)
plain- Asserted: passes — The authors put it forward as true.
- Checkable: passes — It can be checked against evidence.
- Load-bearing: passes — The paper’s conclusions depend on it.
- Based: passes — The paper gives a reason why it holds.
- Supported
A result the paper reports from its own data — it cites no other source for it, so there is none to check. The quote shows it is in the paper.
In the paper
“crop diversity improved (aboveground) biodiversity, pest control, nutrient cycling, and water regulation”
§ Agricultural diversification promotes multiple ecosystem services without compromising yield > RESULTS > Biodiversity and ecosystem service response to diversification
plainstates a cause- Asserted: passes — The authors put it forward as true.
- Checkable: passes — It can be checked against evidence.
- Load-bearing: passes — The paper’s conclusions depend on it.
- Based: passes — The paper gives a reason why it holds.
53 more claims
Create a free account to see all 105 claims and to verify the 16 references still open.
- Probably not a substantial claim. 31
- It may state two separate claims as one. 25
- The quote only partly states this claim. 1
Claims other papers make about this one
Each is checked against this paper’s own text: does it say what the citing paper says it does?
The source backs part of the claim, not all of it — or backs it for a different population, condition or comparison.
In the citing paper
“Many previous reviews or meta-analyses on the impacts of farming on biodiversity have either focused on farming systems as a whole6,9, such as circular agriculture12, regenerative agriculture13 or organic agriculture14, or on individual practices or taxonomic groups15–17.”
From Farming practices to enhance biodiversity across biomes: a systematic review (2024) · cites this paper as [17]
Experimental — accuracy not yet measured
Citations
Cites
Preferred Reporting Items for Systematic Reviews and Meta-Analyses: the PRISMA statement
Moher, D., Liberati, A., Tetzlaff, J., Altman, D. G., & for the PRISMA Group (2009) · BMJ · doi:10.1136/bmj.b2535 · Cited by 83,823
Bias in meta-analysis detected by a simple, graphical test
Egger, M., Smith, G. D., Schneider, M., & Minder, C. (1997) · BMJ · doi:10.1136/bmj.315.7109.629 · Cited by 56,722 · cited 2×
“mv function the precision (1/SE) as a covariate (33, 37).”
BackgroundPreferred reporting items for systematic reviews and meta-analyses: the PRISMA Statement.
(2009) · PubMed Central · Cited by 44,859
Preferred reporting items for systematic reviews and meta-analyses: The PRISMA statement
Moher, D., Liberati, A., Tetzlaff, J., Altman, D. G., & the PRISMA Group* (2009) · Annals of Internal Medicine · doi:10.7326/0003-4819-151-4-200908180-00135 · Cited by 37,554
Conducting Meta-Analyses in R with the metafor Package
Viechtbauer, W. (2010) · Journal of Statistical Software · doi:10.18637/jss.v036.i03 · Cited by 20,464 · cited 2×
“96 is a good approximation to the SE (35, 36).”
BackgroundMethodBiodiversity loss and its impact on humanity
Cardinale, B. J., Duffy, J. E., Gonzalez, A., Hooper, D. U., Perrings, C., Venail, P., Narwani, A., Mace, G. M., Tilman, D., Wardle, D. A., et al. (2012) · Nature · doi:10.1038/nature11148 · Cited by 7,457
Feature Selection with the Boruta Package
Kursa, M. B., & Rudnicki, W. R. (2010) · Journal of Statistical Software · doi:10.18637/jss.v036.i11 · Cited by 5,659
Outlier and influence diagnostics for meta-analysis
Viechtbauer, W., & Cheung, M. W.-L. (2010) · Research Synthesis Methods · doi:10.1002/jrsm.11 · Cited by 2,949 · cited 1×
“Climate regulation (42,18) Crop yield (62,39) Nutrient cycling (67,26) Water regulation (31,17)”
BackgroundSoil biodiversity and soil community composition determine ecosystem multifunctionality
Wagg, C., Bender, S. F., Widmer, F., & van der Heijden, M. G. A. (2014) · Proceedings of the National Academy of Sciences · doi:10.1073/pnas.1320054111 · Cited by 2,550
Self-citationEcosystem services and agriculture: tradeoffs and synergies
Power, A. G. (2010) · Philosophical Transactions of the Royal Society B: Biological Sciences · doi:10.1098/rstb.2010.0143 · Cited by 2,334
Ecological intensification: harnessing ecosystem services for food security
Bommarco, R., Kleijn, D., & Potts, S. G. (2013) · Trends in Ecology & Evolution · doi:10.1016/j.tree.2012.10.012 · Cited by 1,862
Self-citationMeta-analysis and the science of research synthesis
Gurevitch, J., Koricheva, J., Nakagawa, S., & Stewart, G. (2018) · Nature · doi:10.1038/nature25753 · Cited by 1,709 · cited 4×
“Carbon sequestration (29,16) Soil fertility (65,25) Pest control (14,7) Pollination (4,3) Biodiversity (10,7)”
BackgroundMethodInfluentialProductivity limits and potentials of the principles of conservation agriculture
Pittelkow, C. M., Liang, X., Linquist, B. A., van Groenigen, K. J., Lee, J., Lundy, M. E., van Gestel, N., Six, J., Venterea, R. T., & van Kessel, C. (2015) · Nature · doi:10.1038/nature13809 · Cited by 1,688
Rosenberg, M. S. (2005) · Evolution · doi:10.1111/j.0014-3820.2005.tb01004.x · Cited by 1,285 · cited 1×
“We then calculated Rosenberg’s fail-safe number to assess the robustness of our results to potential publication bias (38).”
MethodAgriculture production as a major driver of the Earth system exceeding planetary boundaries
Campbell, B. M., Beare, D. J., Bennett, E. M., Hall-Spencer, J. M., Ingram, J. S. I., Jaramillo, F., Ortiz, R., Ramankutty, N., Sayer, J. A., & Shindell, D. (2017) · Ecology and Society · doi:10.5751/es-09595-220408 · Cited by 1,197
Handbook of Meta-analysis in Ecology and Evolution
(2013) · doi:10.1515/9781400846184 · Cited by 1,183
Redefining ecosystem multifunctionality
Manning, P., van der Plas, F., Soliveres, S., Allan, E., Maestre, F. T., Mace, G., Whittingham, M. J., & Fischer, M. (2018) · Nature Ecology & Evolution · doi:10.1038/s41559-017-0461-7 · Cited by 1,162
Kremen, C., & Miles, A. (2012) · Ecology and Society · doi:10.5751/es-05035-170440 · Cited by 1,126
Self-citationA global synthesis reveals biodiversity-mediated benefits for crop production
Dainese, M., Martin, E. A., Aizen, M. A., Albrecht, M., Bartomeus, I., Bommarco, R., Carvalheiro, L. G., Chaplin-Kramer, R., Gagic, V., Garibaldi, L. A., et al. (2019) · Science Advances · doi:10.1126/sciadv.aax0121 · Cited by 1,070
Self-citationTamim, R. M., Bernard, R. M., Borokhovski, E., Abrami, P. C., & Schmid, R. F. (2011) · Review of Educational Research · doi:10.3102/0034654310393361 · Cited by 1,029
Trends in Global Agricultural Land Use: Implications for Environmental Health and Food Security
Ramankutty, N., Mehrabi, Z., Waha, K., Jarvis, L., Kremen, C., Herrero, M., & Rieseberg, L. H. (2018) · Annual Review of Plant Biology · doi:10.1146/annurev-arplant-042817-040256 · Cited by 954
Self-citationKremen, C., Iles, A., & Bacon, C. (2012) · Ecology and Society · doi:10.5751/es-05103-170444 · Cited by 732
Self-citationThe impact of hunting on tropical mammal and bird populations
Benítez-López, A., Alkemade, R., Schipper, A. M., Ingram, D. J., Verweij, P. A., Eikelboom, J. A. J., & Huijbregts, M. A. J. (2017) · Science · doi:10.1126/science.aaj1891 · Cited by 663
The Economics of Ecosystems and Biodiversity: Recent Instances for Debate
Rodríguez-Labajos, B., & Martínez-Alier, J. (2013) · Conservation and Society · doi:10.4103/0972-4923.125744 · Cited by 637
National food production stabilized by crop diversity
Renard, D., & Tilman, D. (2019) · Nature · doi:10.1038/s41586-019-1316-y · Cited by 623
Meta-evaluation of meta-analysis: ten appraisal questions for biologists
Nakagawa, S., Noble, D. W. A., Senior, A. M., & Lagisz, M. (2017) · BMC Biology · doi:10.1186/s12915-017-0357-7 · Cited by 579
Ecological Intensification: Bridging the Gap between Science and Practice
Kleijn, D., Bommarco, R., Fijen, T. P. M., Garibaldi, L. A., Potts, S. G., & van der Putten, W. H. (2019) · Trends in Ecology & Evolution · doi:10.1016/j.tree.2018.11.002 · Cited by 548
Self-citationMany shades of gray—The context-dependent performance of organic agriculture
Seufert, V., & Ramankutty, N. (2017) · Science Advances · doi:10.1126/sciadv.1602638 · Cited by 523
Effects of biochar application on soil greenhouse gas fluxes: a meta‐analysis
He, Y., Zhou, X., Jiang, L., Li, M., Du, Z., Zhou, G., Shao, J., Wang, X., Xu, Z., Hosseini Bai, S., et al. (2017) · GCB Bioenergy · doi:10.1111/gcbb.12376 · Cited by 409
Ecological-economic trade-offs of Diversified Farming Systems – A review
Rosa-Schleich, J., Loos, J., Mußhoff, O., & Tscharntke, T. (2019) · Ecological Economics · doi:10.1016/j.ecolecon.2019.03.002 · Cited by 397
The global food economy: the battle for the future of farming
Weis, T. (2007) · Fernwood Publishing eBooks · doi:10.5040/9781350223165 · Cited by 364
The economic potential of agroecology: Empirical evidence from Europe
van der Ploeg, J. D., Barjolle, D., Bruil, J., Brunori, G., Costa Madureira, L. M., Dessein, J., Drąg, Z., Fink-Kessler, A., Gasselin, P., Gonzalez de Molina, M., et al. (2019) · Journal of Rural Studies · doi:10.1016/j.jrurstud.2019.09.003 · Cited by 299
Mitigation potential of soil carbon management overestimated by neglecting N2O emissions
Lugato, E., Leip, A., & Jones, A. (2018) · Nature Climate Change · doi:10.1038/s41558-018-0087-z · Cited by 255
Iverson, A. L., Marín, L. E., Ennis, K. K., Gonthier, D. J., Connor‐Barrie, B. T., Remfert, J. L., Cardinale, B. J., & Perfecto, I. (2014) · Journal of Applied Ecology · doi:10.1111/1365-2664.12334 · Cited by 214
Evidence map of crop diversification strategies at the global scale
Beillouin, D., Ben-Ari, T., & Makowski, D. (2019) · Environmental Research Letters · doi:10.1088/1748-9326/ab4449 · Cited by 192 · cited 2×
“Soil fertility (17,4,4) Water regulation (12,7,7)”
Habeck, C. W., & Schultz, A. K. (2015) · AoB Plants · doi:10.1093/aobpla/plv119 · Cited by 188
Levins, R. A., & Cochrane, W. W. (1996) · Land Economics · doi:10.2307/3146915 · Cited by 122
Meta-analytic insights into evolutionary ecology: an introduction and synthesis
Nakagawa, S., & Poulin, R. (2012) · Evolutionary Ecology · doi:10.1007/s10682-012-9593-z · Cited by 77
Soil management shapes ecosystem service provision and trade-offs in agricultural landscapes
Tamburini, G., De Simone, S., Sigura, M., Boscutti, F., & Marini, L. (2016) · Proceedings of the Royal Society B: Biological Sciences · doi:10.1098/rspb.2016.1369 · Cited by 65 · cited 2×
“Carbon sequestration (29,16) Soil fertility (65,25) Pest control (14,7) Pollination (4,3) Biodiversity (10,7)”
BackgroundSelf-citationMeta-analysis of meta-analyses in plant evolutionary ecology
Castellanos, M. C., & Verdú, M. (2012) · Evolutionary Ecology · doi:10.1007/s10682-012-9562-6 · Cited by 19 · cited 2×
“96 is a good approximation to the SE (35, 36).”
Method
Research works printed but not linked: 3
- Millennium Ecosystem Assessment Ecosystem and Human Well-Being: Synthesis (Island Press 2005).
- TEEB The Economics of Ecosystems and Biodiversity. Ecological and Economic Foundations (Routledge Abingdon 2010).
- J. A. Baldock P. N. Nelson Soil Organic Matter (CRC Press 2000).
Cited by
Getting the message right on nature‐based solutions to climate change
Seddon, N., Smith, A., Smith, P., Key, I., Chausson, A., Girardin, C., House, J., Srivastava, S., & Turner, B. (2021) · Global Change Biology · doi:10.1111/gcb.15513 · Cited by 1,073
Soil microbiomes and one health
Banerjee, S., & van der Heijden, M. G. A. (2023) · Nature Reviews Microbiology · doi:10.1038/s41579-022-00779-w · Cited by 905
Self-citationPositive but variable effects of crop diversification on biodiversity and ecosystem services
Beillouin, D., Ben‐Ari, T., Malézieux, E., Seufert, V., & Makowski, D. (2021) · Global Change Biology · doi:10.1111/gcb.15747 · Cited by 590
Beyond organic farming – harnessing biodiversity-friendly landscapes
Tscharntke, T., Grass, I., Wanger, T. C., Westphal, C., & Batáry, P. (2021) · Trends in Ecology & Evolution · doi:10.1016/j.tree.2021.06.010 · Cited by 565
Self-citationThe EAT–Lancet Commission on healthy, sustainable, and just food systems
Rockström, J., Thilsted, S. H., Willett, W. C., Gordon, L. J., Herrero, M., Hicks, C. C., Mason-D'Croz, D., Rao, N., Springmann, M., Wright, E. C., et al. (2025) · The Lancet · doi:10.1016/s0140-6736(25)01201-2 · Cited by 475
Self-citation
Metadata
- Authors
- Tamburini, G., Bommarco, R., Wanger, T. C., Kremen, C., van der Heijden, M. G. A., Liebman, M., & Hallin, S.
- Affiliations
- Swedish University of Agricultural Sciences (SE)
- University of British Columbia (CA)
- Plant-Soil-Interactions, Research Division Agroecology and Environment, Agroscope, Switzerland.
- Iowa State University (US)
- Corresponding author
- Tamburini, Giovanni
- ORCID
- Venue
- Science Advances
- Published
- 2020-11-06
- Volume
- 6
- Issue
- 45
- ISSN
- 2375-2548 (ISSN-L)
- PMC
- PMC7673676
- OpenAlex
- W3095634839
- Cited by
- 1,110
- References
- 42
- Citations by year
- 2026: 224 · 2025: 238 · 2024: 200 · 2023: 195 · 2022: 168 · 2021: 81 · 2020: 4
- FWCI
- 140.06
- Type
- journal article
- Language
- en
- Open access
- gold
- doi.org
- Licence
- Locations
- Science Advances (publishedVersion, cc-by-nc)
- PubMed Central (publishedVersion, cc-by-nc)
- PubMed (publishedVersion)
- Zurich Open Repository and Archive (University of Zurich) (acceptedVersion, cc-by-nc)
- GoeScholar The Publication Server of the Georg-August-Universität Göttingen (Georg-August-Universität Göttingen) (submittedVersion, cc-by)
- CINECA IRIS Institutional Research Information System (University of Bari Aldo Moro) (submittedVersion, cc-by-nc)
- Zurich Open Repository and Archive (University of Zurich) (submittedVersion, cc-by-nc)
- Zurich Open Repository and Archive (University of Zurich)
- Funders
- Swedish Research Council Formas (941-2015-1792)
- Topics
- Life Sciences › Agricultural and Biological Sciences › Agronomy and Crop Science › Agronomic Practices and Intercropping Systems
- Physical Sciences › Environmental Science › Global and Planetary Change › Land Use and Ecosystem Services
- Life Sciences › Agricultural and Biological Sciences › General Agricultural and Biological Sciences › Plant and soil sciences
- Keywords
- agricultural diversification, ecosystem services, crop yield, soil biodiversity, pollination, pest control, nutrient cycling, soil fertility, water regulation, food security, biodiversity conservation
About these checks
Registry, retraction, Cites and statistics results are computed, not judged, with one exception: a printed reference that no index lists is read once by a model before it counts as a citation error. Claims are extracted by a model and kept only when their quote appears verbatim in the text; each cited source is then checked, with a model’s help, for whether it says what the claim relies on. Those verdicts can be wrong — read the claim’s quote and the cited source before relying on one.
The claim verdicts this report counts are experimental: their accuracy is not yet measured.
A language model drew the claims from the paper on 2026-10-02, under version 3 of the claim definition (model deepseek-v4.1-flash, prompt extract-v3).
A second model labelled each claim on 2026-10-02 (model jev-1.13-20260917, definition revision gold-guideline-v0.2).
Cited sources are checked with a language model’s help (qwen3.8-omni-flash and gpt-6-sol).
Statistics and arithmetic are recomputed, not judged.
Confidence bands are shown only for fields calibrated on our annotated test set. None is calibrated yet, so no band is shown.
What counts as a claim ›How we measure confidence ›How we check this ›
Are you an author, or do you see a problem with this page? Request a review
Data sources
Bibliographic data: Semantic Scholar, OpenAlex, Crossref.
Contains information from the Semantic Scholar Academic Graph Datasets, made available under the ODC Attribution License (ODC-BY 1.0).
Semantic Scholar’s data is described in: Kinney, R., et al. (2023). The Semantic Scholar Open Data Platform. arXiv:2301.10140.
