

The DOI matches its Crossref record; 63 of the 63 references it cites were found in a registry or an index.
Conditionally pathogenic genetic variants of a hematopoietic disease-suppressing enhancer
Abstract
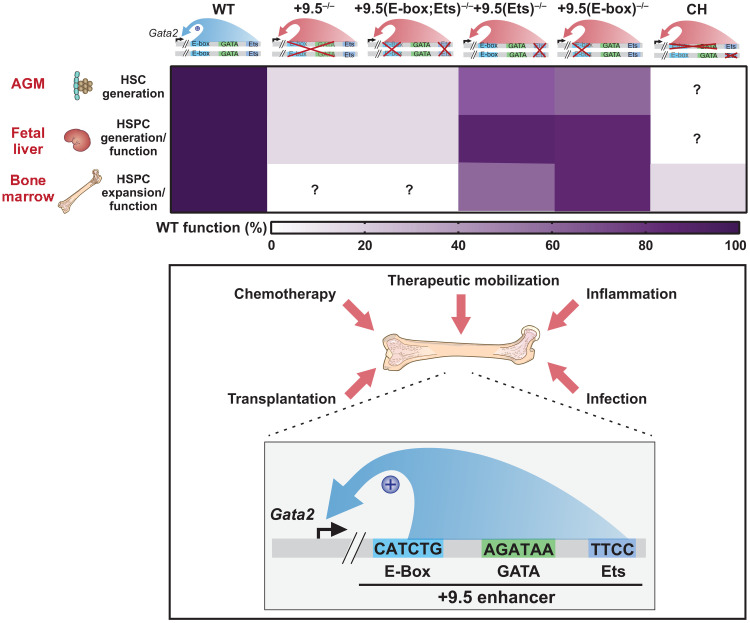
Noncoding genetic variants cause blood disease.
Overview
The claims and statistics of this paper haven’t been checked yet.
Run the check — free, no account needed. It reads the open-access text and checks the sources it cites.
Integrity signals
Registry
Cites
Statistics
Figures
Verification
Claims the paper makes
The claims and statistics of this paper haven’t been checked yet.
Run the check — free, no account needed. It reads the open-access text and checks the sources it cites.
Claims other papers make about this one
Each is checked against this paper’s own text: does it say what the citing paper says it does?
In the citing paper
“Inflammation has also been shown to synergise with genetic mouse models of human hematologic diseases to promote the emergence of clinically relevant features that do not manifest under standard laboratory conditions”
From Inflammatory exposure drives long-lived impairment of hematopoietic stem cell self-renewal activity and accelerated aging (2022) · cites this paper as Soukup et al., 2021
Self-check
Percentages, sums and reported differences re-computed from the paper’s own numbers.
The self-check needs the paper’s full text.
Citations
Cites
Richards, S., Aziz, N., Bale, S., Bick, D., Das, S., Gastier-Foster, J., Grody, W. W., Hegde, M., Lyon, E., Spector, E., et al. (2015) · Genetics in Medicine · doi:10.1038/gim.2015.30 · Cited by 32,594
ClinVar: improving access to variant interpretations and supporting evidence
Landrum, M. J., Lee, J. M., Benson, M., Brown, G. R., Chao, C., Chitipiralla, S., Gu, B., Hart, J., Hoffman, D., Jang, W., et al. (2018) · Nucleic Acids Research · doi:10.1093/nar/gkx1153 · Cited by 4,196
Expanded encyclopaedias of DNA elements in the human and mouse genomes
The ENCODE Project Consortium, Abascal, F., Acosta, R., Addleman, N. J., Adrian, J., Afzal, V., Ai, R., Aken, B., Akiyama, J. A., Jammal, O. A., et al. (2020) · Nature · doi:10.1038/s41586-020-2493-4 · Cited by 2,378
Self-citationStandards and Guidelines for the Interpretation and Reporting of Sequence Variants in Cancer
Li, M. M., Datto, M., Duncavage, E. J., Kulkarni, S., Lindeman, N. I., Roy, S., Tsimberidou, A. M., Vnencak-Jones, C. L., Wolff, D. J., Younes, A., et al. (2017) · The Journal of Molecular Diagnostics · doi:10.1016/j.jmoldx.2016.10.002 · Cited by 2,030
IFNα activates dormant haematopoietic stem cells in vivo
Essers, M. A. G., Offner, S., Blanco-Bose, W. E., Waibler, Z., Kalinke, U., Duchosal, M. A., & Trumpp, A. (2009) · Nature · doi:10.1038/nature07815 · Cited by 1,368
An early haematopoietic defect in mice lacking the transcription factor GATA-2
Tsai, F.-Y., Keller, G., Kuo, F. C., Weiss, M., Chen, J., Rosenblatt, M., Alt, F. W., & Orkin, S. H. (1994) · Nature · doi:10.1038/371221a0 · Cited by 1,237
GATA2 deficiency: a protean disorder of hematopoiesis, lymphatics, and immunity
Spinner, M. A., Sanchez, L. A., Hsu, A. P., Shaw, P. A., Zerbe, C. S., Calvo, K. R., Arthur, D. C., Gu, W., Gould, C. M., Brewer, C. C., et al. (2013) · Blood · doi:10.1182/blood-2013-07-515528 · Cited by 713
Exit from dormancy provokes DNA-damage-induced attrition in haematopoietic stem cells
Walter, D., Lier, A., Geiselhart, A., Thalheimer, F. B., Huntscha, S., Sobotta, M. C., Moehrle, B., Brocks, D., Bayindir, I., Kaschutnig, P., et al. (2015) · Nature · doi:10.1038/nature14131 · Cited by 619
Genomic and biochemical insights into the specificity of ETS transcription factors
Hollenhorst, P. C., McIntosh, L. P., & Graves, B. J. (2011) · Annual Review of Biochemistry · doi:10.1146/annurev.biochem.79.081507.103945 · Cited by 490
Włodarski, M. W., Hirabayashi, S., Pastor, V. M. L., Starý, J., Hasle, H., Masetti, R., Dworzak, M. N., Schmugge, M., van den Heuvel‐Eibrink, M. M., Ussowicz, M., et al. (2015) · Blood · doi:10.1182/blood-2015-09-669937 · Cited by 422
Grass, J. A., Boyer, M. E., Pal, S. K., Wu, J., Weiss, M. J., & Bresnick, E. H. (2003) · Proceedings of the National Academy of Sciences · doi:10.1073/pnas.1432147100 · Cited by 378
Self-citationVinh, D. C., Patel, S. Y., Uzel, G., Anderson, V. L., Freeman, A. F., Olivier, K. N., Spalding, C., Hughes, S., Pittaluga, S., Raffeld, M., et al. (2010) · Blood · doi:10.1182/blood-2009-03-208629 · Cited by 330
GATA-2 Plays Two Functionally Distinct Roles during the Ontogeny of Hematopoietic Stem Cells
Ling, K.-W., Ottersbach, K., van Hamburg, J. P., Oziemlak, A., Tsai, F.-Y., Orkin, S. H., Ploemacher, R., Hendriks, R. W., & Dzierzak, E. (2004) · The Journal of Experimental Medicine · doi:10.1084/jem.20031556 · Cited by 316
Haploinsufficiency of GATA-2 perturbs adult hematopoietic stem-cell homeostasis
Rodrigues, N. P. (2005) · Blood · doi:10.1182/blood-2004-08-2989 · Cited by 297
Niches that regulate stem cells and hematopoiesis in adult bone marrow
Comazzetto, S., Shen, B., & Morrison, S. J. (2021) · Developmental Cell · doi:10.1016/j.devcel.2021.05.018 · Cited by 289
Caiado, F., Pietras, E. M., & Manz, M. G. (2021) · Journal of Experimental Medicine · doi:10.1084/jem.20201541 · Cited by 289
Takizawa, H., Fritsch, K., Kovtonyuk, L. V., Saito, Y., Yakkala, C., Jacobs, K., Ahuja, A. K., Lopes, M., Hausmann, A., Hardt, W.-D., et al. (2017) · Cell Stem Cell · doi:10.1016/j.stem.2017.06.013 · Cited by 273
Hsu, A. P., Johnson, K. D., Falcone, E. L., Sanalkumar, R., Sanchez, L. A., Hickstein, D. D., Cuellar‐Rodríguez, J., Lemieux, J. E., Zerbe, C. S., Bresnick, E. H., et al. (2013) · Blood · doi:10.1182/blood-2012-08-452763 · Cited by 251
Self-citationThe hematopoietic stem cell niche: from embryo to adult
Gao, X., Xu, C., Asada, N., & Frenette, P. S. (2018) · Development · doi:10.1242/dev.139691 · Cited by 247
5-Fluorouracil spares hemopoietic stem cells responsible for long-term repopulation.
Lerner, C. P., & Harrison, D. E. (1990) · PubMed · Cited by 238
Ngkelo, A., Meja, K., Yeadon, M., Adcock, I., & Kirkham, P. A. (2012) · Journal of Inflammation · doi:10.1186/1476-9255-9-1 · Cited by 238
Abascal, F., Acosta, R., Addleman, N. J., Adrian, J., Afzal, V., Aken, B. L., Ai, R., Akiyama, J. A., Jammal, O. A., Amrhein, H., et al. (2020) · Nature · doi:10.1038/s41586-020-2449-8 · Cited by 230
Self-citationThe evolution of cellular deficiency in GATA2 mutation
Dickinson, R. E., Milne, P., Jardine, L., Zandi, S., Swierczek, S. I., McGovern, N. N., Cookson, S., Ferozepurwalla, Z., Langridge, A., Pagan, S., et al. (2013) · Blood · doi:10.1182/blood-2013-07-517151 · Cited by 212
Cis-element mutated in GATA2-dependent immunodeficiency governs hematopoiesis and vascular integrity
Johnson, K. D., Hsu, A. P., Ryu, M., Wang, J., Gao, X., Boyer, M. E., Liu, Y., Lee, Y.-S., Calvo, K. R., Keleş, S., et al. (2012) · Journal of Clinical Investigation · doi:10.1172/jci61623 · Cited by 191
Self-citationThe GATA factor revolution in hematology
Katsumura, K. R., Bresnick, E. H., & the GATA Factor Mechanisms Group (2017) · Blood · doi:10.1182/blood-2016-09-687871 · Cited by 187
Self-citationNatural history of GATA2 deficiency in a survey of 79 French and Belgian patients
Donadieu, J., Lamant, M., Fieschi, C., de Fontbrune, F. S., Caye‐Eude, A., Ouachée-Chardin, M., Beaupain, B., Bustamante, J. C., Poirel, H. A., Isidor, B., et al. (2018) · Haematologica · doi:10.3324/haematol.2017.181909 · Cited by 183
Yokomizo, T., Yamada-Inagawa, T., Yzaguirre, A. D., Chen, M. J., Speck, N. A., & Dzierzak, E. A. (2012) · Nature Protocols · doi:10.1038/nprot.2011.441 · Cited by 171
Advances in germline predisposition to acute leukaemias and myeloid neoplasms
Klco, J. M., & Mullighan, C. G. (2020) · Nature reviews. Cancer · doi:10.1038/s41568-020-00315-z · Cited by 167
Gata2 cis-element is required for hematopoietic stem cell generation in the mammalian embryo
Gao, X., Johnson, K. D., Chang, Y., Boyer, M. E., Dewey, C. N., Zhang, J., & Bresnick, E. H. (2013) · The Journal of Experimental Medicine · doi:10.1084/jem.20130733 · Cited by 163
Self-citationClinGen Myeloid Malignancy Variant Curation Expert Panel recommendations for germline RUNX1 variants
Luo, X., Feurstein, S. K., Mohan, S., Porter, C. C., Jackson, S. A., Keel, S., Chicka, M. C., Brown, A. L., Kesserwan, C. A., Agarwal, A., et al. (2019) · Blood Advances · doi:10.1182/bloodadvances.2019000644 · Cited by 159
Genetic predisposition to MDS: clinical features and clonal evolution
Kennedy, A. L., & Shimamura, A. (2019) · Blood · doi:10.1182/blood-2018-10-844662 · Cited by 157
Conditional Gata2 inactivation results in HSC loss and lymphatic mispatterning
Lim, K.-C., Hosoya, T., Brandt, W. D., Ku, C.-J., Hosoya-Ohmura, S., Camper, S. A., Yamamoto, M. P., & Engel, J. D. (2012) · Journal of Clinical Investigation · doi:10.1172/jci61619 · Cited by 154
GATA2 deficiency-associated bone marrow disorder differs from idiopathic aplastic anemia.
Ganapathi, K. A., Townsley, D., Hsu, A. P., Arthur, D., Zerbe, C. S., Cuellar-Rodríguez, J., Hickstein, D., Rosenzweig, S., Braylan, R., Young, N., et al. (2015) · Blood · doi:10.1182/blood-2014-06-580340 · Cited by 153
Schuettpelz, L. G., Borgerding, J. N., Christopher, M. J., Gopalan, P. K., Romine, M. P., Herman, A., Woloszynek, J. R., Greenbaum, A. M., & Link, D. C. (2014) · Leukemia · doi:10.1038/leu.2014.68 · Cited by 145
Im, H., Grass, J. A., Johnson, K. D., Kim, S., Boyer, M. E., Imbalzano, A. N., Bieker, J. J., & Bresnick, E. H. (2005) · Proceedings of the National Academy of Sciences · doi:10.1073/pnas.0506164102 · Cited by 126
Self-citationGenetic framework for GATA factor function in vascular biology
Linnemann, A. K., O’Geen, H., Keleş, S., Farnham, P., & Bresnick, E. H. (2011) · Proceedings of the National Academy of Sciences · doi:10.1073/pnas.1108440108 · Cited by 117
Self-citationAGata2intronic enhancer confers its pan-endothelia-specific regulation
Khandekar, M. J., Brandt, W. D., Zhou, Y., Dagenais, S. L., Glover, T. W., Suzuki, N., Shimizu, R., Yamamoto, M. P., Lim, K.-C., & Engel, J. D. (2007) · Development · doi:10.1242/dev.001297 · Cited by 96
Heterogeneity of the bone marrow niche
Yu, V. W. C., & Scadden, D. T. (2016) · Current Opinion in Hematology · doi:10.1097/moh.0000000000000265 · Cited by 92
Human GATA2 mutations and hematologic disease: how many paths to pathogenesis?
Bresnick, E. H., Jung, M. M., & Katsumura, K. R. (2020) · Blood Advances · doi:10.1182/bloodadvances.2020002953 · Cited by 81
Self-citationDynamic GATA Factor Interplay at a Multicomponent Regulatory Region of the GATA-2 Locus
Martowicz, M. L., Grass, J. A., Boyer, M. E., Guend, H., & Bresnick, E. H. (2004) · Journal of Biological Chemistry · doi:10.1074/jbc.m406038200 · Cited by 79
Self-citationEpigenetically coordinated GATA2 binding is necessary for endothelium‐specific endomucin expression
Kanki, Y., Kohro, T., Jiang, S. S., Tsutsumi, S., Mimura, I., Suehiro, J., Wada, Y., Ohta, Y., Ihara, S., Iwanari, H., et al. (2011) · The EMBO Journal · doi:10.1038/emboj.2011.173 · Cited by 79
Cis-regulatory mechanisms governing stem and progenitor cell transitions
Johnson, K. D., Kong, G., Gao, X., Chang, Y., Hewitt, K. J., Sanalkumar, R., Prathibha, R., Ranheim, E. A., Dewey, C. N., Zhang, J., et al. (2015) · Science Advances · doi:10.1126/sciadv.1500503 · Cited by 67
Self-citationMolecular Hallmarks of Endogenous Chromatin Complexes Containing Master Regulators of Hematopoiesis
Wozniak, R. J., Keleş, S., Lugus, J. J., Young, K. H., Boyer, M. E., Tran, T. M., Choi, K., & Bresnick, E. H. (2008) · Molecular and Cellular Biology · doi:10.1128/mcb.01061-08 · Cited by 63
Self-citationTranscription factor mutations as a cause of familial myeloid neoplasms
Churpek, J. E., & Bresnick, E. H. (2019) · Journal of Clinical Investigation · doi:10.1172/jci120854 · Cited by 60
Self-citationGATA2 monoallelic expression underlies reduced penetrance in inherited GATA2-mutated MDS/AML
Seraihi, A. A., Rio‐Machín, A., Tawana, K., Bödör, C., Wang, J., Nagano, A., Heward, J. A., Iqbal, S., Best, S., Lea, N. C., et al. (2018) · Leukemia · doi:10.1038/s41375-018-0134-9 · Cited by 59
Context-dependent GATA Factor Function
Wozniak, R. J., Boyer, M. E., Grass, J. A., Lee, Y., & Bresnick, E. H. (2007) · Journal of Biological Chemistry · doi:10.1074/jbc.m700792200 · Cited by 57
Self-citationSingle-nucleotide human disease mutation inactivates a blood-regenerative GATA2 enhancer
Soukup, A. A., Zheng, Y., Mehta, C., Wu, J., Liu, P., Cao, M., Hofmann, I., Zhou, Y., Zhang, J., Johnson, K. D., et al. (2019) · Journal of Clinical Investigation · doi:10.1172/jci122694 · Cited by 56
Self-citationQuinton, L. J., Nelson, S., Boé, D. M., Zhang, P., Zhong, Q., Kolls, J. K., & Bagby, G. J. (2002) · The Journal of Infectious Diseases · doi:10.1086/340504 · Cited by 53
Context-dependent function of “GATA switch” sites in vivo
Snow, J. W., Trowbridge, J. J., Johnson, K. D., Fujiwara, T., Emambokus, N. E., Grass, J. A., Orkin, S. H., & Bresnick, E. H. (2011) · Blood · doi:10.1182/blood-2010-10-313031 · Cited by 53
Self-citationA Single cis Element Maintains Repression of the Key Developmental Regulator Gata2
Snow, J. W., Trowbridge, J. J., Fujiwara, T., Emambokus, N. E., Grass, J. A., Orkin, S. H., & Bresnick, E. H. (2010) · PLoS Genetics · doi:10.1371/journal.pgen.1001103 · Cited by 52
Self-citationIntegrating Enhancer Mechanisms to Establish a Hierarchical Blood Development Program
Mehta, C., Johnson, K. D., Gao, X., Ong, I. M., Katsumura, K. R., McIver, S. C., Ranheim, E. A., & Bresnick, E. H. (2017) · Cell Reports · doi:10.1016/j.celrep.2017.08.090 · Cited by 51
Self-citationMDS-associated mutations in germline GATA2 mutated patients with hematologic manifestations
McReynolds, L. J., Yang, Y., Wong, H. Y., Tang, J., Zhang, Y., Mulè, M. P., Daub, J. R., Palmer, C. L., Foruraghi, L., Liu, Q., et al. (2018) · Leukemia Research · doi:10.1016/j.leukres.2018.11.013 · Cited by 47
Mechanism governing a stem cell-generating cis -regulatory element
Sanalkumar, R., Johnson, K. D., Gao, X., Boyer, M. E., Chang, Y., Hewitt, K. J., Zhang, J., & Bresnick, E. H. (2014) · Proceedings of the National Academy of Sciences · doi:10.1073/pnas.1400065111 · Cited by 46
Self-citationRegulation of the hematopoietic stem cell lifecycle by the endothelial niche
Ramalingam, P., Poulos, M. G., & Butler, J. M. (2017) · Current Opinion in Hematology · doi:10.1097/moh.0000000000000350 · Cited by 45
Wu, Z., Gao, S., Diamond, C. E., Kajigaya, S., Chen, J., Shi, R., Palmer, C. L., Hsu, A. P., Calvo, K. R., Hickstein, D. D., et al. (2020) · Blood Advances · doi:10.1182/bloodadvances.2019001352 · Cited by 44
Johnson, K. D., Conn, D. J., Shishkova, E., Katsumura, K. R., Liu, P., Shen, S., Ranheim, E. A., Kraus, S. G., Wang, W., Calvo, K. R., et al. (2020) · The Journal of Experimental Medicine · doi:10.1084/jem.20191526 · Cited by 44
Self-citationBresnick, E. H., & Johnson, K. D. (2019) · Blood Advances · doi:10.1182/bloodadvances.2019000378 · Cited by 32
Self-citationETV2/ER71 regulates hematopoietic regeneration by promoting hematopoietic stem cell proliferation
Xu, C., Lee, T., Sakurai, N., Krchma, K., Liu, F., Li, D., Wang, T., & Choi, K. (2017) · The Journal of Experimental Medicine · doi:10.1084/jem.20160923 · Cited by 30
Acute lymphoblastic leukemia in a patient with MonoMAC syndrome/GATA2 haploinsufficiency
Koegel, A. K., Hofmann, I., Moffitt, K. L., Degar, B. A., Duncan, C., & Tubman, V. N. (2016) · Pediatric Blood & Cancer · doi:10.1002/pbc.26084 · Cited by 28
Germline mutations in MDS/AML predisposition disorders
Godley, L. A. (2020) · Current Opinion in Hematology · doi:10.1097/moh.0000000000000633 · Cited by 24
Silva, M. C. D. A., Katsumura, K. R., Mehta, C., Velloso, E. D. R. P., Bresnick, E. H., & Godley, L. A. (2020) · Leukemia · doi:10.1038/s41375-020-0820-2 · Cited by 18
Self-citationDissecting Regulatory Mechanisms Using Mouse Fetal Liver-Derived Erythroid Cells
McIver, S. C., Hewitt, K. J., Gao, X., Mehta, C., Zhang, J., & Bresnick, E. H. (2017) · Methods in molecular biology · doi:10.1007/978-1-4939-7428-3_4 · Cited by 17
Self-citationGATA2 +9.5 enhancer: from principles of hematopoiesis to genetic diagnosis in precision medicine
Soukup, A. A., & Bresnick, E. H. (2020) · Current Opinion in Hematology · doi:10.1097/moh.0000000000000576 · Cited by 15
Self-citation
Cited by
Bogeska, R., Mikecin, A.-M., Kaschutnig, P., Fawaz, M., Büchler-Schäff, M., Le, D., Ganuza, M., Vollmer, A., Paffenholz, S. V., Asada, N., et al. (2022) · Cell Stem Cell · doi:10.1016/j.stem.2022.06.012 · Cited by 299
Metadata
- Authors
- Soukup, A. A., Matson, D. R., Liu, P., Johnson, K. D., & Bresnick, E. H.
- Affiliations
- Wisconsin Blood Cancer Research Institute, Department of Cell and Regenerative Biology, Wisconsin Institutes for Medical Research, University of Wisconsin School of Medicine and Public Health, Madison, WI, USA.
- University of Wisconsin Carbone Cancer Center, Department of Biostatistics and Medical Informatics, University of Wisconsin School of Medicine and Public Health, Madison, WI, USA.
- Venue
- Science Advances
- Published
- 2021-12-10
- Volume
- 7
- Issue
- 50
- ISSN
- 2375-2548
- PMC
- PMC8664263
- Cited by
- 15
- References
- 63
- Language
- en
About these checks
Registry, retraction, Cites and statistics results are computed, not judged, with one exception: a printed reference that no index lists is read once by a model before it counts as a citation error. Claims are extracted by a model and kept only when their quote appears verbatim in the text; each cited source is then checked, with a model’s help, for whether it says what the claim relies on. Those verdicts can be wrong — read the claim’s quote and the cited source before relying on one.
Statistics and arithmetic are recomputed, not judged.
Confidence bands are shown only for fields calibrated on our annotated test set. None is calibrated yet, so no band is shown.
What counts as a claim ›How we measure confidence ›How we check this ›
Are you an author, or do you see a problem with this page? Request a review
Data sources
Bibliographic data: Semantic Scholar, OpenAlex, Crossref.
Contains information from the Semantic Scholar Academic Graph Datasets, made available under the ODC Attribution License (ODC-BY 1.0).
Semantic Scholar’s data is described in: Kinney, R., et al. (2023). The Semantic Scholar Open Data Platform. arXiv:2301.10140.
