Cited by 68

The DOI matches its Crossref record; 2 of the 2 references it cites were found in a registry or an index.

Premature aging in mice with error-prone protein synthesis

Shcherbakov, Dimitri, Nigri, Martina, Akbergenov, Rashid, Brilkova, Margarita, Mantovani, Matilde, Petit, Patricia Isnard, Grimm, Amandine, Karol, Agnieszka A., Teo, Youjin, Sanchón, Adrián Cortés, Kumar, Yadhu, Eckert, Anne, Thiam, Kader, Seebeck, Petra, Wolfer, David P., Böttger, Erik C.·2022·Science Advances

Abstract

The main source of error in gene expression is messenger RNA decoding by the ribosome. Translational accuracy has been suggested on a purely correlative basis to positively coincide with maximum possible life span among different rodent species, but causal evidence that translation errors accelerate aging in vivo and limit life span is lacking. We have now addressed this question experimentally by creating heterozygous knock-in mice that express the ribosomal ambiguity mutation RPS9 D95N, resulting in genome-wide error-prone translation. Here, we show that Rps9 D95N knock-in mice exhibit reduced life span and a premature onset of numerous aging-related phenotypes, such as reduced weight, chest deformation, hunchback posture, poor fur condition, and urinary syndrome, together with lymphopenia, increased levels of reactive oxygen species–inflicted damage, accelerated age-related changes in DNA methylation, and telomere attrition. Our results provide an experimental link between translational accuracy, life span, and aging-related phenotypes in mammals.

Overview

The claims and statistics of this paper haven’t been checked yet.

Run the check — free, no account needed. It reads the open-access text and checks the sources it cites.

A few free checks a day · papers already verified open instantly · results are public

Integrity signals

Registry

Crossref · 10.1126/sciadv.abl9051

Cites

2 of 2 references verified0 citation errors · 0 not checkable

Statistics

Figures

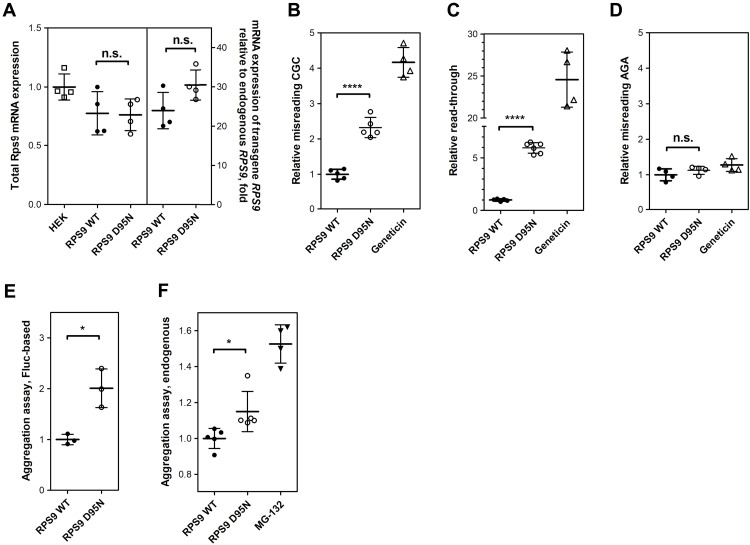
Fig. 1. Characterization of Rps9 D95N mutant cells. (A) Rps9 mRNA expression measured using TaqMan qRT-PCR. Data shown represent the average of four independent experiments (N = 4 clones each for RPS9 WT and D95N; ± SEM). Left, total expression of Rps9 mRNA in Rps9-transfected cells compared to untransfected HEK WT; right, relative expression of transgenic Rps9 mRNA in comparison to endogenous Rps9 mRNA in Rps9-transfected cells, fold change. (B to D) Mistranslation assays using dual-luciferase system. (B) Misincorporation of near-cognate aa-tRNA, (C) read-through, and (D) misincorporation of noncognate aa-tRNA. Results are derived from the ratio hFluc/hRluc, given in fold induction. Rps9 WT cells are set as 1 (N = 6 clones each for Rps9 WT and D95N; ± SEM); geneticin is used as a positive control. (E) Firefly luciferase–based protein aggregation assay. The data shown represent the quantification of band intensities from three independent experiments (N = 3 clones each for Rps9 WT and D95N; ± SEM). A representative Western blot can be found in fig. S3G. (F) Aggregation of endogenous cellular proteins assessed by a PROTEOSTAT aggresome detection kit (N = 5 clones each for Rps9 WT and D95N; ± SEM). Treatment with the proteasome inhibitor MG-132 was used as a positive control. *P < 0.05 and ****P < 0.0001.
Fig. 1. Characterization of Rps9 D95N mutant cells. (A) Rps9 mRNA expression measured using TaqMan qRT-PCR. Data shown represent the average of four independent experiments (N = 4 clones each for RPS9 WT and D95N; ± SEM). Left, total expression of Rps9 mRNA in Rps9-transfected cells compared to untransfected HEK WT; right, relative expression of transgenic Rps9 mRNA in comparison to endogenous Rps9 mRNA in Rps9-transfected cells, fold change. (B to D) Mistranslation assays using dual-luciferase system. (B) Misincorporation of near-cognate aa-tRNA, (C) read-through, and (D) misincorporation of noncognate aa-tRNA. Results are derived from the ratio hFluc/hRluc, given in fold induction. Rps9 WT cells are set as 1 (N = 6 clones each for Rps9 WT and D95N; ± SEM); geneticin is used as a positive control. (E) Firefly luciferase–based protein aggregation assay. The data shown represent the quantification of band intensities from three independent experiments (N = 3 clones each for Rps9 WT and D95N; ± SEM). A representative Western blot can be found in fig. S3G. (F) Aggregation of endogenous cellular proteins assessed by a PROTEOSTAT aggresome detection kit (N = 5 clones each for Rps9 WT and D95N; ± SEM). Treatment with the proteasome inhibitor MG-132 was used as a positive control. *P < 0.05 and ****P < 0.0001.CC BY · PubMed Central
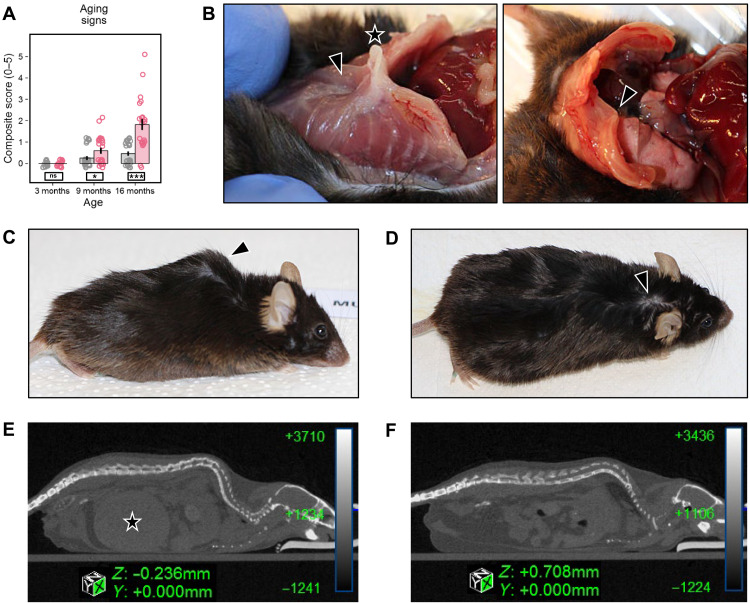
Fig. 2. Signs of premature aging in Rps9 D95N mice. (A) Composite score reflecting the presence or absence of five aging signs: chest deformation, hunchback posture, altered fur (alopecia, depigmentation, and scruffiness), eye problems (cataract and inflammation), and poor body condition [genotype: F1,116 = 27.89, P < 0.0001, η2 = 0.19; age: F1,116 = 59.12, P < 0.0001, η2 = 0.34; genotype × age: F1,116 = 23.16, P < 0.0001, η2 = 0.17; genotype × sex: F1,116 = 3.504, P = 0.0637, η2 = 0.03; genotype × sex × age: F1,116 = 1.363, not significant (ns)]. Red, Rps9 D95N mutants; gray, WT. Mean, SE, and individual data points plotted with vertical and horizontal jittering. Genotype split post hoc by age: ***P < 0.001, *P < 0.05, ns P ≥ 0.1. Number of animals: 3-month WT, 8 F/8 M; Rps9 D95N, 8 F/8 M; 9-month WT, 12 F/12 M; Rps9 D95N, 10 F/12 M; 16-month WT, 12 F/12 M; Rps9 D95N, 9 F/13 M. (B) Chest deformities were observed only in the oldest age cohort (1 of 24 WT, 16 of 22 Rps9 D95N; χ2 test, P < 0.0001). Left, indented sternum (arrowhead) with protruding xiphoid (star); right, asymmetrical chest with deformed ribs (arrowhead). (C) Rps9 D95N mouse showing typical hunchback posture. (D) Poor fur condition with bald patches in a Rps9 D95N mouse (arrowhead). (E and F) Mouse urinary syndrome: micro-CT images of a 17-month male Rps9 D95N mutant (E) and a 17-month male WT mouse (F). The Rps9 D95N mouse shows a massively filled bladder (star), while the bladder is empty and thus invisible in the WT mouse.
Fig. 2. Signs of premature aging in Rps9 D95N mice. (A) Composite score reflecting the presence or absence of five aging signs: chest deformation, hunchback posture, altered fur (alopecia, depigmentation, and scruffiness), eye problems (cataract and inflammation), and poor body condition [genotype: F1,116 = 27.89, P < 0.0001, η2 = 0.19; age: F1,116 = 59.12, P < 0.0001, η2 = 0.34; genotype × age: F1,116 = 23.16, P < 0.0001, η2 = 0.17; genotype × sex: F1,116 = 3.504, P = 0.0637, η2 = 0.03; genotype × sex × age: F1,116 = 1.363, not significant (ns)]. Red, Rps9 D95N mutants; gray, WT. Mean, SE, and individual data points plotted with vertical and horizontal jittering. Genotype split post hoc by age: ***P < 0.001, *P < 0.05, ns P ≥ 0.1. Number of animals: 3-month WT, 8 F/8 M; Rps9 D95N, 8 F/8 M; 9-month WT, 12 F/12 M; Rps9 D95N, 10 F/12 M; 16-month WT, 12 F/12 M; Rps9 D95N, 9 F/13 M. (B) Chest deformities were observed only in the oldest age cohort (1 of 24 WT, 16 of 22 Rps9 D95N; χ2 test, P < 0.0001). Left, indented sternum (arrowhead) with protruding xiphoid (star); right, asymmetrical chest with deformed ribs (arrowhead). (C) Rps9 D95N mouse showing typical hunchback posture. (D) Poor fur condition with bald patches in a Rps9 D95N mouse (arrowhead). (E and F) Mouse urinary syndrome: micro-CT images of a 17-month male Rps9 D95N mutant (E) and a 17-month male WT mouse (F). The Rps9 D95N mouse shows a massively filled bladder (star), while the bladder is empty and thus invisible in the WT mouse.CC BY · PubMed Central
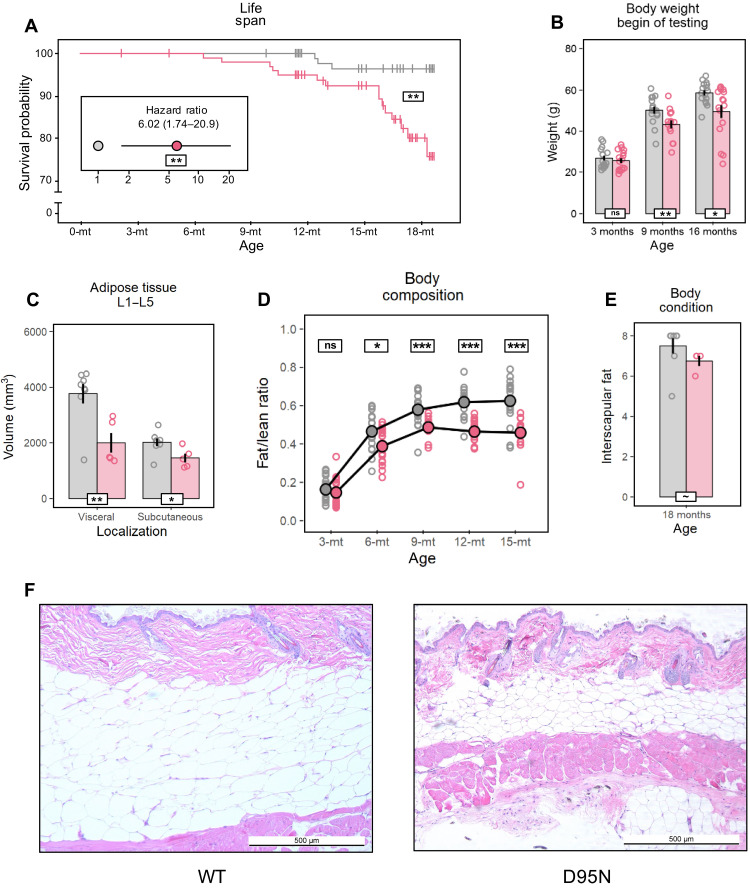
Fig. 3. Reduced life span and altered body composition in Rps9 D95N mice. Graphs in (B) to (D) and (F) show untransformed mean, SE, and individual data points. Red, Rps9 D95N mutants; gray, WT. Genotype effect overall or split post hoc by age (white boxes) or age effect split post hoc by genotype (colored boxes): ***P < 0.001, **P < 0.01, *P < 0.05, ~P < 0.1, ns P ≥ 0.1. (A) Effect of the Rps9 D95N mutation on survival (Kaplan-Meier: P = 0.0017) and hazard ratio of Rps9 D95N versus WT mice (inset, Cox proportional hazards model: P = 0.005). Number of animals: WT, 66 F/60 M; Rps9 D95N, 59 F/60 M. (B) Body weight (genotype: F1,86 = 14.09, P = 0.0003, η2 = 0.14; age: F1,86 = 214.9, P < 0.0001, η2 = 0.71; genotype × age: F1,86 = 4.348, P = 0.0400, η2 = 0.05). Number of animals: 3-month WT, 8 F/8 M; Rps9 D95N, 8 F/8 M; 9-month WT, 8 F/8 M; Rps9 D95N, 6 F/8 M; 16-month WT, 8 F/8 M; Rps9 D95N, 8 F/8 M. (C) Adipose tissue distribution in 18-month male mice determined at levels L1 to L5 by micro-CT imaging (genotype visceral: F1,11 = 11.20, P = 0.0065; subcutaneous: F1,11 = 6.756, P = 0.0247). Number of animals: WT, 8 M; Rps9 D95N, 5 M. (D) Repeated estimates of fat/lean mass ratio in male mice (age: F1,508 = 913.3, P < 0.0001, η2 = 0.49; genotype: F1,33 = 17.09, P = 0.0002, η2 = 0.32; genotype × age: F1,138 = 4.300, P = 0.0400, η2 = 0.02; Box-Cox λ-1.00 @ 0.03500). Number of animals: WT, 18 M; Rps9 D95N, 18 M. (E) Interscapular fat score in male mice at sacrifice (genotype: F1,10 = 3.586, P = 0.0875, η2 = 0.18; Box-Cox λ 2.50 @ 4.0000). Number of animals: WT, 8 M; Rps9 D95N, 4 M. (F) Representative hematoxylin and eosin–stained cross section of dorsal skin (interscapular area, ×50 magnification) from 18-month male WT (left) and Rps9 D95N mice (right).
Fig. 3. Reduced life span and altered body composition in Rps9 D95N mice. Graphs in (B) to (D) and (F) show untransformed mean, SE, and individual data points. Red, Rps9 D95N mutants; gray, WT. Genotype effect overall or split post hoc by age (white boxes) or age effect split post hoc by genotype (colored boxes): ***P < 0.001, **P < 0.01, *P < 0.05, ~P < 0.1, ns P ≥ 0.1. (A) Effect of the Rps9 D95N mutation on survival (Kaplan-Meier: P = 0.0017) and hazard ratio of Rps9 D95N versus WT mice (inset, Cox proportional hazards model: P = 0.005). Number of animals: WT, 66 F/60 M; Rps9 D95N, 59 F/60 M. (B) Body weight (genotype: F1,86 = 14.09, P = 0.0003, η2 = 0.14; age: F1,86 = 214.9, P < 0.0001, η2 = 0.71; genotype × age: F1,86 = 4.348, P = 0.0400, η2 = 0.05). Number of animals: 3-month WT, 8 F/8 M; Rps9 D95N, 8 F/8 M; 9-month WT, 8 F/8 M; Rps9 D95N, 6 F/8 M; 16-month WT, 8 F/8 M; Rps9 D95N, 8 F/8 M. (C) Adipose tissue distribution in 18-month male mice determined at levels L1 to L5 by micro-CT imaging (genotype visceral: F1,11 = 11.20, P = 0.0065; subcutaneous: F1,11 = 6.756, P = 0.0247). Number of animals: WT, 8 M; Rps9 D95N, 5 M. (D) Repeated estimates of fat/lean mass ratio in male mice (age: F1,508 = 913.3, P < 0.0001, η2 = 0.49; genotype: F1,33 = 17.09, P = 0.0002, η2 = 0.32; genotype × age: F1,138 = 4.300, P = 0.0400, η2 = 0.02; Box-Cox λ-1.00 @ 0.03500). Number of animals: WT, 18 M; Rps9 D95N, 18 M. (E) Interscapular fat score in male mice at sacrifice (genotype: F1,10 = 3.586, P = 0.0875, η2 = 0.18; Box-Cox λ 2.50 @ 4.0000). Number of animals: WT, 8 M; Rps9 D95N, 4 M. (F) Representative hematoxylin and eosin–stained cross section of dorsal skin (interscapular area, ×50 magnification) from 18-month male WT (left) and Rps9 D95N mice (right).CC BY · PubMed Central
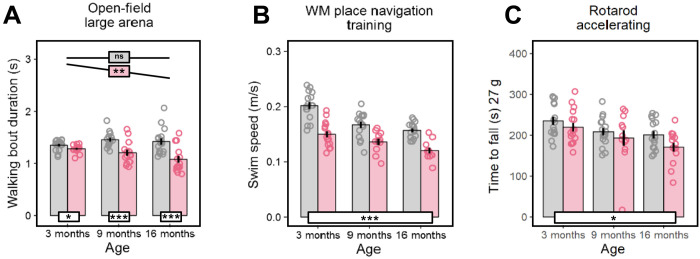
Fig. 4. Deficient motor function in Rps9 D95N mice. Graphs show untransformed mean, SE, and individual data points. Red, Rps9 D95N mutants; gray, WT. Genotype effect overall or split post hoc by age (white boxes) or age effect split post hoc by genotype (colored boxes): ***P < 0.001, *P < 0.05, ~P < 0.1, ns P ≥ 0.1. (A) Average duration of walking bouts in the large open-field arena (genotype: F1,83 = 35.12, P < 0.0001, η2 = 0.30; age: F1,83 = 4.191, P = 0.0438, η2 = 0.05; genotype × age: F1,83 = 10.77, P = 0.0015, η2 = 0.11; Box-Cox λ = −0.50). (B) Average swim speed during testing in a water-maze (WM) task (genotype: F1,78 = 72.33, P < 0.0001, η2 = 0.48; age: F1,78 = 48.81, P < 0.0001, η2 = 0.38; genotype × age: F1,78 = 1.805, ns). (C) Time to fall off the accelerating rotarod, averaged over five trials and normalized by regression to a body weight of 27 g (genotype: F1,82 = 4.453, P = 0.0379, η2 = 0.05; age: F1,82 = 14.54, P = 0.0003, η2 = 0.15; genotype × age: F1,82 = 0.489, ns). Number of animals (A to C): 3-month WT, 8 F/8 M; Rps9 D95N, 8 F/8 M; 9-month WT, 8 F/8 M; Rps9 D95N, 6 F/8 M; 16-month WT, 8 F/8 M; Rps9 D95N, 8 F/8 M.
Fig. 4. Deficient motor function in Rps9 D95N mice. Graphs show untransformed mean, SE, and individual data points. Red, Rps9 D95N mutants; gray, WT. Genotype effect overall or split post hoc by age (white boxes) or age effect split post hoc by genotype (colored boxes): ***P < 0.001, *P < 0.05, ~P < 0.1, ns P ≥ 0.1. (A) Average duration of walking bouts in the large open-field arena (genotype: F1,83 = 35.12, P < 0.0001, η2 = 0.30; age: F1,83 = 4.191, P = 0.0438, η2 = 0.05; genotype × age: F1,83 = 10.77, P = 0.0015, η2 = 0.11; Box-Cox λ = −0.50). (B) Average swim speed during testing in a water-maze (WM) task (genotype: F1,78 = 72.33, P < 0.0001, η2 = 0.48; age: F1,78 = 48.81, P < 0.0001, η2 = 0.38; genotype × age: F1,78 = 1.805, ns). (C) Time to fall off the accelerating rotarod, averaged over five trials and normalized by regression to a body weight of 27 g (genotype: F1,82 = 4.453, P = 0.0379, η2 = 0.05; age: F1,82 = 14.54, P = 0.0003, η2 = 0.15; genotype × age: F1,82 = 0.489, ns). Number of animals (A to C): 3-month WT, 8 F/8 M; Rps9 D95N, 8 F/8 M; 9-month WT, 8 F/8 M; Rps9 D95N, 6 F/8 M; 16-month WT, 8 F/8 M; Rps9 D95N, 8 F/8 M.CC BY · PubMed Central
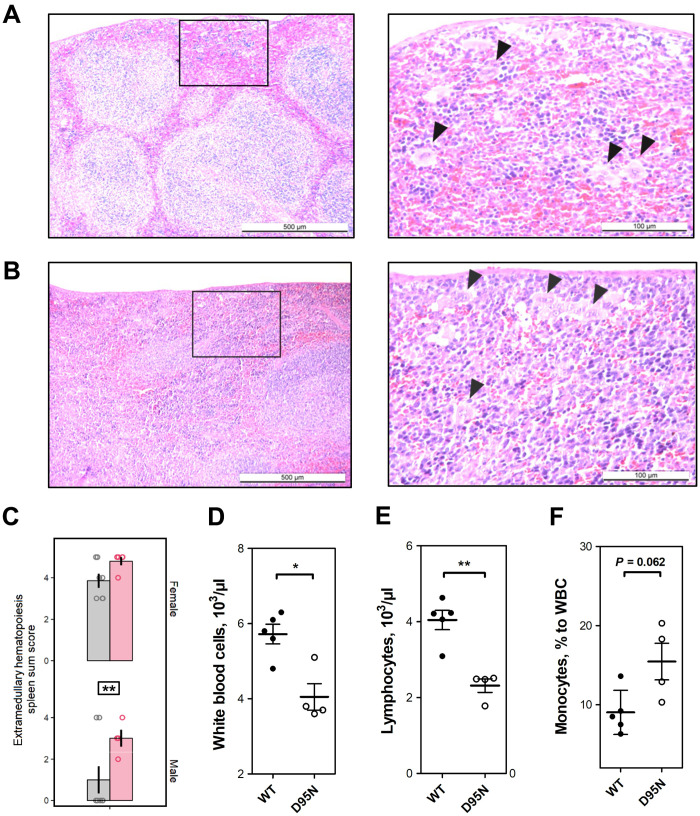
Fig. 5. Hematopoietic alterations in Rps9 D95N mutant mice. (A and B) Representative hematoxylin and eosin–stained section from the spleen of Rps9 D95N mutant mice at 18 months of age; increased extramedullary hematopoiesis (EMH) is present in Rps9 D95N mice (left: magnification ×50; right: magnification ×200). (A) Male Rps9 D95N animal (score sum 3); (B) female Rps9 D95N animal (score sum 5). EMH consists of groups of hematopoietic and myelopoietic cells spread within an area (quadrant in ×50 magnification); black arrows (in ×200 magnification) point toward megakaryocytes as the morphologically distinguishable characteristic of hematopoietic activity. (C) Extramedullary hematopoiesis in Rps9 D95N mice at 18 months of age. Red, Rps9 D95N; gray, WT. Untransformed mean, SE, and individual data points of sum score reflecting grade and distribution of EMH in the spleen (genotype: F1,20 = 8.734, P = 0.0078, η2 = 0.24; genotype × sex: F1,21 = 0.146, ns; Box-Cox λ 2.00 @ 0.00000). Genotype: **P < 0.01. Number of animals: WT, 7 F/8 M; Rps9 D95N, 5 F/4 M. (D to F) Blood count analysis in female WT and Rps9 D95N mice. (D) Number of white blood cells per microliter. (E) Number of lymphocytes per microliter. (F) Monocytes relative to white blood cells (WBC) (%). *P < 0.05 and **P < 0.01.
Fig. 5. Hematopoietic alterations in Rps9 D95N mutant mice. (A and B) Representative hematoxylin and eosin–stained section from the spleen of Rps9 D95N mutant mice at 18 months of age; increased extramedullary hematopoiesis (EMH) is present in Rps9 D95N mice (left: magnification ×50; right: magnification ×200). (A) Male Rps9 D95N animal (score sum 3); (B) female Rps9 D95N animal (score sum 5). EMH consists of groups of hematopoietic and myelopoietic cells spread within an area (quadrant in ×50 magnification); black arrows (in ×200 magnification) point toward megakaryocytes as the morphologically distinguishable characteristic of hematopoietic activity. (C) Extramedullary hematopoiesis in Rps9 D95N mice at 18 months of age. Red, Rps9 D95N; gray, WT. Untransformed mean, SE, and individual data points of sum score reflecting grade and distribution of EMH in the spleen (genotype: F1,20 = 8.734, P = 0.0078, η2 = 0.24; genotype × sex: F1,21 = 0.146, ns; Box-Cox λ 2.00 @ 0.00000). Genotype: **P < 0.01. Number of animals: WT, 7 F/8 M; Rps9 D95N, 5 F/4 M. (D to F) Blood count analysis in female WT and Rps9 D95N mice. (D) Number of white blood cells per microliter. (E) Number of lymphocytes per microliter. (F) Monocytes relative to white blood cells (WBC) (%). *P < 0.05 and **P < 0.01.CC BY · PubMed Central
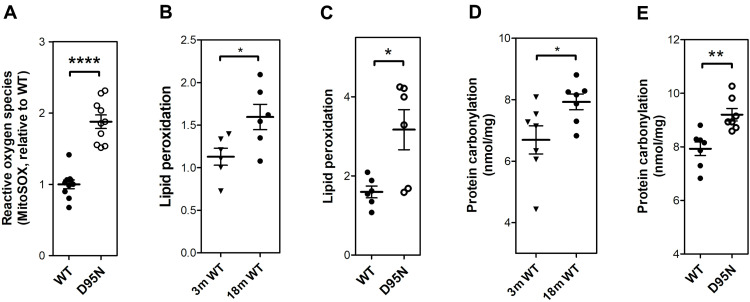
Fig. 6. Increased levels of ROS and ROS-inflicted damage in Rps9 D95N mutant mice. (A) Levels of mitochondrial ROS (superoxide anion radicals, MitoSOX assay) in skeletal muscle from mutant Rps9 D95N mice in comparison to WT mice (N = 10; ± SEM). (B) Lipid peroxidation levels measured by colorimetric assay in skeletal muscle from 3-month-old WT compared to 18-month-old WT mice (N = 6; ± SEM). (C) Lipid peroxidation levels measured by colorimetric assay in skeletal muscle from 18-month-old Rps9 D95N in comparison to age-matched WT mice (N = 6; ± SEM). (D) Protein carbonyl levels measured by enzyme-linked immunosorbent assay (ELISA) in heart tissue from 3-month-old WT compared to 18-month-old WT mice (N = 7; ± SEM). (E) Protein carbonyl levels measured by ELISA assay in heart tissue from 18-month-old WT and 18-month-old Rps9 D95N mice (N = 7; ± SEM). *P < 0.05, **P < 0.01, and ****P < 0.0001.
Fig. 6. Increased levels of ROS and ROS-inflicted damage in Rps9 D95N mutant mice. (A) Levels of mitochondrial ROS (superoxide anion radicals, MitoSOX assay) in skeletal muscle from mutant Rps9 D95N mice in comparison to WT mice (N = 10; ± SEM). (B) Lipid peroxidation levels measured by colorimetric assay in skeletal muscle from 3-month-old WT compared to 18-month-old WT mice (N = 6; ± SEM). (C) Lipid peroxidation levels measured by colorimetric assay in skeletal muscle from 18-month-old Rps9 D95N in comparison to age-matched WT mice (N = 6; ± SEM). (D) Protein carbonyl levels measured by enzyme-linked immunosorbent assay (ELISA) in heart tissue from 3-month-old WT compared to 18-month-old WT mice (N = 7; ± SEM). (E) Protein carbonyl levels measured by ELISA assay in heart tissue from 18-month-old WT and 18-month-old Rps9 D95N mice (N = 7; ± SEM). *P < 0.05, **P < 0.01, and ****P < 0.0001.CC BY · PubMed Central
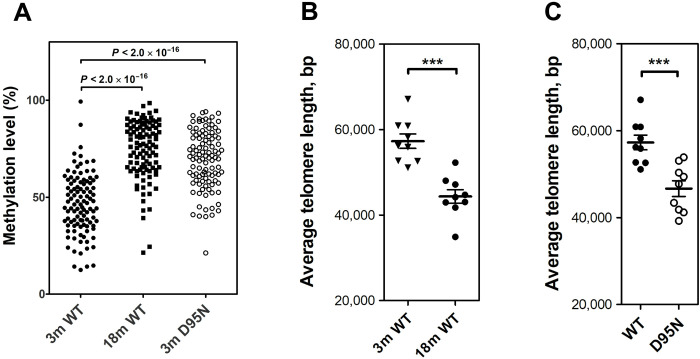
Fig. 7. Epigenetic changes indicative of premature aging in Rps9 D95N mutant mice. (A) Methylation levels (in %) of 104 age-related CpG sites in 3-month-old WT, 18-month-old WT, and 3-month-old Rps9 D95N mutants (N = 4 for each group, each point represents mean; for further details, see fig. S6). For statistical calculations, the Kruskal-Wallis one-way analysis of variance was used. (B) Length of telomeres in brain of 3-month-old WT compared to 18-month-old WT mice (N = 9; ± SEM). (C) Length of telomeres in brain of 3-month-old WT and Rps9 D95N mice (N = 9; ± SEM). ***P < 0.001.
Fig. 7. Epigenetic changes indicative of premature aging in Rps9 D95N mutant mice. (A) Methylation levels (in %) of 104 age-related CpG sites in 3-month-old WT, 18-month-old WT, and 3-month-old Rps9 D95N mutants (N = 4 for each group, each point represents mean; for further details, see fig. S6). For statistical calculations, the Kruskal-Wallis one-way analysis of variance was used. (B) Length of telomeres in brain of 3-month-old WT compared to 18-month-old WT mice (N = 9; ± SEM). (C) Length of telomeres in brain of 3-month-old WT and Rps9 D95N mice (N = 9; ± SEM). ***P < 0.001.CC BY · PubMed Central

Verification

Claims the paper makes

The claims and statistics of this paper haven’t been checked yet.

Run the check — free, no account needed. It reads the open-access text and checks the sources it cites.

A few free checks a day · papers already verified open instantly · results are public

Claims other papers make about this one

Each is checked against this paper’s own text: does it say what the citing paper says it does?

Self-check

Percentages, sums and reported differences re-computed from the paper’s own numbers.

The self-check needs the paper’s full text.

Citations

Cites

Show all 2 references

Research works printed but not linked: 61

  1. C. G. Kurland D. Hughes M. Ehrenberg Limitations of translational accuracy in Escherichia coli and Salmonella: Cellular and Molecular Biology F. C. Neidhardt R. Curtiss III J. L. Ingraham E. C. C. Lin K. B. Low B. Magasanik W. S. Reznikoff M. Riley M. Schaechter H. E. Umbarger Eds. (ASM Press 1996) vol. 1 pp. 979–1004.
  2. 10.1146/annurev.biochem.74.061903.155440 · DOI
  3. 10.1073/pnas.1313473110 · DOI
  4. 10.1111/acel.12628 · DOI · Paper page
  5. 10.7554/eLife.48847 · DOI
  6. Z. A. Medvedev, Aging of the body on the molecular level. Usp. Sovrem. Biol. 51, 299–316 (1961).
  7. 10.1073/pnas.49.4.517 · DOI
  8. 10.1073/pnas.74.8.3396 · DOI
  9. 10.1002/bies.950060109 · DOI
  10. 10.1016/0531-5565(89)90022-3 · DOI
  11. 10.1016/0531-5565(95)02022-5 · DOI
  12. 10.1038/ncb3184 · DOI
  13. 10.1126/science.aac4354 · DOI
  14. 10.1126/science.1355616 · DOI
  15. 10.1126/science.1141448 · DOI · Paper page
  16. 10.1126/science.aax3769 · DOI · Paper page
  17. 10.1073/pnas.0902882106 · DOI · Paper page
  18. 10.1038/s41580-019-0101-y · DOI · Paper page
  19. 10.1016/S1097-2765(04)00005-X · DOI
  20. 10.1016/j.jmb.2005.03.025 · DOI
  21. 10.1016/j.molcel.2010.06.009 · DOI
  22. 10.1016/j.cell.2009.01.036 · DOI
  23. 10.1038/s42003-019-0626-9 · DOI
  24. 10.1038/s42003-021-02204-z · DOI
  25. 10.1016/0022-2836(81)90490-3 · DOI
  26. 10.1093/genetics/132.2.375 · DOI
  27. 10.1371/journal.pgen.1002620 · DOI
  28. 10.1021/bi9615396 · DOI
  29. C. Pettan-Brewer, P. M. Treuting, Practical pathology of aging mice. Pathobiol. Aging Age Relat. Dis. 1, (2011).
  30. E. T. Gaillard Ureter urinary bladder and urethra in Pathology of the Mouse: Reference and Atlas R. R. Maronpot G. A. Boorman B. W. Gaul Eds. (Cache River Press 1999) pp. 235–258.
  31. 10.1080/019262301753385988 · DOI
  32. D. N. Kalu Handbook of Physiology Section 11 Aging E. J. Masoro Ed. (Oxford Univ. Press 1995).
  33. 10.1093/gerona/57.10.B359 · DOI
  34. 10.1046/j.1532-5415.51.3s.4.x · DOI
  35. 10.1093/geronj/11.3.298 · DOI · Paper page
  36. 10.1111/j.1532-5415.1972.tb00787.x · DOI
  37. 10.1016/j.cmet.2016.09.017 · DOI · Paper page
  38. 10.1073/pnas.100422497 · DOI
  39. 10.1098/rsob.180249 · DOI
  40. 10.1038/345458a0 · DOI · Paper page
  41. 10.1038/s41576-018-0004-3 · DOI · Paper page
  42. 10.1186/s13059-015-0584-6 · DOI · Paper page
  43. 10.1186/s13059-017-1186-2 · DOI
  44. 10.1111/ggi.13500 · DOI
  45. 10.18632/aging.101655 · DOI
  46. 10.1038/ng1727 · DOI
  47. 10.1038/nature05096 · DOI
  48. 10.1007/BF00292717 · DOI
  49. 10.1128/JB.185.16.5015-5018.2003 · DOI
  50. 10.1371/journal.pgen.1003810 · DOI
  51. 10.1006/meth.2001.1262 · DOI · Paper page
  52. 10.1073/pnas.1204073109 · DOI
  53. 10.1038/cddis.2015.108 · DOI
  54. 10.1017/S1355838298981080 · DOI
  55. 10.1093/nar/gkf457 · DOI
  56. 10.1042/BJ20141498 · DOI
  57. 10.1016/S1044-7431(03)00077-0 · DOI
  58. 10.1038/nprot.2006.478 · DOI · Paper page
  59. 10.1016/j.bbadis.2014.09.013 · DOI
  60. 10.1186/gb-2012-13-10-r87 · DOI
  61. 10.1093/nar/gkn1027 · DOI

Cited by

Sorted by citations

Metadata

Authors
Shcherbakov, D., Nigri, M., Akbergenov, R., Brilkova, M., Mantovani, M., Petit, P. I., Grimm, A., Karol, A. A., Teo, Y., Sanchón, A. C., Kumar, Y., Eckert, A., Thiam, K., Seebeck, P., Wolfer, D. P., & Böttger, E. C.
Affiliations
  • Institut für Medizinische Mikrobiologie, Universität Zürich, CH-8006 Zurich, Switzerland.
  • Anatomisches Institut, Universität Zürich, and Institut für Bewegungswissenschaften und Sport, ETH Zürich, CH-8057 Zurich, Switzerland.
  • genOway, F-69362 Lyon Cedex 07, France.
  • Universitäre Psychiatrische Kliniken Basel, Transfaculty Research Platform Molecular and Cognitive Neurosciences, CH-4055 Basel, Switzerland.
  • Musculoskeletal Research Unit (MSRU), Vetsuisse Faculty, University of Zurich, CH-8057 Zurich, Switzerland.
  • Eurofins Genomics Europe Sequencing GmbH, D-78467 Konstanz, Germany.
  • Zurich Integrative Rodent Physiology (ZIRP), University of Zurich, CH-8057 Zurich, Switzerland.
Venue
Science Advances
Published
2022-03-04
Volume
8
Issue
9
ISSN
2375-2548
Cited by
68
References
2
Language
en

About these checks

Registry, retraction, Cites and statistics results are computed, not judged, with one exception: a printed reference that no index lists is read once by a model before it counts as a citation error. Claims are extracted by a model and kept only when their quote appears verbatim in the text; each cited source is then checked, with a model’s help, for whether it says what the claim relies on. Those verdicts can be wrong — read the claim’s quote and the cited source before relying on one.

Statistics and arithmetic are recomputed, not judged.

Confidence bands are shown only for fields calibrated on our annotated test set. None is calibrated yet, so no band is shown.

What counts as a claim ›How we measure confidence ›How we check this ›

Are you an author, or do you see a problem with this page? Request a review