

The DOI matches its Crossref record; 68 of the 68 references it cites were found in a registry or an index.
Optimal trade-off control in machine learning–based library design, with application to adeno-associated virus (AAV) for gene therapy
Open accessPublished version of a preprint
Abstract
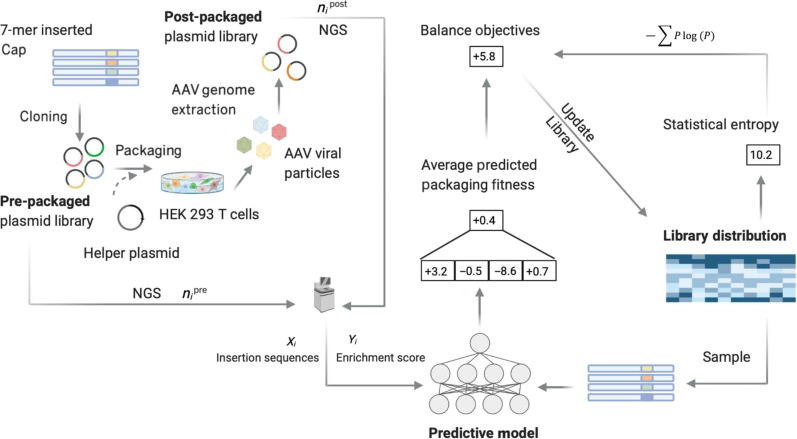
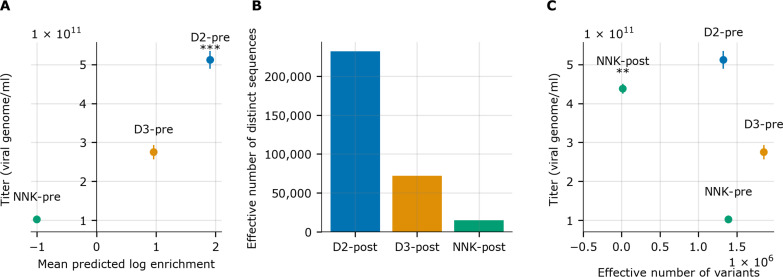
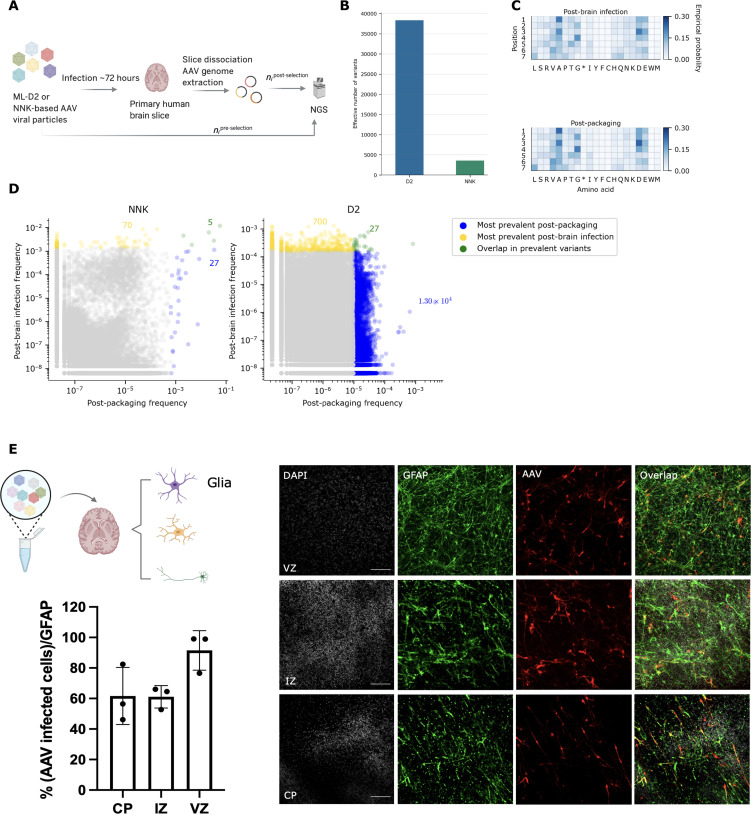
Adeno-associated viruses (AAVs) hold tremendous promise as delivery vectors for gene therapies. AAVs have been successfully engineered—for instance, for more efficient and/or cell-specific delivery to numerous tissues—by creating large, diverse starting libraries and selecting for desired properties. However, these starting libraries often contain a high proportion of variants unable to assemble or package their genomes, a prerequisite for any gene delivery goal. Here, we present and showcase a machine learning (ML) method for designing AAV peptide insertion libraries that achieve fivefold higher packaging fitness than the standard NNK library with negligible reduction in diversity. To demonstrate our ML-designed library’s utility for downstream engineering goals, we show that it yields approximately 10-fold more successful variants than the NNK library after selection for infection of human brain tissue, leading to a promising glial-specific variant. Moreover, our design approach can be applied to other types of libraries for AAV and beyond.
Overview
The claims and statistics of this paper haven’t been checked yet.
Free: it reads the open-access text and checks the first 5 claims that cite a source we can check. Create a free account to check every claim.
Integrity signals
Registry
Cites
Statistics
Figures
Verification
Claims the paper makes
The claims and statistics of this paper haven’t been checked yet.
Free: it reads the open-access text and checks the first 5 claims that cite a source we can check. Create a free account to check every claim.
Claims other papers make about this one
Each is checked against this paper’s own text: does it say what the citing paper says it does?
The source backs part of the claim, not all of it — or backs it for a different population, condition or comparison.
In the citing paper
“The fact that that not all peptide inserts (including 7-mer sequences) at the 587-588 position are amenable to capsid assembly, is well documented [59,60].”
From The AAV2.7m8 capsid packages a higher degree of heterogeneous vector genomes than AAV2 (2024) · cites this paper as [59]
Experimental — accuracy not yet measured
Self-check
Percentages, sums and reported differences re-computed from the paper’s own numbers.
The self-check needs the paper’s full text.
Citations
Cites
Adam: A Method for Stochastic Optimization
Kingma, D. P., & Ba, J. (2014) · arXiv · doi:10.48550/arxiv.1412.6980 · Cited by 98,946
Information theory and statistical mechanics
Jaynes, E. T. (1957) · Physical Review · doi:10.1103/physrev.106.620 · Cited by 12,931
TensorFlow: A system for large-scale machine learning
Abadi, M., Barham, P., Chen, J., Chen, Z., Davis, A., Dean, J., Devin, M., Ghemawat, S., Irving, G., Isard, M., et al. (2016) · arXiv (Cornell University) · doi:10.48550/arxiv.1605.08695 · Cited by 11,822
EVOLUTION IN MENDELIAN POPULATIONS
Wright, S. (1931) · Genetics · doi:10.1093/genetics/16.2.97 · Cited by 8,916
Development and Evolution of the Human Neocortex
Lui, J. H., Hansen, D. V., & Kriegstein, A. R. (2011) · Cell · doi:10.1016/j.cell.2011.06.030 · Cited by 1,342
Zolotukhin, S., Byrne, B. J., Mason, E., Zolotukhin, I., Potter, M., Chesnut, K., Summerford, C., Samulski, R. J., & Muzyczka, N. (1999) · Gene Therapy · doi:10.1038/sj.gt.3300938 · Cited by 1,312
An efficient one-step site-directed and site-saturation mutagenesis protocol
Zheng, L. (2004) · Nucleic Acids Research · doi:10.1093/nar/gnh110 · Cited by 1,178
Exploring protein fitness landscapes by directed evolution
Romero, P. A., & Arnold, F. H. (2009) · Nature Reviews Molecular Cell Biology · doi:10.1038/nrm2805 · Cited by 1,161
Cre-dependent selection yields AAV variants for widespread gene transfer to the adult brain
Deverman, B. E., Pravdo, P. L., Simpson, B. P., Kumar, S. R., Chan, K. Y., Banerjee, A., Wu, W.-L., Yang, B., Huber, N., Pasca, S. P., et al. (2016) · Nature Biotechnology · doi:10.1038/nbt.3440 · Cited by 1,061
Tuomisto, H. (2010) · Ecography · doi:10.1111/j.1600-0587.2009.05880.x · Cited by 1,024
Research works printed but not linked: 1
- K. P. Murphy Machine Learning: A Probabilistic Perspective (MIT Press 2012).
Cited by
Machine learning for functional protein design
Notin, P., Rollins, N., Gal, Y., Sander, C., & Marks, D. (2024) · Nature Biotechnology · doi:10.1038/s41587-024-02127-0 · Cited by 270
Opportunities and Challenges for Machine Learning-Assisted Enzyme Engineering
Yang, J., Li, F.-Z., & Arnold, F. H. (2024) · ACS Central Science · doi:10.1021/acscentsci.3c01275 · Cited by 246
Ding, K., Chin, M., Zhao, Y., Huang, W., Mai, B. K., Wang, H., Liu, P., Yang, Y., & Luo, Y. (2024) · Nature Communications · doi:10.1038/s41467-024-50698-y · Cited by 99
Nisanov, A. M., de Jesús, J. A. R., & Schaffer, D. V. (2025) · Molecular Therapy · doi:10.1016/j.ymthe.2025.03.056 · Cited by 89
Self-citationSystematic multi-trait AAV capsid engineering for efficient gene delivery
Eid, F.-E., Chen, A. T., Chan, K. Y., Huang, Q., Zheng, Q., Tobey, I. G., Pacouret, S., Brauer, P. P., Keyes, C., Powell, M. M., et al. (2024) · Nature Communications · doi:10.1038/s41467-024-50555-y · Cited by 86
Metadata
- Authors
- Zhu, D., Brookes, D. H., Busia, A., Carneiro, A., Fannjiang, C., Popova, G., Shin, D., Donohue, K. C., Lin, L. F., Miller, Z. M., Williams, E. R., Chang, E. F., Nowakowski, T. J., Listgarten, J., & Schaffer, D. V.
- Affiliations
- QB3 (US)
- University of California, Berkeley (US)
- University of California, San Francisco (US)
- Corresponding author
- Zhu, Danqing
- Brookes, David H.
- Busia, Akosua
- Listgarten, Jennifer
- Schaffer, David V.
- ORCID
- Venue
- Science Advances
- Published
- 2024-01-26
- Volume
- 10
- Issue
- 4
- Pages
- eadj3786-eadj3786
- ISSN
- 2375-2548 (ISSN-L)
- PMC
- PMC10807795
- OpenAlex
- W4391203107
- Cited by
- 63
- References
- 65
- Citations by year
- 2026: 14 · 2025: 21 · 2024: 18
- FWCI
- 14.02
- Type
- journal article
- Language
- en
- Open access
- gold
- doi.org
- Licence
- cc-by-nc
- Locations
- Science Advances (publishedVersion, cc-by-nc)
- bioRxiv (Cold Spring Harbor Laboratory) (acceptedVersion, cc-by-nc-nd)
- PubMed Central (publishedVersion, cc-by-nc)
- PubMed (publishedVersion)
- eScholarship (California Digital Library) (submittedVersion, cc-by-nc)
- Rare & Special e-Zone (The Hong Kong University of Science and Technology) (submittedVersion)
- Funders
- National Science Foundation (1752814, 2146752, DGE 2146 752)
- Shurl and Kay Curci Foundation
- National Institutes of Health (5r01gm139338-04, 1752814, 5R01GM139338)
- National Institute of Mental Health (UF1MH130700, F32MH118785)
- National Institute of General Medical Sciences (R01 GM139338)
- National Institute of Neurological Disorders and Stroke (R01NS126397)
- Topics
- Life Sciences › Biochemistry, Genetics and Molecular Biology › Genetics › Virus-based gene therapy research
- Life Sciences › Biochemistry, Genetics and Molecular Biology › Molecular Biology › RNA Interference and Gene Delivery
- Life Sciences › Biochemistry, Genetics and Molecular Biology › Molecular Biology › CRISPR and Genetic Engineering
- Keywords
- adeno-associated virus, library design, machine learning, gene therapy vectors, human brain tissue, viral genome assembly
- MeSH terms
- Machine Learning, Dependovirus, Brain, Humans, Genetic Therapy, Peptide Library
About these checks
Registry, retraction, Cites and statistics results are computed, not judged, with one exception: a printed reference that no index lists is read once by a model before it counts as a citation error. Claims are extracted by a model and kept only when their quote appears verbatim in the text; each cited source is then checked, with a model’s help, for whether it says what the claim relies on. Those verdicts can be wrong — read the claim’s quote and the cited source before relying on one.
Statistics and arithmetic are recomputed, not judged.
Confidence bands are shown only for fields calibrated on our annotated test set. None is calibrated yet, so no band is shown.
What counts as a claim ›How we measure confidence ›How we check this ›
Are you an author, or do you see a problem with this page? Request a review
How to cite
Cite CoChat for the checks on this page, and the paper for its own findings.
- This page
- CoChat. (2026). Citation check: Optimal trade-off control in machine learning–based library design, with application to adeno-associated virus (AAV) for gene therapy. https://app.cochat.ai/papers/10.1126/sciadv.adj3786
- The paper
- Zhu, D., Brookes, D. H., Busia, A., Carneiro, A., Fannjiang, C., Popova, G., Shin, D., Donohue, K. C., Lin, L. F., Miller, Z. M., Williams, E. R., Chang, E. F., Nowakowski, T. J., Listgarten, J., & Schaffer, D. V. (2024). Optimal trade-off control in machine learning–based library design, with application to adeno-associated virus (AAV) for gene therapy. Science Advances. https://doi.org/10.1126/sciadv.adj3786
Data sources
Bibliographic data: Semantic Scholar, OpenAlex, Crossref.
Contains information from the Semantic Scholar Academic Graph Datasets, made available under the ODC Attribution License (ODC-BY 1.0).
Semantic Scholar’s data is described in: Kinney, R., et al. (2023). The Semantic Scholar Open Data Platform. arXiv:2301.10140.
