

Matrix mechanical remodeled carrier-free nanosystem for programmable closed-loop reversal of liver fibrosis via STING alkylation
Open accessThe DOI matches its Crossref record; 48 of the 48 references it cites were found in a registry or an index; 23 of the 36 sources its claims cite were checked for support.
Abstract
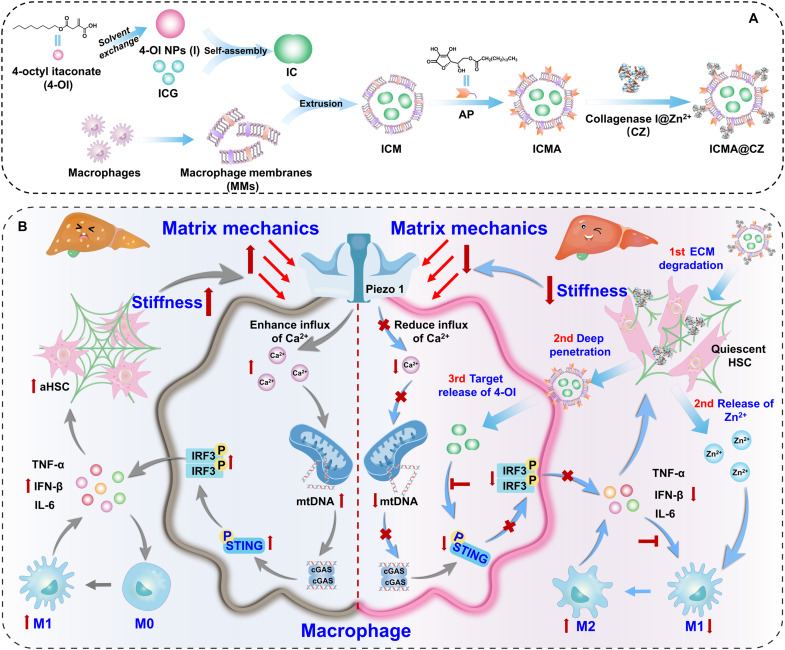
Extracellular matrix (ECM) sclerosis represents a prominent feature of fibrotic disorders; however, the macrophage response to changes in matrix stiffness and its impact on fibrotic diseases remain unclear. This study reveals a vicious circle of ECM-cell-ECM, where increased ECM hardness activates the STING pathway in macrophages, in turn activates hepatic stellate cells (HSCs), thus enhancing ECM stiffness again and exacerbating liver fibrosis. To reverse liver fibrosis, an innovative carrier-free nanosystem capable of degrading ECM, specifically blocking the STING pathway in macrophages as well as remodeling matrix mechanical, is created. In mouse models, pharmacological STING inhibition via alkylation in macrophages, combined with ECM degradation via matrix metalloproteinases and metal ion-induced macrophage polarization, reduces stromal stiffness and reverses fibrosis. Our findings underscore the antifibrotic potential of matrix mechanical remodeling, demonstrating that concurrent reduction of matrix stiffness and inhibition of STING pathway in macrophages can synergistically promote fibrosis regression. This research establishes a previously unidentified paradigm for liver fibrosis reversal.
Overview
CoChat Summary
## TL;DR
The paper argues that liver fibrosis is sustained by an ECM-cell-ECM vicious cycle in which increased matrix stiffness activates macrophage STING signaling, which then drives HSC activation and further ECM stiffening. The authors built a carrier-free nanosystem (ICMA@CZ) to degrade ECM, target macrophages, and inhibit STING, and report that it reversed fibrosis in mice.
## Key findings
- In GelMA hydrogels spanning 0.1 to 5 kPa, macrophages showed stiffness-dependent responses: Ca2+ increased ~15-fold in 30% GelMA (5 kPa) versus initial cells, mitochondrial membrane potential dropped, and p-STING, p-TBK1, p-IRF3, plus TNF-α, IFN-β, and IL-6, increased with stiffness.
- In transwell/conditioned-medium experiments, ICMA@CZ degraded collagen better than ICMA: macrophage fluorescence was 5 to 10 times higher than ICMA in 15% and 30% hydrogel conditions, and HSC α-SMA fluorescence was ~3 to 4-fold lower than in activated HSC-T6 cells.
- The nanosystem showed homotypic macrophage targeting: MM-coated nanoparticles had ~8 to 9-fold higher uptake in RAW 264.7 cells and ~10 to 12-fold higher uptake in Kupffer cells than in HSCs; the carrier-free system had ~96% 4-OI loading efficiency.
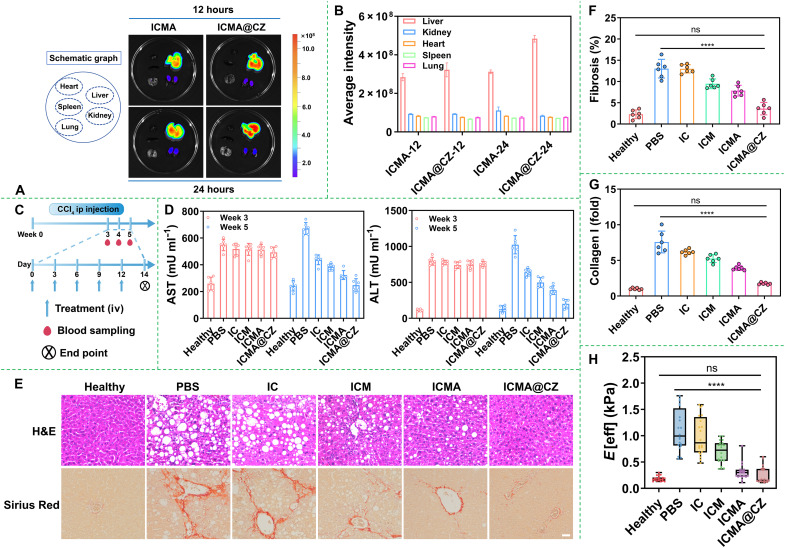
- In the mouse fibrosis model, ICMA@CZ reduced serum ALT/AST, lowered collagen staining by sevenfold toward control levels, reduced liver stiffness toward normal, and nearly normalized p-STING-positive cells; it also reduced TNF-α (fivefold), IFN-β (fivefold), IL-6 (eightfold), and TGF-β (sevenfold) in liver tissue.
## Methods
- The study combined in vitro mechanistic assays with an in vivo CCl4-induced alcohol-associated liver disease (AALD) / moderate liver fibrosis mouse model.
- GelMA hydrogels were used to create matrix stiffness conditions (0.1 to 5 kPa) for RAW 264.7 macrophages; readouts included Rhod-2 AM Ca2+ staining, JC-1 mitochondrial membrane potential, Western blotting, ELISA, flow cytometry, immunofluorescence, and collagen assays.
- The nanosystem was assembled stepwise as 4-OI/ICG (IC) → macrophage membrane-coated (ICM) → AP-modified (ICMA) → CZ-loaded (ICMA@CZ), and evaluated by DLS, TEM, HPLC, transwell penetration, confocal microscopy, and in vivo biodistribution/antifibrosis testing.
## Limitations
- The paper does not state explicit study limitations in the provided text.
- Evidence of effectiveness is largely from cell culture and mouse models; any limitation about human translation is not stated in the paper but is evident from the text.
Model-written summary. Check it against the paper before relying on it.
Integrity signals
Registry
Cites
Statistics
Figures



Verification
Claims the paper makes
19 Valid · 2 Not valid · 6 Not checked · 98 Own results and interpretations
The cited sources support only part of this claim — read each source’s verdict below.
In the paper
“Macrophages are critical effector cells involved in both the progression and resolution of fibrosis (7–9).”
§ Matrix mechanical remodeled carrier-free nanosystem for programmable closed-loop reversal of liver fibrosis via STING alkylation > INTRODUCTION
What the sources say
- Not checked — no full text of the sourcecites [7] H. Dai, C. Zhu, Q. Huai, W. Xu, J. Zhu, X. Zhang, X. Zhang, B. Sun, H. Xu, M. Zheng, X. Li, H. Wang, Chimeric antigen receptor-modified macrophages ameliorate liver fibrosis in preclinical models. J. Hepatol. 80, 913– 927 (2024). 38340812 source
- Partly supportedcites [8] J. Rao, H. Wang, M. Ni, Z. Wang, Z. Wang, S. Wei, M. Liu, P. Wang, J. Qiu, L. Zhang, C. Wu, H. Shen, X. Wang, F. Cheng, L. Lu, FSTL1 promotes liver fibrosis by reprogramming macrophage function through modulating the intracellular function of PKM2. Gut 71, 2539– 2550 (2022). 35140065 PMC9664121 sourceExperimental — accuracy not yet measured
The Introduction and Discussion identify macrophages as key regulators of the progression or resolution of liver fibrosis. The claim omits that liver-specific scope and states the point about fibrosis generally. (LLM, conf=0.82)
- Supportedcites [9] M. Mooring, G. A. Yeung, P. Luukkonen, S. Liu, M. W. Akbar, G. J. Zhang, O. Balogun, X. Yu, R. Mo, K. Nejak-Bowen, M. V. Poyurovsky, C. J. Booth, L. Konnikova, G. I. Shulman, D. Yimlamai, Hepatocyte CYR61 polarizes profibrotic macrophages to orchestrate NASH fibrosis. Sci. Transl. Med. 15, eade3157 (2023). 37756381 PMC10874639 source
The Discussion describes macrophage subtypes that contribute to liver fibrosis and others that aid recovery from injury. This supports the claim that macrophages participate in both fibrosis progression and resolution. (LLM, conf=0.90)
plainstates a cause- Asserted: passes — The authors put it forward as true.
- Checkable: passes — It can be checked against evidence.
- Load-bearing: passes — The paper’s conclusions depend on it.
- Based: passes — The paper gives a reason why it holds.
Every source the paper cites for this claim was checked and supports it.
In the paper
“Karin et al. have shown that Ca2+ overload can induce mitochondrial activation and the release of mitochondrial DNA (mtDNA) (19).”
§ Matrix mechanical remodeled carrier-free nanosystem for programmable closed-loop reversal of liver fibrosis via STING alkylation > INTRODUCTION
What the sources say
- Supportedcites [19] H. Xian, K. Watari, E. Sanchez-Lopez, J. Offenberger, J. Onyuru, H. Sampath, W. Ying, H. M. Hoffman, G. S. Shadel, M. Karin, Oxidized DNA fragments exit mitochondria via mPTP- and VDAC-dependent channels to activate NLRP3 inflammasome and interferon signaling. Immunity 55, 1370– 1385.e8 (2022). 35835107 PMC9378606 source
The Results section (‘Ca2+ overload initiates mPTP opening and subsequent VDAC oligomerization’; page unavailable) reports that mitochondrial Ca2+ uptake precedes channel opening. The Results section on MCU-mediated uptake reports that blocking this uptake reduces both channel opening and mtDNA release, supporting the attributed link. (LLM, conf=0.90)
plainstates a cause- Asserted: passes — The authors put it forward as true.
- Checkable: passes — It can be checked against evidence.
- Load-bearing: passes — The paper’s conclusions depend on it.
- Based: passes — The paper gives a reason why it holds.
- Supported
Every source the paper cites for this claim was checked and supports it.
In the paper
“As demonstrated in our previous work (10), undesirable cross-talk existed between macrophages and HSCs.”
§ Matrix mechanical remodeled carrier-free nanosystem for programmable closed-loop reversal of liver fibrosis via STING alkylation > RESULTS > In vivo antifibrosis efficacy of the nanosystem
What the sources say
- Supportedcites [10] H. Jia, L. Ding, A. Yu, W. Tang, S. Tang, C. Zhang, D. Oupický, A boronate-based modular assembly nanosystem to block the undesirable crosstalk between hepatic stellate cells and Kupffer cells. Bioact. Mater. 25, 569– 579 (2023). 37056257 PMC10087950 source
The Introduction (p. 1) states that Kupffer cells are 'the predominant macrophage population in the injured liver that are engaged in complex crosstalk' and that 'there is strong evidence for interactions between HSCs and KCs during the pathogenesis of liver fibrosis', framing this as 'the undesirable crosstalk between KCs and HSCs'. Section 3.4 ('PPC blocking the undesirable crosstalk between KCs and HSCs in vitro', pp. 6-8) then demonstrates it experimentally in both directions: HSCs activated by CM from LPS-stimulated KCs showed increased alpha-SMA and collagen, and RAW macrophage cells activated by CM from SDF-1-stimulated HSCs showed increased CD68 and miR-155 ('~20 folds'), concluding 'the PPC has the ability to block the crosstalk of HSCs and KCs'. The claim's 'macrophages' corresponds to the paper's KCs/RAW macrophage model; the demonstration is in vitro in a liver fibrosis setting, which the citing sentence does not contradict. (LLM, conf=0.90)
boostedstates an association- Asserted: passes — The authors put it forward as true.
- Checkable: passes — It can be checked against evidence.
- Load-bearing: passes — The paper’s conclusions depend on it.
- Based: passes — The paper gives a reason why it holds.
- Supported
The cited sources support only part of this claim — read each source’s verdict below.
In the paper
“Simultaneously, the metal ion–based loading of proteases effectively addressed the challenge of insufficient enzyme activity in the lesion area due to the depletion of metal ions (such as zinc ions) (45, 46).”
§ Matrix mechanical remodeled carrier-free nanosystem for programmable closed-loop reversal of liver fibrosis via STING alkylation > DISCUSSION
What the sources say
- Partly supportedcites [45] L. Ding, M. Liang, Y. Li, M. Zeng, M. Liu, W. Ma, F. Chen, C. Li, R. L. Reis, F. Li, Y. Wang, Zinc-organometallic framework vaccine controlled-release Zn2+ regulates tumor extracellular matrix degradation potentiate efficacy of immunotherapy. Adv. Sci. 10, e2302967 (2023). PMC10520680 37439462 sourceExperimental — accuracy not yet measured
The Introduction (page unavailable) describes MMPs as zinc-dependent proteolytic enzymes and reports reduced zinc concentrations in some tumors. The Results and Discussion (page unavailable) show that zinc delivery increased MMP-2 activity. However, the paper describes a zinc-releasing vaccine that acts on endogenous MMPs, not metal-ion-based loading of proteases, and does not establish that zinc depletion caused insufficient enzyme activity at the lesion. (LLM, conf=0.86)
- Could not verifycites [46] A. K. Shendge, I. Sekler, M. Hershfinkel, ZnR/GPR39 regulates hepatic insulin signaling, tunes liver bioenergetics and ROS production, and mitigates liver fibrosis and injury. Redox Biol. 78, 103403 (2024). 39514940 PMC11584770 sourceExperimental — accuracy not yet measured
The Introduction (page unavailable) discusses zinc deficiency and impaired liver function, but not protease loading or enzyme activity at a lesion. Searches for metal-ion-based protease loading and zinc-depletion-related protease activity found no passage addressing the claimed intervention. (LLM, conf=0.76)
plainstates a cause- Asserted: passes — The authors put it forward as true.
- Checkable: passes — It can be checked against evidence.
- Load-bearing: passes — The paper’s conclusions depend on it.
- Based: passes — The paper gives a reason why it holds.
- Partly supported
A result the paper states — it cites no source for it, so there is none to check. The quote shows it is in the paper.
In the paper
“there was an elevation in the secretion of IL-6, TNF-α, and IFN-β”
§ Matrix mechanical remodeled carrier-free nanosystem for programmable closed-loop reversal of liver fibrosis via STING alkylation > RESULTS > In vivo antifibrosis efficacy of the nanosystem
plainstates a cause- Asserted: passes — The authors put it forward as true.
- Checkable: passes — It can be checked against evidence.
- Load-bearing: passes — The paper’s conclusions depend on it.
- Based: passes — The paper gives a reason why it holds.
60 more claims
Create a free account to see all 125 claims and to verify the 3 references still open.
- Probably not a substantial claim. 13
- It may state two separate claims as one. 50
Self-check
Percentages, sums and reported differences re-computed from the paper’s own numbers.
Each contradiction between two passages listed here was confirmed by an independent check.
Rated minor: it would not touch a result — a value no result rests on, a p-value that stays on the same side of the significance level, or a conflict that is clerical, resolved elsewhere in the paper, or outside its own findings.
In the paper
§ Matrix mechanical remodeled carrier-free nanosystem for programmable closed-loop reversal of liver fibrosis via STING alkylation > RESULTS > Preparation and characterization of carrier-free nanosystem
“With the introduction of AP, the zeta potential decreased slightly by −14 mV for the assembly of AP on the surface of MMs (28). Following the modification with CZ, the zeta potential of ICMA markedly dropped to −20 mV (Fig. 3A).”
§ Matrix mechanical remodeled carrier-free nanosystem for programmable closed-loop reversal of liver fibrosis via STING alkylation > RESULTS > Preparation and characterization of carrier-free nanosystem
“At an AP concentration of 8 μg, the diameter of ICMA was nearly the same as that of ICM, and the zeta potential was comparable to that of AP.”
Citations
Cites
Engineering precision nanoparticles for drug delivery
Mitchell, M. J., Billingsley, M. M., Haley, R. M., Wechsler, M. E., Peppas, N. A., & Langer, R. (2021) · Nature Reviews Drug Discovery · doi:10.1038/s41573-020-0090-8 · Cited by 7,933
Molecular and cellular mechanisms of liver fibrosis and its regression
Kisseleva, T., & Brenner, D. (2021) · Nature Reviews Gastroenterology & Hepatology · doi:10.1038/s41575-020-00372-7 · Cited by 2,024 · cited 1×
“Previous studies have reported that M1 macrophages promote ECM deposition ( 37 ).”
Xian, H., Watari, K., Sanchez-Lopez, E., Offenberger, J., Onyuru, J., Sampath, H., Ying, W., Hoffman, H. M., Shadel, G. S., & Karin, M. (2022) · Immunity · doi:10.1016/j.immuni.2022.06.007 · Cited by 850 · cited 1×
“Karin et al. have shown that Ca 2 + overload can induce mitochondrial activation and the release of mitochondrial DNA (mtDNA) ( 19 ).”
Imaging macrophages with nanoparticles
Weissleder, R., Nahrendorf, M., & Pittet, M. J. (2014) · Nature Materials · doi:10.1038/nmat3780 · Cited by 809 · cited 1×
“Furthermore, macrophages exhibit a considerable capacity to recognize and eliminate larger nanoparticles, whereas their endocytic ability for smaller particles is comparatively weaker ( 32 – 34 ).”
The extracellular matrix and the immune system: A mutually dependent relationship
Sutherland, T. E., Dyer, D. P., & Allen, J. E. (2023) · Science · doi:10.1126/science.abp8964 · Cited by 519 · cited 1×
“Many studies have also shown that macrophages drive ECM deposition by fibroblasts during the repair process and can directly degrade and remodel the ECM during resolution ( 11 , 12 ).”
An inflammation-targeting hydrogel for local drug delivery in inflammatory bowel disease
Zhang, S., Ermann, J., Succi, M. D., Zhou, A., Hamilton, M. J., Cao, B., Korzenik, J. R., Glickman, J. N., Vemula, P. K., Glimcher, L. H., et al. (2015) · Science Translational Medicine · doi:10.1126/scitranslmed.aaa5657 · Cited by 467 · cited 3×
“With the introduction of AP, the zeta potential decreased slightly by − 14 mV for the assembly of AP on the surface of MMs ( 28 ).”
Cell membrane coating integrity affects the internalization mechanism of biomimetic nanoparticles
Liu, L., Bai, X., Martikainen, M.-V., Kårlund, A., Roponen, M., Xu, W., Hu, G., Tasciotti, E., & Lehto, V.-P. (2021) · Nature Communications · doi:10.1038/s41467-021-26052-x · Cited by 440 · cited 1×
“After the addition of the MMs, the hydrodynamic size of ICM increased to 125 nm with a polydispersity of 0.100 to 0.180, since one or more IC nanoparticles can be encapsulated by MMs ( 26 , 31 ).”
InfluentialWells, R. G. (2013) · Biochimica et Biophysica Acta (BBA) - Molecular Basis of Disease · doi:10.1016/j.bbadis.2013.02.007 · Cited by 384 · cited 1×
“2A) ( 24 ).”
Regulation of cGAS–STING signalling and its diversity of cellular outcomes
Zhang, Z., & Zhang, C. (2025) · Nature Reviews Immunology · doi:10.1038/s41577-024-01112-7 · Cited by 287
The pore size of mesoporous silica nanoparticles regulates their antigen delivery efficiency
Hong, X., Zhong, X., Du, G., Hou, Y., Zhang, Y., Zhang, Z., Gong, T., Zhang, L., & Sun, X. (2020) · Science Advances · doi:10.1126/sciadv.aaz4462 · Cited by 276 · cited 1×
“Furthermore, macrophages exhibit a considerable capacity to recognize and eliminate larger nanoparticles, whereas their endocytic ability for smaller particles is comparatively weaker ( 32 – 34 ).”
Cited by
Advances in carrier-free nanodrug delivery systems
Liu, J.-Y., Zheng, Y.-Y., Wang, S.-Y., Bi, Y., Sun, M., Hao, J.-F., & He, Y.-J. (2026) · Drug Delivery and Translational Research · doi:10.1007/s13346-026-02118-5 · Cited by 5
“[132] utilized the synergistic effects of hydrophobic interactions, hydrogen bonding, and metal ion coordination to drive molecular self-assembly into nanoparticles (ICMA@CZ), with a particle size of 120 nm and a zeta potential of -20 mV.”
Extracellular matrix stiffness in chronic liver disease: From mechanisms to treatments
Xi, Z.-H., Sun, W.-J., Li, M., Dong, Q.-Q., Dong, X., Qiao, Z.-L., Tao, H., Yang, J., & Lu, C. (2026) · Biochemical Pharmacology · doi:10.1016/j.bcp.2026.118194 · Cited by 1
Cheng, J. (2026) · Frontiers in Cell and Developmental Biology · doi:10.3389/fcell.2026.1842681
“That builds a self-amplifying positive feedback loop: Stiffness → YAP → ECM production/crosslinking → Increased stiffness (Han et al., 2025; Caon et al., 2024).”
STING organelle stress sensing in the liver drives hepatocyte fate and remodeling
Hamad, R. S., Elmorsy, E. A., Elnaghy, F., Amer, M. M., Abdel-Hamed, M. R., Farrag, A. A., Eissa, H., El-kott, A. F., Negm, S., AlShehri, M. A., et al. (2026) · Tissue and Cell · doi:10.1016/j.tice.2026.103629
Yu, D. S., Han, H., Jia, H., & Liu, W. (2026) · ACS Applied Materials & Interfaces · doi:10.1021/acsami.6c04735
Self-citationMa, P., Wang, H., Mu, A., Ye, G., Han, Y., Chin, C. T., & Wu, J. (2026) · ACS Applied Materials & Interfaces · doi:10.1021/acsami.6c13476
Metadata
- Authors
- Han, H., Yu, D., Liu, Y., Jia, H., & Liu, W.
- Affiliations
- Tianjin University (CN)
- Corresponding author
- Jia, Huizhen
- Venue
- Science Advances
- Published
- 2025-11-21
- Volume
- 11
- Issue
- 47
- Pages
- eadz4126-eadz4126
- ISSN
- 2375-2548 (ISSN-L)
- PMC
- PMC12629182
- OpenAlex
- W4416368410
- Cited by
- 7
- References
- 47
- Citations by year
- 2026: 7
- FWCI
- 3.88
- Type
- journal article
- Language
- en
- Open access
- gold
- doi.org
- Licence
- cc-by
- Locations
- Science Advances (publishedVersion, cc-by)
- Europe PMC (PubMed Central) (publishedVersion, cc-by)
- PubMed (publishedVersion)
- Funders
- National Natural Science Foundation of China (52273146)
- Topics
- Health Sciences › Medicine › Hepatology › Liver physiology and pathology
- Life Sciences › Biochemistry, Genetics and Molecular Biology › Cell Biology › Cellular Mechanics and Interactions
- Health Sciences › Medicine › Hepatology › Liver Disease Diagnosis and Treatment
- Keywords
- liver fibrosis, STING pathway, macrophages, extracellular matrix stiffness, hepatic stellate cells, matrix metalloproteinases, extracellular matrix degradation, antifibrotic therapy
- MeSH terms
- STING Protein, Alkylation, Animals, Disease Models, Animal, Extracellular Matrix, Humans, Liver Cirrhosis, Macrophages, Male, Membrane Proteins, Signal Transduction, Mice, Hepatic Stellate Cells
About these checks
Registry, retraction, Cites and statistics results are computed, not judged, with one exception: a printed reference that no index lists is read once by a model before it counts as a citation error. Claims are extracted by a model and kept only when their quote appears verbatim in the text; each cited source is then checked, with a model’s help, for whether it says what the claim relies on. Those verdicts can be wrong — read the claim’s quote and the cited source before relying on one.
The claim verdicts this report counts are experimental: their accuracy is not yet measured.
A language model drew the claims from the paper on 2026-10-10, under version 3 of the claim definition (model deepseek-v4.1-flash, prompt extract-v3).
A second model labelled each claim on 2026-10-10 (model jev-1.13-20260917, definition revision gold-guideline-v0.2).
Cited sources are checked with a language model’s help (gpt-6-sol and qwen3.8-omni-flash).
Statistics and arithmetic are recomputed, not judged.
Confidence bands are shown only for fields calibrated on our annotated test set. None is calibrated yet, so no band is shown.
What counts as a claim ›How we measure confidence ›How we check this ›
Are you an author, or do you see a problem with this page? Request a review
Data sources
Bibliographic data: Semantic Scholar, OpenAlex, Crossref.
Contains information from the Semantic Scholar Academic Graph Datasets, made available under the ODC Attribution License (ODC-BY 1.0).
Semantic Scholar’s data is described in: Kinney, R., et al. (2023). The Semantic Scholar Open Data Platform. arXiv:2301.10140.
