

The DOI matches its Crossref record; 97 of the 97 references it cites were found in a registry or an index.
Alterations in Gut Microbiome Composition and Function in Irritable Bowel Syndrome and Increased Probiotic Abundance with Daily Supplementation
Open accessPublished version of a preprint
Abstract
An estimated 35 million people in the United States and 11.5% of the population globally are affected by IBS. Immunity, genetics, environment, diet, small intestinal bacterial overgrowth (SIBO), and the gut microbiome are all factors that contribute to the onset or triggers of IBS.
Overview
The claims and statistics of this paper haven’t been checked yet.
Free: it reads the open-access text and checks the first 5 claims that cite a source we can check. Create a free account to check every claim.
Integrity signals
Registry
Cites
Statistics
Figures



Verification
Claims the paper makes
The claims and statistics of this paper haven’t been checked yet.
Free: it reads the open-access text and checks the first 5 claims that cite a source we can check. Create a free account to check every claim.
Claims other papers make about this one
Each is checked against this paper’s own text: does it say what the citing paper says it does?
The cited source says what the claim attributes to it.
In the citing paper
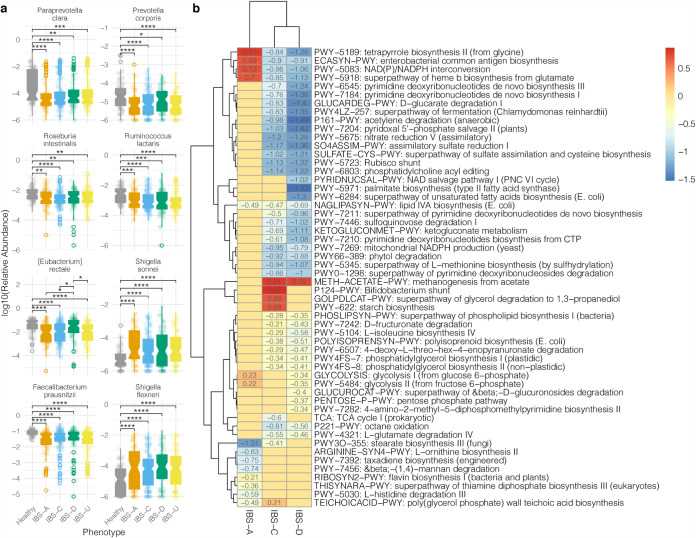
“Specifically, IBS patients had significantly lower alpha diversity and enrichment of Gram-negative bacteria with reduction in pathways associated short-chain fatty acid, differentiating microbial features in healthy and IBS subtypes43.”
From Association between attention-deficit/hyperactivity disorders and intestinal disorders: A systematic review and Meta-analysis (2025) · cites this paper as [43]
Self-check
Percentages, sums and reported differences re-computed from the paper’s own numbers.
The self-check needs the paper’s full text.
Citations
Cites
Sokol, H., Pigneur, B., Watterlot, L., Lakhdari, O., Bermúdez-Humarán, L. G., Gratadoux, J.-J., Blugeon, S., Bridonneau, C., Furet, J.-P., Corthier, G., et al. (2008) · Proceedings of the National Academy of Sciences · doi:10.1073/pnas.0804812105 · Cited by 4,413 · cited 1×
“short-chain fatty acid (SCFA) essential for gut health (29, 32, 38, 39).”
BackgroundLacy, B. E., Mearin, F., Chang, L., Chey, W. D., Lembo, A. J., Simren, M., & Spiller, R. (2016) · Gastroenterology · doi:10.1053/j.gastro.2016.02.031 · Cited by 2,866
Multivariable association discovery in population-scale meta-omics studies
Mallick, H., Rahnavard, A., McIver, L. J., Ma, S., Zhang, Y., Nguyen, L. H., Tickle, T. L., Weingart, G., Ren, B., Schwager, E. H., et al. (2021) · PLOS Computational Biology · doi:10.1371/journal.pcbi.1009442 · Cited by 2,596 · cited 1×
“MaasLin2 was used for distinguishing pathway features between healthy and IBS subtypes (82).”
MethodFunctional Gastrointestinal Disorders: History, Pathophysiology, Clinical Features, and Rome IV
Drossman, D. A. (2016) · Gastroenterology · doi:10.1053/j.gastro.2016.02.032 · Cited by 2,430
Beghini, F., McIver, L. J., Blanco-Míguez, A., Dubois, L., Asnicar, F., Maharjan, S., Mailyan, A., Manghi, P., Scholz, M., Thomas, A. M., et al. (2021) · eLife · doi:10.7554/elife.65088 · Cited by 2,303
Sperber, A. D., Bangdiwala, S. I., Drossman, D. A., Ghoshal, U. C., Simren, M., Tack, J., Whitehead, W. E., Dumitrascu, D. L., Fang, X., Fukudo, S., et al. (2021) · Gastroenterology · doi:10.1053/j.gastro.2020.04.014 · Cited by 2,263
Expansion of intestinal Prevotella copri correlates with enhanced susceptibility to arthritis
Scher, J. U., Sczesnak, A., Longman, R. S., Segata, N., Ubeda, C., Bielski, C., Rostron, T., Cerundolo, V., Pamer, E. G., Abramson, S. B., et al. (2013) · eLife · doi:10.7554/elife.01202 · Cited by 2,047 · cited 1×
“tion (51) but have also been associated with chronic inflammatory conditions (52, 53).”
BackgroundThrough Ageing, and Beyond: Gut Microbiota and Inflammatory Status in Seniors and Centenarians
Biagi, E., Nylund, L., Candela, M., Ostan, R., Bucci, L., Pini, E., Nikkïla, J., Monti, D., Satokari, R., Franceschi, C., et al. (2010) · PLoS ONE · doi:10.1371/journal.pone.0010667 · Cited by 1,483 · cited 2×
“Ruminococcus lactaris is negatively correlated to IL-8 (45) and is more abundant in a non-chronic kidney disease cohort (46), but has also been shown to be associated with a high-fat diet in a murine diabetes model (47).”
BackgroundLow counts of Faecalibacterium prausnitzii in colitis microbiota
Sokol, H., Seksik, P., Furet, J. P., Firmesse, O., Nion-Larmurier, I., Beaugerie, L., Cosnes, J., Corthier, G., Marteau, P., & Doré, J. (2009) · Inflammatory Bowel Diseases · doi:10.1002/ibd.20903 · Cited by 1,275
Rajilić–Stojanović, M., Biagi, E., Heilig, H. G. H. J., Kajander, K., Kekkonen, R. A., Tims, S., & de Vos, W. M. (2011) · Gastroenterology · doi:10.1053/j.gastro.2011.07.043 · Cited by 1,041
Cited by
Probiotics Mechanism of Action on Immune Cells and Beneficial Effects on Human Health
Mazziotta, C., Tognon, M., Martini, F., Torreggiani, E., & Rotondo, J. C. (2023) · Cells · doi:10.3390/cells12010184 · Cited by 889
Jacobs, J. P., Lagishetty, V., Hauer, M. C., Labus, J. S., Dong, T. S., Toma, R., Vuyisich, M., Naliboff, B. D., Lackner, J. M., Gupta, A., et al. (2023) · Microbiome · doi:10.1186/s40168-022-01450-5 · Cited by 144
Zhou, Y., Zhang, F., Mao, L., Feng, T., Wang, R. C., Xu, M., Lv, B., & Wang, X. (2022) · European Journal of Nutrition · doi:10.1007/s00394-022-02958-0 · Cited by 63
Chen, Y., Shen, X., Ma, T., Yu, X., Kwok, L. Y., Li, Y., Sun, Z., Li, D., & Zhang, H. (2023) · mSystems · doi:10.1128/msystems.01300-22 · Cited by 55
“alpha diversity of gut microbes is commonly observed in various chronic diseases such as Parkinson’s disease and irritable bowel syndrome (36, 37).”
BackgroundMicrobiome Shifts and Their Impact on Gut Physiology in Irritable Bowel Syndrome
Aggeletopoulou, I., & Triantos, C. K. (2024) · International Journal of Molecular Sciences · doi:10.3390/ijms252212395 · Cited by 56
Metadata
- Authors
- Phan, J., Nair, D., Jain, S., Montagne, T., Flores, D. V., Nguyen, A., Dietsche, S., Gombar, S., & Cotter, P.
- Affiliations
- Sun Genomics, Inc., San Diego, California, USA
- Atropos Health, Palo Alto, California, USA
- ResearchDx, Inc., Irvine, California, USA
- Corresponding author
- Phan, Joann
- ORCID
- Gombar, Saurabh
- Venue
- mSystems
- Publisher
- American Society for Microbiology
- Published
- 2021-12-21
- Volume
- 6
- Issue
- 6
- Pages
- e0121521-e0121521
- ISSN
- 2379-5077 (ISSN-L)
- PMC
- PMC8562475
- OpenAlex
- W3211292548
- Cited by
- 33
- References
- 97
- Citations by year
- 2026: 3 · 2025: 7 · 2024: 12 · 2023: 8 · 2022: 3
- FWCI
- 1.81
- Type
- journal article
- Language
- en
- Open access
- gold
- doi.org
- Licence
- cc-by
- creativecommons.org/licenses/by/4.0/ (vor)
- journals.asm.org/non-commercial-tdm-license (tdm)
- Locations
- mSystems (publishedVersion, cc-by)
- bioRxiv (Cold Spring Harbor Laboratory) (acceptedVersion)
- Europe PMC (PubMed Central) (publishedVersion, other-oa)
- PubMed Central (publishedVersion, cc-by)
- PubMed (publishedVersion)
- DOAJ (DOAJ: Directory of Open Access Journals) (submittedVersion, cc-by-sa)
- Topics
- Life Sciences › Biochemistry, Genetics and Molecular Biology › Molecular Biology › Gut microbiota and health
- Health Sciences › Medicine › Gastroenterology › Gastrointestinal motility and disorders
- Life Sciences › Agricultural and Biological Sciences › Food Science › Probiotics and Fermented Foods
- Keywords
- irritable bowel syndrome, gut microbiota, probiotics, probiotic supplementation, small intestinal bacterial overgrowth, microbiota composition, microbiome function, IBS symptom severity
About these checks
Registry, retraction, Cites and statistics results are computed, not judged, with one exception: a printed reference that no index lists is read once by a model before it counts as a citation error. Claims are extracted by a model and kept only when their quote appears verbatim in the text; each cited source is then checked, with a model’s help, for whether it says what the claim relies on. Those verdicts can be wrong — read the claim’s quote and the cited source before relying on one.
Statistics and arithmetic are recomputed, not judged.
Confidence bands are shown only for fields calibrated on our annotated test set. None is calibrated yet, so no band is shown.
What counts as a claim ›How we measure confidence ›How we check this ›
Are you an author, or do you see a problem with this page? Request a review
How to cite
Cite CoChat for the checks on this page, and the paper for its own findings.
- This page
- CoChat. (2026). Citation check: Alterations in Gut Microbiome Composition and Function in Irritable Bowel Syndrome and Increased Probiotic Abundance with Daily Supplementation. https://app.cochat.ai/papers/10.1128/msystems.01215-21
- The paper
- Phan, J., Nair, D., Jain, S., Montagne, T., Flores, D. V., Nguyen, A., Dietsche, S., Gombar, S., & Cotter, P. (2021). Alterations in Gut Microbiome Composition and Function in Irritable Bowel Syndrome and Increased Probiotic Abundance with Daily Supplementation. mSystems. https://doi.org/10.1128/msystems.01215-21
Data sources
Bibliographic data: Semantic Scholar, OpenAlex, Crossref.
Contains information from the Semantic Scholar Academic Graph Datasets, made available under the ODC Attribution License (ODC-BY 1.0).
Semantic Scholar’s data is described in: Kinney, R., et al. (2023). The Semantic Scholar Open Data Platform. arXiv:2301.10140.
