

The DOI matches its Crossref record; 40 of the 40 references it cites were found in a registry or an index.
Primary sclerosing cholangitis is characterised by intestinal dysbiosis independent from IBD
Open accessAbstract
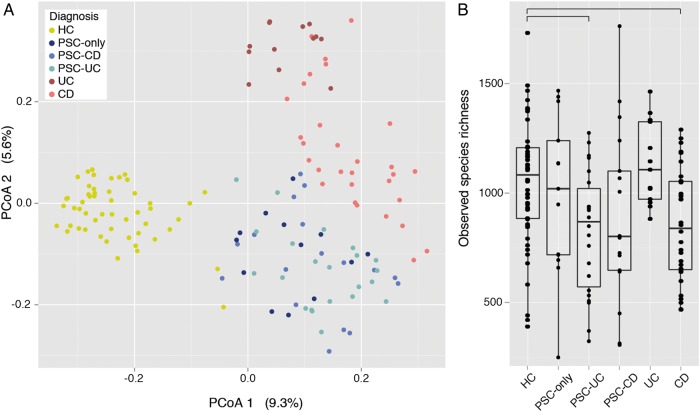
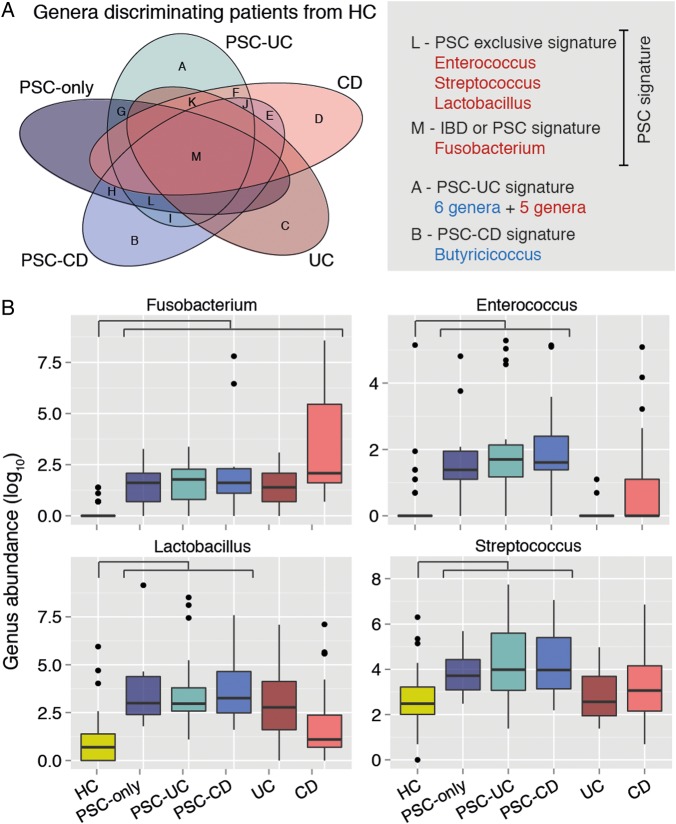
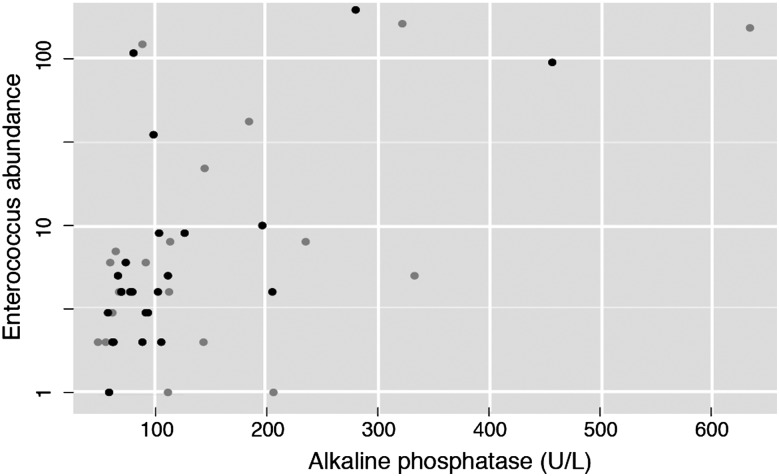
Objective: Primary sclerosing cholangitis (PSC) is a chronic cholestatic liver disease often leading to end-stage liver disease. Its pathogenesis remains largely unknown, although frequent concomitant IBD hints towards common factors underlying gut and bile duct inflammation. Considering the mounting evidence on the involvement of the intestinal microbiota in initiating and determining IBD phenotype, we investigated intestinal microbiota composition in patients with PSC. Design: Stool samples were collected from 147 individuals (52 patients with PSC, 52 age, gender and body mass index-matched healthy volunteers, 13 UC and 30 patients with Crohn's disease). An independent validation cohort of 14 PSC and 14 matched controls was recruited. 16S rDNA sequencing of faecal DNA was performed (Illumina MiSeq). Results: The microbiota of patients with PSC was characterised by decreased microbiota diversity, and a significant overrepresentation of Enterococcus (p=3.76e-05), Fusobacterium (p=3.76e-05) and Lactobacillus (p=0.0002) genera. This dysbiosis was present in patients with PSC with and without concomitant IBD and was distinct from IBD, and independent of treatment with ursodeoxycholic acid. A decision tree based on abundances of these three genera allowed reliable classification in the validation cohort. In particular, one operational taxonomic unit belonging to the Enterococcus genus was associated with increased levels of serum alkaline phosphatase (p=0.048), a marker of disease severity. Conclusions: We here present the first report of PSC-associated faecal dysbiosis, independent from IBD signatures, suggesting the intestinal microbiota could be a contributing factor in PSC pathogenesis. Further studies are needed to confirm these findings and assess causality.
Overview
The claims and statistics of this paper haven’t been checked yet.
Run the check — free, no account needed. It reads the open-access text and checks the sources it cites.
Integrity signals
Registry
Cites
Statistics
Figures
Verification
Claims the paper makes
The claims and statistics of this paper haven’t been checked yet.
Run the check — free, no account needed. It reads the open-access text and checks the sources it cites.
Claims other papers make about this one
Each is checked against this paper’s own text: does it say what the citing paper says it does?
In the citing paper
“Recent studies have further supported the association between changes in the microbiome and the progression of cholestatic liver disease in patients9–14.”
From Cholestasis induced by bile duct ligation promotes changes in the intestinal microbiome in mice (2019) · cites this paper as [11]
In the citing paper
“The changes described at genera level differ among studies9–12 and include the enrichment in Veillonella, Akkermansia, Ruminococcaceae (undefined genus) and Clostridium9 and the decrease in Prevotella10, overall supporting the association between changes in the microbiome and cholestatic disease.”
From Cholestasis induced by bile duct ligation promotes changes in the intestinal microbiome in mice (2019) · cites this paper as [11]
In the citing paper
“Recent studies described that cholestatic patients with PSC have an overall less diverse microbiome composition.”
From Cholestasis induced by bile duct ligation promotes changes in the intestinal microbiome in mice (2019) · cites this paper as [11]
Self-check
Percentages, sums and reported differences re-computed from the paper’s own numbers.
The self-check needs the paper’s full text.
Citations
Cites
phyloseq: An R Package for Reproducible Interactive Analysis and Graphics of Microbiome Census Data
McMurdie, P. J., & Holmes, S. (2013) · PLoS ONE · doi:10.1371/journal.pone.0061217 · Cited by 21,942
Search and clustering orders of magnitude faster than BLAST
Edgar, R. C. (2010) · Bioinformatics · doi:10.1093/bioinformatics/btq461 · Cited by 21,098
Naive Bayesian Classifier for Rapid Assignment of rRNA Sequences into the New Bacterial Taxonomy
Wang, Q., Garrity, G. M., Tiedje, J. M., & Cole, J. R. (2007) · Applied and Environmental Microbiology · doi:10.1128/aem.00062-07 · Cited by 20,145
The WEKA data mining software: an update
Hall, M., Frank, E., Holmes, G., Pfahringer, B., Reutemann, P., & Witten, I. H. (2009) · ACM SIGKDD Explorations Newsletter · doi:10.1145/1656274.1656278 · Cited by 17,750
FLASH: fast length adjustment of short reads to improve genome assemblies
Magoč, T., & Salzberg, S. L. (2011) · Bioinformatics · doi:10.1093/bioinformatics/btr507 · Cited by 15,366
UCHIME improves sensitivity and speed of chimera detection
Edgar, R. C., Haas, B. J., Clemente, J. C., Quince, C., & Knight, R. (2011) · Bioinformatics · doi:10.1093/bioinformatics/btr381 · Cited by 15,114
Kozich, J. J., Westcott, S. L., Baxter, N. T., Highlander, S. K., & Schloss, P. D. (2013) · Applied and Environmental Microbiology · doi:10.1128/aem.01043-13 · Cited by 7,246
Changes of Intestinal Functions in Liver Cirrhosis
Fukui, H., & Wiest, R. (2016) · Inflammatory Intestinal Diseases · doi:10.1159/000444436 · Cited by 6,820
Sokol, H., Pigneur, B., Watterlot, L., Lakhdari, O., Bermúdez-Humarán, L. G., Gratadoux, J.-J., Blugeon, S., Bridonneau, C., Furet, J.-P., Corthier, G., et al. (2008) · Proceedings of the National Academy of Sciences · doi:10.1073/pnas.0804812105 · Cited by 4,413
The Treatment-Naive Microbiome in New-Onset Crohn’s Disease
Gevers, D., Kugathasan, S., Denson, L. A., Vázquez-Baeza, Y., Van Treuren, W., Ren, B., Schwager, E., Knights, D., Song, S. J., Yassour, M., et al. (2014) · Cell Host & Microbe · doi:10.1016/j.chom.2014.02.005 · Cited by 3,220
Cited by
Sorted by citations
Quantitative microbiome profiling links gut community variation to microbial load
Vandeputte, D., Kathagen, G., D’hoe, K., Vieira-Silva, S., Valles-Colomer, M., Sabino, J., Wang, J., Tito, R. Y., De Commer, L., Darzi, Y., et al. (2017) · Nature · doi:10.1038/nature24460 · Cited by 1,218
Self-citationPrimary sclerosing cholangitis – a comprehensive review
Karlsen, T. H., Folseraas, T., Thorburn, D., & Vesterhus, M. (2017) · Journal of Hepatology · doi:10.1016/j.jhep.2017.07.022 · Cited by 868
Optimizing methods and dodging pitfalls in microbiome research
Kim, D. J., Hofstaedter, C. E., Zhao, C., Mattei, L. M., Tanes, C., Clarke, E., Lauder, A. P., Sherrill-Mix, S. A., Chehoud, C., Kelsen, J. R., et al. (2017) · Microbiome · doi:10.1186/s40168-017-0267-5 · Cited by 557
Gut microbiome and liver diseases
Tilg, H., Cani, P. D., & Mayer, E. A. (2016) · Gut · doi:10.1136/gutjnl-2016-312729 · Cited by 525
Gut microbiome, liver immunology, and liver diseases
Wang, R., Tang, R., Li, B., Ma, X., Schnabl, B., & Tilg, H. (2021) · Cellular & Molecular Immunology · doi:10.1038/s41423-020-00592-6 · Cited by 466
Primary sclerosing cholangitis
Dyson, J. K., Beuers, U. H., Jones, D. E. J., Lohse, A. W., & Hudson, M. (2018) · The Lancet · doi:10.1016/s0140-6736(18)30300-3 · Cited by 496
Tang, R., Wei, Y., Li, Y., Chen, W., Chen, H., Wang, Q., Yang, F., Miao, Q., Xiao, X., Zhang, H., et al. (2018) · Gut · doi:10.1136/gutjnl-2016-313332 · Cited by 434
AASLD practice guidance on primary sclerosing cholangitis and cholangiocarcinoma
Bowlus, C. L., Arrivé, L., Bergquist, A. M., Deneau, M. R., Forman, L., Ilyas, S. I., Lunsford, K. E., Martínez, M., Sapisochín, G., Shroff, R. T., et al. (2022) · Hepatology · doi:10.1002/hep.32771 · Cited by 462
Nakamoto, N., Sasaki, N., Aoki, R., Miyamoto, K., Suda, W., Teratani, T., Suzuki, T., Koda, Y., Chu, P.-S., Taniki, N., et al. (2019) · Nature Microbiology · doi:10.1038/s41564-018-0333-1 · Cited by 425
Targeting the gut-liver axis in liver disease
Wiest, R., Albillos, A., Trauner, M., Bajaj, J. S., & Jalan, R. (2017) · Journal of Hepatology · doi:10.1016/j.jhep.2017.05.007 · Cited by 427
Bajer, L., Kverka, M., Kostovčík, M., Mačinga, P., Dvořák, J., Stehlíková, Z., Březina, J., Wohl, P., Špičák, J., & Drastich, P. (2017) · World Journal of Gastroenterology · doi:10.3748/wjg.v23.i25.4548 · Cited by 376
Alterations of gut microbiome in autoimmune hepatitis
Wei, Y., Li, Y., Li, Y., Sun, C., Miao, Q., Wang, Q., Xiao, X., Lian, M., Li, B., Chen, Y., et al. (2019) · Gut · doi:10.1136/gutjnl-2018-317836 · Cited by 310
Fusobacterium nucleatum Secretes Outer Membrane Vesicles and Promotes Intestinal Inflammation
Engevik, M. A., Danhof, H. A., Ruan, W. H., Engevik, A. C., Chang‐Graham, A. L., Engevik, K. A., Shi, Z., Zhao, Y., Ardis, C. K., Krystofiak, E., et al. (2021) · mBio · doi:10.1128/mbio.02706-20 · Cited by 288
Vieira‐Silva, S., Sabino, J., Valles‐Colomer, M., Falony, G., Kathagen, G., Caenepeel, C., Cleynen, I., der Merwe, V., Vermeire, S., & Raes, J. (2019) · Nature Microbiology · doi:10.1038/s41564-019-0483-9 · Cited by 278
Self-citationGut Microbiome Directs Hepatocytes to Recruit MDSCs and Promote Cholangiocarcinoma
Zhang, Q., Ma, C., Duan, Y., Heinrich, B., Rosato, U., Diggs, L. P., Ma, L., Roy, S., Fu, Q., Brown, Z. J., et al. (2020) · Cancer Discovery · doi:10.1158/2159-8290.cd-20-0304 · Cited by 266
Bile acids and intestinal microbiota in autoimmune cholestatic liver diseases
Li, Y., Tang, R., Leung, P. S. C., Gershwin, M. E., & Ma, X. (2017) · Autoimmunity Reviews · doi:10.1016/j.autrev.2017.07.002 · Cited by 247
Wijnands, A. M., de Jong, M. E., Lutgens, M. W. M. D., Hoentjen, F., Elias, S. G., & Oldenburg, B. (2020) · Gastroenterology · doi:10.1053/j.gastro.2020.12.036 · Cited by 243
Allegretti, J. R., Kassam, Z., Carrellas, M., Mullish, B. H., Marchesi, J. R., Pechlivanis, A., Smith, M., Gerardin, Y., Timberlake, S., Pratt, D. S., et al. (2019) · American Journal of Gastroenterology · doi:10.14309/ajg.0000000000000115 · Cited by 234
The microbiome and autoimmunity: a paradigm from the gut–liver axis
Li, B., Selmi, C. F., Tang, R., Gershwin, M. E., & Ma, X. (2018) · Cellular and Molecular Immunology · doi:10.1038/cmi.2018.7 · Cited by 237
Gut–liver axis, cirrhosis and portal hypertension: the chicken and the egg
Arab, J. P., Martín‐Mateos, R., & Shah, V. H. (2017) · Hepatology International · doi:10.1007/s12072-017-9798-x · Cited by 233
Hedin, C. R. H., Vavricka, S., Stagg, A. J., Schoepfer, A. M., Raine, T., Puig, L., Pleyer, U., Navarini, A. A., Jong, A. E. V. D. M., Maul, J., et al. (2018) · Journal of Crohn s and Colitis · doi:10.1093/ecco-jcc/jjy191 · Cited by 232
Dysbiosis of small intestinal microbiota in liver cirrhosis and its association with etiology
Chen, Y., Ji, F., Guo, J., Shi, D., Fang, D., & Li, L. (2016) · Scientific Reports · doi:10.1038/srep34055 · Cited by 205
Fungi participate in the dysbiosis of gut microbiota in patients with primary sclerosing cholangitis
Lemoinne, S., Kemgang, A., Belkacem, K. B., Straube, M., Jégou, S., Corpechot, C., Saint-Antoine IBD Network, Chazouillères, O., Housset, C., & Sokol, H. (2019) · Gut · doi:10.1136/gutjnl-2018-317791 · Cited by 215
Woodhouse, C., Patel, V., Singanayagam, A., & Shawcross, D. L. (2017) · Alimentary Pharmacology & Therapeutics · doi:10.1111/apt.14397 · Cited by 212
Cheng, L., Qi, C., Zhuang, H., Fu, T., & Zhang, X. (2019) · Nucleic Acids Research · doi:10.1093/nar/gkz843 · Cited by 198
Immunology and immunotherapy of cholangiocarcinoma
Greten, T. F., Schwabe, R. F., Bardeesy, N. M., Ma, L., Goyal, L., Kelley, R. K., & Wang, X. W. (2023) · Nature Reviews Gastroenterology & Hepatology · doi:10.1038/s41575-022-00741-4 · Cited by 200
Liao, L., Schneider, K. M., Gálvez, E. J. C., Frissen, M., Marschall, H., Su, H., Hatting, M., Wahlstrom, A. M., Haybaeck, J., Puchas, P., et al. (2019) · Gut · doi:10.1136/gutjnl-2018-316670 · Cited by 176
The gut microbiome and mental health: implications for anxiety- and trauma-related disorders
Malan-Muller, S., Valles-Colomer, M., Raes, J., Lowry, C. A., Seedat, S., & Hemmings, S. M. J. (2018) · OMICS: A Journal of Integrative Biology · doi:10.1089/omi.2017.0077 · Cited by 161
Self-citationThe role of the gut microbiome in chronic liver disease: the clinical evidence revised
Schwenger, K. J. P., Clermont‐Dejean, N. M., & Allard, J. P. (2019) · JHEP Reports · doi:10.1016/j.jhepr.2019.04.004 · Cited by 179
Microbiota changes and intestinal microbiota transplantation in liver diseases and cirrhosis
Bajaj, J. S., & Khoruts, A. (2020) · Journal of Hepatology · doi:10.1016/j.jhep.2020.01.017 · Cited by 172
Thomas, A. M., Jesus, E. C., Lopes, A., Aguiar, S., Begnami, M. D., Rocha, R. M., Carpinetti, P. A., Camargo, A. A., Hoffmann, C., Freitas, H. C., et al. (2016) · Frontiers in Cellular and Infection Microbiology · doi:10.3389/fcimb.2016.00179 · Cited by 136
Intestinal and fecal pH in human health
Yamamura, R., Inoue, K. Y., Nishino, K., & Yamasaki, S. (2023) · Frontiers in Microbiomes · doi:10.3389/frmbi.2023.1192316 · Cited by 185
Genetics of primary sclerosing cholangitis and pathophysiological implications
Jiang, X., & Karlsen, T. H. (2017) · Nature Reviews Gastroenterology & Hepatology · doi:10.1038/nrgastro.2016.154 · Cited by 155
Autoantibodies in Autoimmune Liver Disease—Clinical and Diagnostic Relevance
Sebode, M., Weiler‐Normann, C., Liwinski, T., & Schramm, C. (2018) · Frontiers in Immunology · doi:10.3389/fimmu.2018.00609 · Cited by 167
Alterations of the bile microbiome in primary sclerosing cholangitis
Liwinski, T., Zenouzi, R., John, C., Ehlken, H., Rühlemann, M. C., Bang, C., Groth, S., Lieb, W., Kantowski, M., Andersen, N., et al. (2020) · Gut · doi:10.1136/gutjnl-2019-318416 · Cited by 149
Role of gut microbiota in liver disease
Albhaisi, S. A. M., Bajaj, J. S., & Sanyal, A. J. (2019) · American Journal of Physiology-Gastrointestinal and Liver Physiology · doi:10.1152/ajpgi.00118.2019 · Cited by 155
Role of Gut Dysbiosis in Liver Diseases: What Have We Learned So Far?
Fukui, H. (2019) · Diseases · doi:10.3390/diseases7040058 · Cited by 159
Liver–Microbiome Axis in Health and Disease
Adolph, T. E., Grander, C., Moschen, A. R., & Tilg, H. (2018) · Trends in Immunology · doi:10.1016/j.it.2018.05.002 · Cited by 167
Tedesco, D., Thapa, M., Chin, C. Y., Ge, Y., Gong, M., Li, J., Gumber, S., Speck, P., Elrod, E. J., Burd, E. M., et al. (2018) · Gastroenterology · doi:10.1053/j.gastro.2018.02.019 · Cited by 137
Zhao, M., Zhao, L., Xiong, X., He, Y. M., Huang, W., Liu, Z., Liang, J., Pan, B., Guo, X., Wang, L., et al. (2020) · Gastroenterology · doi:10.1053/j.gastro.2020.02.033 · Cited by 138
The gut ecosystem and immune tolerance
Shao, T., Hsu, R., Rafizadeh, D. L., Wang, L., Bowlus, C. L., Kumar, N., Mishra, J., Timilsina, S., Ridgway, W. M., Gershwin, M. E., et al. (2023) · Journal of Autoimmunity · doi:10.1016/j.jaut.2023.103114 · Cited by 143
Altered gut microbial metabolism of essential nutrients in primary sclerosing cholangitis
Kummen, M., Thingholm, L. B., Rühlemann, M. C., Holm, K., Hansen, S. H., Moitinho-Silva, L., Liwinski, T., Zenouzi, R., Storm-Larsen, C., Midttun, Ø., et al. (2021) · Gastroenterology · doi:10.1053/j.gastro.2020.12.058 · Cited by 129
Gut microbiota depletion exacerbates cholestatic liver injury via loss of FXR signalling
Schneider, K. M., Candels, L. S., Hov, J. R., Myllys, M., Hassan, R. A. R. A., Schneider, C. V., Wahlstrom, A. M., Mohs, A., Zühlke, S., Liao, L., et al. (2021) · Nature Metabolism · doi:10.1038/s42255-021-00452-1 · Cited by 126
Gut microbiome in primary sclerosing cholangitis: A review
Little, R., Wine, E., Kamath, B. M., Griffiths, A. M., & Ricciuto, A. (2020) · World Journal of Gastroenterology · doi:10.3748/wjg.v26.i21.2768 · Cited by 123
Cheng, L., Qi, C., Zhuang, H., Fu, T., & Zhang, X. (2020) · Nucleic Acids Research · doi:10.1093/nar/gkaa511 · Cited by 125
Torres, J., Palmela, C., Brito, H., Bao, X., Ruiqi, H., Moura-Santos, P., da Silva, J. P., Oliveira, A. A. S., Vieira, C. L., Pérez, K., et al. (2017) · United European Gastroenterology Journal · doi:10.1177/2050640617708953 · Cited by 121
Giuffrè, M., Campigotto, M., Campisciano, G., Comar, M., & Crocè, L. S. (2020) · American Journal of Physiology-Gastrointestinal and Liver Physiology · doi:10.1152/ajpgi.00161.2019 · Cited by 122
The microbiota and the gut–liver axis in primary sclerosing cholangitis
Hov, J. R., & Karlsen, T. H. (2022) · Nature Reviews Gastroenterology & Hepatology · doi:10.1038/s41575-022-00690-y · Cited by 133
Mechanisms and consequences of gut commensal translocation in chronic diseases
Fine, R. L., Vieira, S. M., Gilmore, M. S., & Kriegel, M. A. (2019) · Gut Microbes · doi:10.1080/19490976.2019.1629236 · Cited by 127
Composition and diverse differences of intestinal microbiota in ulcerative colitis patients
Zhu, S., Han, M., Liu, S., Fan, L., Shi, H., & Li, P. (2022) · Frontiers in Cellular and Infection Microbiology · doi:10.3389/fcimb.2022.953962 · Cited by 117
Inflammatory bowel disease and primary sclerosing cholangitis: One disease or two?
van Munster, K. N., Bergquist, A. M., & Ponsioen, C. Y. (2023) · Journal of Hepatology · doi:10.1016/j.jhep.2023.09.031 · Cited by 123
Shah, S. C., ten Hove, J. R., Castaneda, D., Palmela, C., Mooiweer, E., Colombel, J.-F., Harpaz, N., Ullman, T. A., van Bodegraven, A. A., Jansen, J. M., et al. (2018) · Clinical Gastroenterology and Hepatology · doi:10.1016/j.cgh.2018.01.023 · Cited by 109
Cholestatic Liver Disease: Current Treatment Strategies and New Therapeutic Agents
Hasegawa, S., Yoneda, M., Kurita, Y., Nogami, A., Honda, Y., Hosono, K., & Nakajima, A. (2021) · Drugs · doi:10.1007/s40265-021-01545-7 · Cited by 118
Ichikawa, M., Nakamoto, N., Kredo‐Russo, S., Weinstock, E., Weiner, I. N., Khabra, E., Ben-Ishay, N., Inbar, D., Kowalsman, N., Mordoch, R., et al. (2023) · Nature Communications · doi:10.1038/s41467-023-39029-9 · Cited by 115
Gut microbiome in chronic rheumatic and inflammatory bowel diseases: Similarities and differences
Salem, F., Kindt, N., Marchesi, J. R., Netter, P., Lopez, A., Kökten, T., Danese, S., Jouzeau, J., Peyrin‐Biroulet, L., & Moulin, D. (2019) · United European Gastroenterology Journal · doi:10.1177/2050640619867555 · Cited by 106
Inflammation-independent TL1A-mediated intestinal fibrosis is dependent on the gut microbiome
Jacob, N., Jacobs, J. P., Kumagai, K., Ha, C. W. Y., Kanazawa, Y., Lagishetty, V., Altmayer, K., Hamill, A. M., Von Arx, A., Sartor, R. B., et al. (2018) · Mucosal Immunology · doi:10.1038/s41385-018-0055-y · Cited by 102
Mousa, O. Y. S., Juran, B. D., McCauley, B. M., Vesterhus, M. N., Folseraas, T., Turgeon, C. T., Ali, A. H., Schlicht, E. M., Atkinson, E. J., Hu, C., et al. (2020) · Hepatology · doi:10.1002/hep.31652 · Cited by 109
Rühlemann, M. C., Liwinski, T., Heinsen, F., Bang, C., Zenouzi, R., Kummen, M., Thingholm, L. B., Tempel, M., Lieb, W., Karlsen, T. H., et al. (2019) · Alimentary Pharmacology & Therapeutics · doi:10.1111/apt.15375 · Cited by 102
Critical roles of bile acids in regulating intestinal mucosal immune responses
Sun, R., Xu, C., Feng, B., Gao, X., & Liu, Z. (2021) · Therapeutic Advances in Gastroenterology · doi:10.1177/17562848211018098 · Cited by 105
Liu, Q., Li, B., Li, Y., Wei, Y., Huang, B., Liang, J., You, Z., Li, Y., Qian, Q., Wang, R., et al. (2021) · Gut · doi:10.1136/gutjnl-2020-323565 · Cited by 101
The Gut-Liver Axis in Cholestatic Liver Diseases
Blesl, A., & Stadlbauer, V. (2021) · Nutrients · doi:10.3390/nu13031018 · Cited by 102
Pereira, P. A. B., Aho, V. T. E., Arola, J. T., Boyd, S., Jokelainen, K., Paulin, L. G., Auvinen, P., & Färkkilä, M. A. (2017) · PLoS ONE · doi:10.1371/journal.pone.0182924 · Cited by 96
Kunzmann, L. K., Schoknecht, T., Poch, T., Henze, L., Stein, S., Kriz, M., Grewe, I., Preti, M., Hartl, J., Pannicke, N., et al. (2020) · Hepatology · doi:10.1002/hep.31140 · Cited by 93
The IBD and PSC phenotypes of PSC-IBD
Ricciuto, A., Kamath, B. M., & Griffiths, A. M. (2018) · Current Gastroenterology Reports · doi:10.1007/s11894-018-0620-2 · Cited by 94
Characterization of Gut Microbiota in Children With Pulmonary Tuberculosis
Li, W., Zhu, Y., Liao, Q., Wang, Z., & Wan, C. (2019) · BMC Pediatrics · doi:10.1186/s12887-019-1782-2 · Cited by 94
Molecular and Cellular Mediators of the Gut-Liver Axis in the Progression of Liver Diseases
Bruneau, A., Hundertmark, J., Guillot, A., & Tacke, F. (2021) · Frontiers in Medicine · doi:10.3389/fmed.2021.725390 · Cited by 93
The Role of Gut Microbiota in Some Liver Diseases: From an Immunological Perspective
Wang, L., Cao, Z.-M., Zhang, L., Li, J.-M., & Lv, W. (2022) · Frontiers in Immunology · doi:10.3389/fimmu.2022.923599 · Cited by 89
Trivedi, P. J., Tickle, J., Vesterhus, M. N., Eddowes, P. J., Bruns, T., Vainio, J., Parker, R., Smith, D., Liaskou, E., Thorbjørnsen, L. W., et al. (2017) · Gut · doi:10.1136/gutjnl-2016-312354 · Cited by 83
Rosacea and its association with enteral microbiota in Korean females
Nam, J., Yun, Y., Kim, H., Kim, H., Jung, H. J., Chang, Y., Ryu, S., Shin, H., Kim, H., & Kim, W. (2017) · Experimental Dermatology · doi:10.1111/exd.13398 · Cited by 84
BingRong, C., Fu, S., Lu, L., & Zhao, H. (2019) · BioMed Research International · doi:10.1155/2019/1092563 · Cited by 82
Commensal Lactobacillus Controls Immune Tolerance during Acute Liver Injury in Mice
Nakamoto, N., Amiya, T., Aoki, R., Taniki, N., Koda, Y., Miyamoto, K., Teratani, T., Suzuki, T., Chiba, S., Chu, P., et al. (2017) · Cell Reports · doi:10.1016/j.celrep.2017.10.022 · Cited by 81
Isaacs‐Ten, A., Echeandia, M., Moreno‐Gonzalez, M., Brion, A., Goldson, A. J., Philo, M. R., Patterson, A. M., Parker, A., Galduroz, M., Baker, D., et al. (2020) · Hepatology · doi:10.1002/hep.31228 · Cited by 80
TREM-2 plays a protective role in cholestasis by acting as a negative regulator of inflammation
Labiano, I., Agirre-Lizaso, A., Olaizola, P., Echebarria, A., Huici-Izagirre, M., Olaizola, I., Esparza-Baquer, A., Sharif, O., Hijona, E., Milkiewicz, P., et al. (2022) · Journal of Hepatology · doi:10.1016/j.jhep.2022.05.044 · Cited by 78
Acharya, C., & Bajaj, J. S. (2020) · Gastroenterology · doi:10.1053/j.gastro.2020.10.056 · Cited by 79
The gut microbiota contributes to a mouse model of spontaneous bile duct inflammation
Schrumpf, E., Kummen, M., Valestrand, L., Greiner, T. U., Holm, K., Arulampalam, V., Reims, H. M., Baines, J. F., Bäckhed, F., Karlsen, T. H., et al. (2016) · Journal of Hepatology · doi:10.1016/j.jhep.2016.09.020 · Cited by 80
Kim, Y. S., Hurley, E., Park, Y., & Ko, S. (2023) · Experimental & Molecular Medicine · doi:10.1038/s12276-023-01042-9 · Cited by 79
Damman, J., Rodríguez, E. A., Ali, A. H., Buness, C. W., Cox, K. L., Carey, E. J., & Lindor, K. D. (2018) · Alimentary Pharmacology & Therapeutics · doi:10.1111/apt.14540 · Cited by 77
Shah, A., Macdonald, G. A., Morrison, M., & Holtmann, G. (2020) · The American Journal of Gastroenterology · doi:10.14309/ajg.0000000000000604 · Cited by 78
Intestinal virome and therapeutic potential of bacteriophages in liver disease
Hsu, C. L., Duan, Y., Fouts, D. E., & Schnabl, B. (2021) · Journal of Hepatology · doi:10.1016/j.jhep.2021.08.003 · Cited by 78
Wu, L., Zhou, J., Zhou, A., Lei, Y., Tang, L., Hu, S., Wang, S., Xu, X., Chen, Q., Tu, D., et al. (2024) · Gut Microbes · doi:10.1080/19490976.2024.2390176 · Cited by 83
Gut microbiota in liver disease: too much is harmful, nothing at all is not helpful either
Hartmann, P., Chu, H., Duan, Y., & Schnabl, B. (2019) · American Journal of Physiology-Gastrointestinal and Liver Physiology · doi:10.1152/ajpgi.00370.2018 · Cited by 74
The gut microbial influence on cholestatic liver disease
Kummen, M., & Hov, J. R. (2019) · Liver International · doi:10.1111/liv.14153 · Cited by 74
Chung, B. K., Karlsen, T. H., & Folseraas, T. (2017) · Biochimica et Biophysica Acta (BBA) - Molecular Basis of Disease · doi:10.1016/j.bbadis.2017.08.020 · Cited by 76
Sheng, Q., Du, H., Cheng, X., Cheng, X.-B., Tang, Y., Pan, L., Wang, Q., & Lin, J. (2019) · Oncology Letters · doi:10.3892/ol.2019.10841 · Cited by 70
Verstockt, B., Bressler, B. L., Martínez-Lozano, H., McGovern, D. P. B., & Silverberg, M. S. (2022) · Gastroenterology · doi:10.1053/j.gastro.2021.12.246 · Cited by 78
Gut microbiota translocation promotes autoimmune cholangitis
Ma, H.-D., Zhao, Z.-B., Ma, W.-T., Liu, Q.-Z., Gao, C., Li, L., Wang, J., Tsuneyama, K., Liu, B., Zhang, W., et al. (2018) · Journal of Autoimmunity · doi:10.1016/j.jaut.2018.09.010 · Cited by 72
Hata, K., Ishihara, S., Nozawa, H., Kawai, K., Kiyomatsu, T., Tanaka, T., Kishikawa, J., Anzai, H., & Watanabe, T. (2016) · Digestive Endoscopy · doi:10.1111/den.12744 · Cited by 71
Liu, R., Li, X., Huang, Z., Zhao, D., Sukka-Ganesh, B., Lai, G., Pandak, W. M., Hylemon, P. B., Bajaj, J. S., Sanyal, A. J., et al. (2017) · Hepatology · doi:10.1002/hep.29540 · Cited by 70
Iwasawa, K., Suda, W., Tsunoda, T., Oikawa‐Kawamoto, M., Umetsu, S., Inui, A., Fujisawa, T., Morita, H., Sogo, T., & Hattori, M. (2016) · Gut · doi:10.1136/gutjnl-2016-312533 · Cited by 66
Yu, L., Liu, Y., Wang, S., Zhang, Q., Zhao, J., Zhang, H., Narbad, A., Tian, F., Zhai, Q., & Chen, W. (2023) · Gut Microbes · doi:10.1080/19490976.2023.2181930 · Cited by 70
The Microbiome in Primary Sclerosing Cholangitis: Current Evidence and Potential Concepts
Hov, J., & Karlsen, T. (2017) · Seminars in Liver Disease · doi:10.1055/s-0037-1608801 · Cited by 65
Celiac Disease and Liver Disorders: From Putative Pathogenesis to Clinical Implications
Hoffmanová, I., Sánchez, D., Tučková, L., & Tlaskalová‐Hogenová, H. (2018) · Nutrients · doi:10.3390/nu10070892 · Cited by 65
Gut Microbiota Dysbiosis Is Associated with Altered Bile Acid Metabolism in Infantile Cholestasis
Wang, Y., Gao, X., Zhang, X., Xiao, Y., Huang, J., Yu, D., Li, X., Hu, H., Ge, T., Li, D., et al. (2019) · mSystems · doi:10.1128/msystems.00463-19 · Cited by 64
Caenepeel, C., Tabib, N. S. S., Vieira‐Silva, S., & Vermeire, S. (2020) · Alimentary Pharmacology & Therapeutics · doi:10.1111/apt.16096 · Cited by 65
Self-citationZhang, T., Zhang, S., Chen, J., Lin, Z., Deng, T., Xie, X., Deng, L., Li, X., Ma, J., Ding, X., et al. (2021) · Frontiers in Cellular and Infection Microbiology · doi:10.3389/fcimb.2021.751795 · Cited by 62
Cholestasis induced by bile duct ligation promotes changes in the intestinal microbiome in mice
Cabrera-Rubio, R., Patterson, A. M., Cotter, P. D., & Beraza, N. (2019) · Scientific Reports · doi:10.1038/s41598-019-48784-z · Cited by 61
The Role of Microbiota in Primary Sclerosing Cholangitis and Related Biliary Malignancies
Özdirik, B., Müller, T., Wree, A., Tacke, F., & Sigal, M. J. (2021) · International Journal of Molecular Sciences · doi:10.3390/ijms22136975 · Cited by 62
Iwasawa, K., Suda, W., Tsunoda, T., Oikawa‐Kawamoto, M., Umetsu, S., Takayasu, L., Inui, A., Fujisawa, T., Morita, H., Sogo, T., et al. (2018) · Scientific Reports · doi:10.1038/s41598-018-23870-w · Cited by 62
Fibrotic Events in the Progression of Cholestatic Liver Disease
Wu, H., Chen, C., Ziani, S., Nelson, L. J., Avila, M. A., Nevzorova, Y. A., & Cubero, F. J. (2021) · Cells · doi:10.3390/cells10051107 · Cited by 62
D’Onofrio, F., Renga, G., Puccetti, M., Pariano, M., Bellet, M. M., Santarelli, I., Stincardini, C., Mosci, P., Ricci, M., Giovagnoli, S., et al. (2021) · Cells · doi:10.3390/cells10071622 · Cited by 61
Metadata
- Authors
- Sabino, J., Vieira-Silva, S., Machiels, K., Joossens, M., Falony, G., Ballet, V., Ferrante, M., Van Assche, G., Van der Merwe, S., Vermeire, S., & Raes, J.
- Affiliations
- KU Leuven (BE)
- Department of Microbiology and Immunology, Laboratory of Molecular Bacteriology, KU Leuven—University of Leuven, Rega Institute for Medical Research, Leuven, Belgium
- Vrije Universiteit Brussel (BE)
- Rega Institute for Medical Research (BE)
- Translational Research Center for Gastrointestinal Disorders (TARGID), University of Leuven, Leuven, Belgium
- Department of Microbiology and Immunology, Center for the Biology of Disease, REGA institute, KU Leuven—VIB, Leuven, Belgium
- Corresponding author
- Raes, Jeroen
- Venue
- Gut
- Publisher
- BMJ
- Published
- 2016-05-20
- Volume
- 65
- Issue
- 10
- Pages
- 1681-1689
- ISSN
- 0017-5749 (ISSN-L)
- 1468-3288
- PMC
- PMC5036217
- OpenAlex
- W2408052000
- Cited by
- 413
- References
- 40
- Citations by year
- 2026: 28 · 2025: 28 · 2024: 46 · 2023: 46 · 2022: 42 · 2021: 52 · 2020: 44 · 2019: 45 · 2018: 33 · 2017: 34 · 2016: 13
- FWCI
- 21.65
- Type
- journal article
- Language
- en
- Open access
- hybrid
- doi.org
- Licence
- cc-by-nc
- Locations
- Gut (publishedVersion, cc-by-nc)
- Europe PMC (PubMed Central) (publishedVersion, cc-by-nc)
- PubMed Central (publishedVersion, cc-by-nc)
- PubMed (publishedVersion)
- Socio-Environmental Systems Modeling (acceptedVersion, cc-by-nc)
- Lirias (submittedVersion, cc-by-nc)
- Ghent University Academic Bibliography (Ghent University) (submittedVersion)
- Digital Access to Libraries (submittedVersion)
- HighWire Press Open Archive (submittedVersion)
- Funders
- Fonds Wetenschappelijk Onderzoek
- KU Leuven
- Vlaamse regering
- Topics
- Life Sciences › Biochemistry, Genetics and Molecular Biology › Molecular Biology › Gut microbiota and health
- Health Sciences › Medicine › Hepatology › Liver Diseases and Immunity
- Health Sciences › Medicine › Gastroenterology › Inflammatory Bowel Disease
- Keywords
- primary sclerosing cholangitis, gut dysbiosis, gut microbiota, inflammatory bowel disease, Enterococcus, Fusobacterium, Lactobacillus, microbiome diversity, Crohn's disease, ulcerative colitis, ursodeoxycholic acid, alkaline phosphatase, disease severity
- MeSH terms
- Gastrointestinal Microbiome, Adult, Aged, Alkaline Phosphatase, Biopsy, Cholagogues and Choleretics, Colonoscopy, Feces, Female, Humans, Male, Middle Aged, Severity of Illness Index, Statistics as Topic, Ursodeoxycholic Acid, Cholangitis, Sclerosing, Inflammatory Bowel Diseases, Enterococcus, Dysbiosis
About these checks
Registry, retraction, Cites and statistics results are computed, not judged, with one exception: a printed reference that no index lists is read once by a model before it counts as a citation error. Claims are extracted by a model and kept only when their quote appears verbatim in the text; each cited source is then checked, with a model’s help, for whether it says what the claim relies on. Those verdicts can be wrong — read the claim’s quote and the cited source before relying on one.
Statistics and arithmetic are recomputed, not judged.
Confidence bands are shown only for fields calibrated on our annotated test set. None is calibrated yet, so no band is shown.
What counts as a claim ›How we measure confidence ›How we check this ›
Are you an author, or do you see a problem with this page? Request a review
