

The DOI matches its Crossref record; 60 of the 60 references it cites were found in a registry or an index.
Long-term dietary patterns are associated with pro-inflammatory and anti-inflammatory features of the gut microbiome
Open accessAbstract
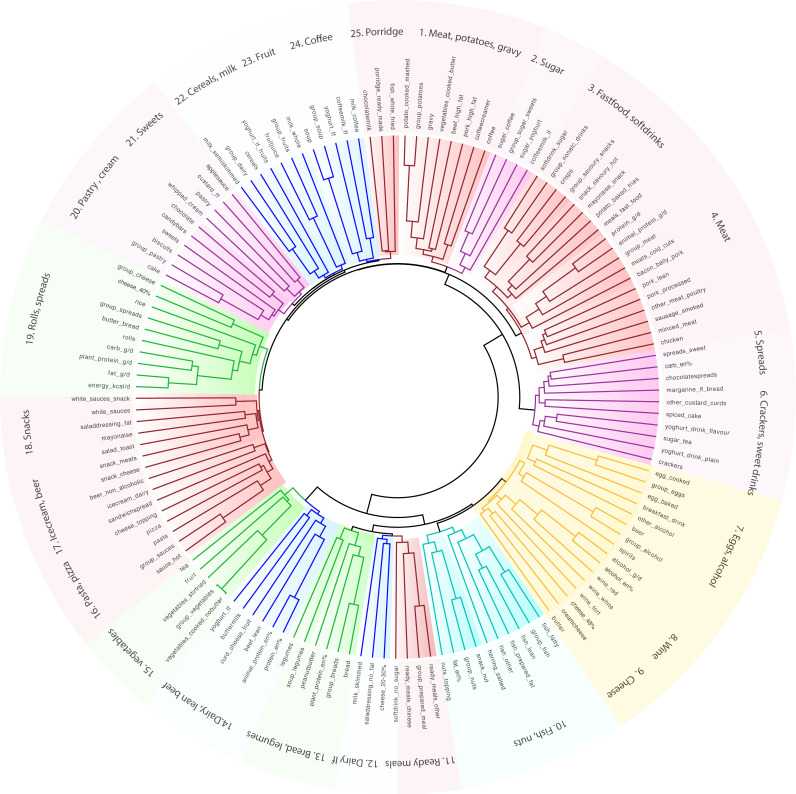
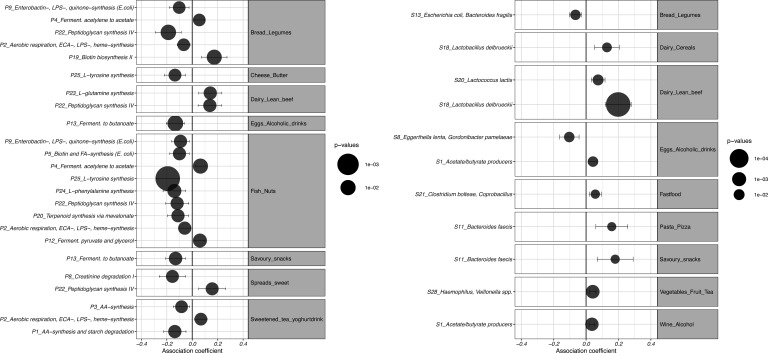
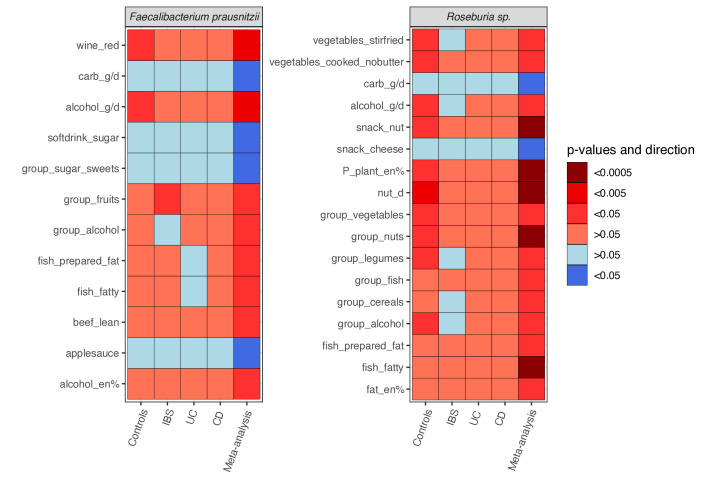
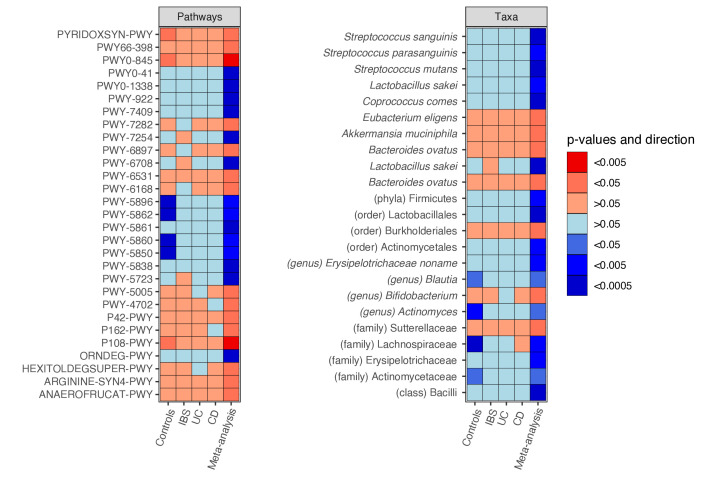
Objective: The microbiome directly affects the balance of pro-inflammatory and anti-inflammatory responses in the gut. As microbes thrive on dietary substrates, the question arises whether we can nourish an anti-inflammatory gut ecosystem. We aim to unravel interactions between diet, gut microbiota and their functional ability to induce intestinal inflammation. Design: We investigated the relation between 173 dietary factors and the microbiome of 1425 individuals spanning four cohorts: Crohn’s disease, ulcerative colitis, irritable bowel syndrome and the general population. Shotgun metagenomic sequencing was performed to profile gut microbial composition and function. Dietary intake was assessed through food frequency questionnaires. We performed unsupervised clustering to identify dietary patterns and microbial clusters. Associations between diet and microbial features were explored per cohort, followed by a meta-analysis and heterogeneity estimation. Results: We identified 38 associations between dietary patterns and microbial clusters. Moreover, 61 individual foods and nutrients were associated with 61 species and 249 metabolic pathways in the meta-analysis across healthy individuals and patients with IBS, Crohn’s disease and UC (false discovery rate<0.05). Processed foods and animal-derived foods were consistently associated with higher abundances of Firmicutes, Ruminococcus species of the Blautia genus and endotoxin synthesis pathways. The opposite was found for plant foods and fish, which were positively associated with short-chain fatty acid-producing commensals and pathways of nutrient metabolism. Conclusion: We identified dietary patterns that consistently correlate with groups of bacteria with shared functional roles in both, health and disease. Moreover, specific foods and nutrients were associated with species known to infer mucosal protection and anti-inflammatory effects. We propose microbial mechanisms through which the diet affects inflammatory responses in the gut as a rationale for future intervention studies.
Overview
The claims and statistics of this paper haven’t been checked yet.
Run the check — free, no account needed. It reads the open-access text and checks the sources it cites.
Integrity signals
Registry
Cites
Statistics
Figures
Verification
Claims the paper makes
The claims and statistics of this paper haven’t been checked yet.
Run the check — free, no account needed. It reads the open-access text and checks the sources it cites.
Claims other papers make about this one
Each is checked against this paper’s own text: does it say what the citing paper says it does?
In the citing paper
“The gut microbiota releases byproducts from the cell wall, such as endotoxins like LPS, which can act locally and may be present in the gut, gingiva, and skin, as well as other tissues, causing dysregulation of GBA signaling (64), or can cross the intestinal barrier to enter the circulatory system; this is called metabolic endotoxemia (65).”
From Modulation of the gut–brain axis via the gut microbiota: a new era in treatment of amyotrophic lateral sclerosis (2023) · cites this paper as [65]
In the citing paper
“The Mediterranean diet has been associated with an increased abundance of bacteria producing SCFAs3 that have been shown to be predictive of immunotherapy response in several studies.2,4,5,6”
From Association of a Mediterranean Diet With Outcomes for Patients Treated With Immune Checkpoint Blockade for Advanced Melanoma (2023) · cites this paper as [3]
In the citing paper
“Previous studies have suggested that long-term dietary habits play a role in shaping the composition and metabolic activity of the gut microbiota.”
From Adaptation to tolerate high doses of arabinoxylan is associated with fecal levels of Bifidobacterium longum (2024) · cites this paper as [55]
Self-check
Percentages, sums and reported differences re-computed from the paper’s own numbers.
The self-check needs the paper’s full text.
Citations
Cites
1 retracted
ESPEN guideline: Clinical nutrition in inflammatory bowel disease
Forbes, A., Escher, J., Hébuterne, X., Kłęk, S., Krznaric, Z., Schneider, S., Shamir, R., Stardelova, K., Wierdsma, N., Wiskin, A. E., et al. (2017) · Clinical Nutrition · doi:10.1016/j.clnu.2016.12.027 · Cited by 625
RetractedDiet rapidly and reproducibly alters the human gut microbiome
David, L. A., Maurice, C. F., Carmody, R. N., Gootenberg, D. B., Button, J. E., Wolfe, B. E., Ling, A. V., Devlin, A. S., Varma, Y., Fischbach, M. A., et al. (2014) · Nature · doi:10.1038/nature12820 · Cited by 10,100
From Dietary Fiber to Host Physiology: Short-Chain Fatty Acids as Key Bacterial Metabolites
Koh, A., De Vadder, F., Kovatcheva-Datchary, P., & Bäckhed, F. (2016) · Cell · doi:10.1016/j.cell.2016.05.041 · Cited by 7,070
Linking long-term dietary patterns with gut microbial enterotypes
Wu, G. D., Chen, J., Hoffmann, C., Bittinger, K., Chen, Y.-Y., Keilbaugh, S. A., Bewtra, M., Knights, D., Walters, W. A., Knight, R., et al. (2011) · Science · doi:10.1126/science.1208344 · Cited by 6,513
Reproducibility and validity of a semiquantitative food frequency questionnaire
WILLETT, W. C., SAMPSON, L., STAMPFER, M. J., ROSNER, B., BAIN, C., WITSCHI, J., HENNEKENS, C. H., & SPEIZER, F. E. (1985) · American Journal of Epidemiology · doi:10.1093/oxfordjournals.aje.a114086 · Cited by 4,274
Commensal Bifidobacterium promotes antitumor immunity and facilitates anti–PD-L1 efficacy
Sivan, A., Corrales, L., Hubert, N., Williams, J. B., Aquino-Michaels, K., Earley, Z. M., Benyamin, F. W., Man Lei, Y., Jabri, B., Alegre, M.-L., et al. (2015) · Science · doi:10.1126/science.aac4255 · Cited by 3,888
Turnbaugh, P. J., Bäckhed, F., Fulton, L., & Gordon, J. I. (2008) · Cell Host & Microbe · doi:10.1016/j.chom.2008.02.015 · Cited by 2,915
Desai, M. S., Seekatz, A. M., Koropatkin, N. M., Kamada, N., Hickey, C. A., Wolter, M., Pudlo, N. A., Kitamoto, S., Terrapon, N., Muller, A., et al. (2016) · Cell · doi:10.1016/j.cell.2016.10.043 · Cited by 2,805
Influence of diet on the gut microbiome and implications for human health
Singh, R. K., Chang, H.-W., Yan, D., Lee, K. M., Ucmak, D., Wong, K., Abrouk, M., Farahnik, B., Nakamura, M., Zhu, T. H., et al. (2017) · Journal of Translational Medicine · doi:10.1186/s12967-017-1175-y · Cited by 2,599
Artificial sweeteners induce glucose intolerance by altering the gut microbiota
Suez, J., Korem, T., Zeevi, D., Zilberman-Schapira, G., Thaiss, C. A., Maza, O., Israeli, D., Zmora, N., Gilad, S., Weinberger, A., et al. (2014) · Nature · doi:10.1038/nature13793 · Cited by 2,067
Research works printed but not linked: 1
- 10.1186/s12967-017-1175-y · DOI · Paper page
Cited by
Sorted by citations
Items 301–400 of 601
Leibovitzh, H., Shabat, C. S., Hirsch, A., Zittan, E., Mentella, M. C., Petito, V., Cohen, N. A., Ron, Y., Isakov, N. F., Pfeffer, J., et al. (2024) · Journal of Crohn s and Colitis · doi:10.1093/ecco-jcc/jjae062 · Cited by 8
Li, Z., Chen, X., Huang, J., Cheng, F., Wu, Z., Yuan, L., Li, X., & Shen, W. (2024) · Frontiers in Nutrition · doi:10.3389/fnut.2024.1364835 · Cited by 8
McGourty, K., Vijayakumar, R., Wu, T., Gagnon, A., & Kelleher, S. (2022) · International Journal of Molecular Sciences · doi:10.3390/ijms231911467 · Cited by 9
Carson, T. L., Byrd, D. A., Smith, K. S., Carter, D., Abaskaron, M., Little, R. B., Townsend, S., Pol, W. J. V. D., Lefkowitz, E. J., Morrow, C. D., et al. (2023) · Research Square · doi:10.21203/rs.3.rs-2475944/v1 · Cited by 8
Molinsky, R. L., Johnson, A. J., Marotz, L., Roy, S. S., Bohn, B., Goh, C. E., Chen, C., Paster, B. J., Knight, R. D., Genkinger, J. M., et al. (2024) · Journal Of Clinical Periodontology · doi:10.1111/jcpe.14067 · Cited by 8
Refractory psoriatic arthritis: emerging concepts in whole process management
Xu, H., Wang, Z., Xu, L., & Su, Y. (2025) · Clinical Rheumatology · doi:10.1007/s10067-024-07267-x · Cited by 7
S3-Leitlinie Klinische Ernährung bei chronisch-entzündlichen Darmerkrankungen
Bischoff, S. C., Blumenstein, I., der Smitten, S. I., Jochum, F., Krieger‐Grübel, C., Kroesen, A. J., Moschen, A. R., Ockenga, J., Schäfer, C., Schwerd, T., et al. (2025) · Aktuelle Ernährungsmedizin · doi:10.1055/a-2514-0359 · Cited by 7
Pu, Y., Tan, Z., Wu, Y., Zeng, S., He, H., Zhang, J., & Dong, W. (2025) · Frontiers in Nutrition · doi:10.3389/fnut.2025.1573636 · Cited by 8
Liu, X., Zhou, H., Yang, N., Yang, L.-J., Zi, Z.-Y., Han, Y.-L., He, J., & Su, L. (2025) · Phytomedicine · doi:10.1016/j.phymed.2025.157019 · Cited by 7
Arslan, S., & Selçuk, K. T. (2025) · Nutrire · doi:10.1186/s41110-025-00382-y · Cited by 8
Yin, B., Liu, H.-Y., Tan, B., Deng, J.-M., & Xie, S. (2023) · Fish and Shellfish Immunology · doi:10.1016/j.fsi.2023.109033 · Cited by 5
Yoon, H., Park, S., Jun, Y. K., Choi, Y., Shin, C. M., Park, Y. S., Kim, N., & Lee, D. H. (2023) · Microorganisms · doi:10.3390/microorganisms11122882 · Cited by 7
Diao, N., Liu, X., Lin, M., Yang, Q., Li, B., Tang, J., Ding, N., Gao, X., & Chao, K. (2023) · Nutrients · doi:10.3390/nu15245091 · Cited by 7
Dietary composition of adult eosinophilic esophagitis patients is related to disease severity
Eussen, S. R. B. M., Wielders, S., de Rooij, W. E., van Ampting, M. T. J., van Esch, B. C. A. M., de Vries, J. H. M., Bredenoord, A. J., & Vlieg‐Boerstra, B. (2024) · Immunity Inflammation and Disease · doi:10.1002/iid3.1206 · Cited by 7
Reverse‐engineered exclusive enteral nutrition in pediatric Crohn's disease: A pilot trial
Lee, D. Y., Braly, K., Nuding, M. E., Braly, I., Hopp, C., Twible, H., Pope, C. E., Hayden, H. S., Hoffman, L., Zheng, H. B., et al. (2024) · Journal of Pediatric Gastroenterology and Nutrition · doi:10.1002/jpn3.12196 · Cited by 7
Yang, Z., Zhu, J., Lu, W., Tian, F., Zhang, H., & Chen, W. (2024) · Food Bioscience · doi:10.1016/j.fbio.2024.104541 · Cited by 8
Lamers, C. R., van Erp, L. W., Slotegraaf, A. I., Groenen, M. J. M., de Roos, N. M., Wahab, P. J., & Witteman, B. J. M. (2022) · British Journal Of Nutrition · doi:10.1017/s0007114522001064 · Cited by 8
Xiao, X., Cui, Y., Lu, H., Wang, J., Yang, J., Liu, L., Liu, Z., Peng, X., Cao, H., Liu, X., et al. (2023) · BMC Microbiology · doi:10.1186/s12866-023-03109-z · Cited by 7
Intestinal FFA2 promotes obesity by altering food intake in Western diet-fed mice
Lednovich, K., Gough, S., Priyadarshini, M., Pandya, N., Nnyamah, C., Xu, K., Wicksteed, B. L., Mishra, S. P., Jain, S., Zapater, J. L., et al. (2023) · Journal of Endocrinology · doi:10.1530/joe-23-0184 · Cited by 10
DAMP-ing IBD: Extinguish the Fire and Prevent Smoldering
Sandys, O., Stokkers, P. C. F., & Velde, A. A. T. (2024) · Digestive Diseases and Sciences · doi:10.1007/s10620-024-08523-5 · Cited by 9
ELOVL5 and VLDLR synergistically affect n-3 PUFA deposition in eggs of different chicken breeds
Jiang, C., Shi, Y., Shi, X., Yan, J., Lin, X., Zhuang, L., Li, J., Xu, G., & Zheng, J. (2024) · Poultry Science · doi:10.1016/j.psj.2024.104016 · Cited by 6
Beyond the gut: Unraveling the multifaceted influence of microbiome on cardiovascular health
Okunlola, F. O., Okunlola, A. R., Adetuyi, B. O., Soliman, M. E. S., Alexiou, A. T., Papadakis, M., Fawzy, M. N., & Batiha, G. E. (2025) · Clinical Nutrition ESPEN · doi:10.1016/j.clnesp.2025.03.002 · Cited by 7
He, B., Shen, X., Feng, L., Zhou, R., Xue, H., Fan, X., Wang, Z., Guo, X., Yu, F., Luo, G., et al. (2025) · Stem Cell Research & Therapy · doi:10.1186/s13287-025-04256-y · Cited by 8
Zhou, Y., Yang, Z., Zhuang, H., Chen, T., Koay, S. S. N., Li, R., Jiang, G., & Liu, Z. (2025) · Food & Function · doi:10.1039/d4fo04815f · Cited by 6
Sherpa, P. L., Matsumoto, T., Tshering, K., Pradhan, B., Akada, J. K., & Yamaoka, Y. (2025) · Gut Pathogens · doi:10.1186/s13099-025-00715-2 · Cited by 6
Zhan, J., Cheng, J., Yang, Y., Xu, X., Lu, Z., Li, L., Li, H., Yang, Q., Hu, Y., Song, Y., et al. (2025) · Frontiers in Pharmacology · doi:10.3389/fphar.2025.1587119 · Cited by 6
Sun, Y., Wu, D., Lu, L., Wang, J., Li, X., Mao, X., & Zhang, Y. (2025) · Stem Cell Research & Therapy · doi:10.1186/s13287-025-04448-6 · Cited by 6
Wu, W., Cheng, J., Hou, Z., Yan, Q., Wang, X., He, J., Zhu, Y., & Li, J. (2025) · Diabetology & Metabolic Syndrome · doi:10.1186/s13098-025-01846-x · Cited by 7
Wu, W., & Hou, Z. (2025) · Frontiers in Immunology · doi:10.3389/fimmu.2025.1593245 · Cited by 7
Gut microbiota as a metabolic mediator to prevent or attenuate MASLD
Luo, J., Wei, Y., Fan, Z., Li, B., Li, L., Chai, Y., Xing, Z., Qiu, Y., Lu, W., & Fang, Z. (2025) · Critical Reviews in Food Science and Nutrition · doi:10.1080/10408398.2025.2545525 · Cited by 7
The Role of Gut Microbiota in Chronic Noncommunicable Diseases: An Overview of the Last Decade
Minari, T. P., & Pisani, L. P. (2025) · Nutrition Reviews · doi:10.1093/nutrit/nuaf200 · Cited by 7
Precision nutrition for the prevention and management of inflammatory bowel disease
Chen, J., Dan, L., Wellens, J., Jairath, V., Yanai, H. A., Khalili, H., Danese, S., Peyrin‐Biroulet, L., Wang, X., Li, X., et al. (2026) · Nature Reviews Gastroenterology & Hepatology · doi:10.1038/s41575-026-01213-9 · Cited by 6
Longo, P. L., de Aquino, R. D. C., Ortiz, S. R. M., de Oliveira, R. S., Gavioli, A., do Amaral, J. B., Monteiro, F. R., Franco, R. R. D. A., Mereu, G. R., Bachi, A. L. L., et al. (2022) · Frontiers in Nutrition · doi:10.3389/fnut.2022.972100 · Cited by 7
Bakhshimoghaddam, F., Shalilahmadi, D., Mahdavi, R., Nikniaz, Z., Karandish, M., & Hajjarzadeh, S. (2024) · Scientific Reports · doi:10.1038/s41598-024-66776-6 · Cited by 6
Combined healthy lifestyles and risk of depressive symptoms: A baseline survey in China
Qie, R., Huang, H., Sun, P., Bi, X., Chen, Y., Liu, Z., Chen, Q., Zhang, S., Liu, Y., Wei, J., et al. (2024) · Journal of Affective Disorders · doi:10.1016/j.jad.2024.07.134 · Cited by 6
Gravina, A. G., Pellegrino, R., Palladino, G., Zanini, A., Federico, A., & Zingone, F. (2024) · Gastroenterology Insights · doi:10.3390/gastroent15040067 · Cited by 7
Jiménez-Arroyo, C., Molinero, N., Sabater, C., Margollés, A., Terron-Camero, L. C., Andrés‐León, E., Ramos, M., Val, M. D., & Moreno-Arribas, M. V. (2024) · Frontiers in Cellular and Infection Microbiology · doi:10.3389/fcimb.2024.1494193 · Cited by 6
Role of a Whole Plant Foods Diet in Breast Cancer Prevention and Survival
Jiménez, M. D. C. F.-F. (2025) · Journal of the American Nutrition Association · doi:10.1080/27697061.2024.2442631 · Cited by 7
Cavanaugh, S. M., Cavanaugh, R. P., Streeter, R. M., Vieira, A. B., Gilbert, G. E., & Ketzis, J. K. (2022) · Frontiers in Veterinary Science · doi:10.3389/fvets.2022.936092 · Cited by 6
Golzarand, M., Toolabi, K., Douraghi, M., Mirmiran, P., & Djafarian, K. (2023) · Obesity Surgery · doi:10.1007/s11695-023-06760-7 · Cited by 6
Bibliometric analysis of the impact of ultra‐processed foods on the gut microbiota
Baspakova, A. M., Bazargaliyev, Y., Kaliyev, A. A., Mussin, N. M., Karimsakova, B. K., Akhmetova, S. Z., & Tamadon, A. (2024) · International Journal of Food Science & Technology · doi:10.1111/ijfs.16894 · Cited by 6
Schenkelaars, N., van Rossem, L., Willemsen, S. P., Faas, M. M., Schoenmakers, S., & Steegers‐Theunissen, R. P. M. (2024) · European Journal of Nutrition · doi:10.1007/s00394-024-03334-w · Cited by 8
Day, M., Sing, E., Spencer, M., Moellenberg, K., Mello, I., & Moore, A. (2024) · Nursing · doi:10.1097/nsg.0000000000000063 · Cited by 6
Li, M., Yu, J., Li, W., Wu, Q., Sun, J., & Sun, Z. (2024) · Food Science and Human Wellness · doi:10.26599/fshw.2022.9250243 · Cited by 5
The gut microbiota in spondyloarthritis: an update
Rodríguez, V. R., Essex, M., & Poddubnyy, D. (2025) · Current Opinion in Rheumatology · doi:10.1097/bor.0000000000001079 · Cited by 5
Liu, P., Yang, J., Tobias, D. K., Tabung, F. K., Hu, F. B., & Zhang, C. (2025) · BMC Medicine · doi:10.1186/s12916-025-04188-7 · Cited by 5
Kongsintaweesuk, S., Tunbenjasiri, K., Pongking, T., Roytrakul, S., Charoenlappanit, S., Anutrakulchai, S., Pairojkul, C., Intuyod, K., Tanasuka, P., Blair, D., et al. (2025) · Life Sciences · doi:10.1016/j.lfs.2025.123840 · Cited by 5
The unique role of Sn-2 fatty acids in TAGs Utilization: Implications for nutrition and health
Dong, H., Chen, Q., Chen, L., & Wang, X. (2025) · Food Bioscience · doi:10.1016/j.fbio.2025.107205 · Cited by 5
Impact of degradation and time of sampling on gut Microbiome composition in wild-caught marine fish
Zhou, Y., Trujillo‐González, A., Nicol, S., Boutigny, M., Huerlimann, R., Sarre, S. D., & Gleeson, D. M. (2025) · Scientific Reports · doi:10.1038/s41598-025-14683-9 · Cited by 5
The association between a pro-inflammatory diet and brain age in middle-aged and older adults
Dunk, M. M., Huang, H., Wang, J., Dove, A. E., Sakakibara, S., Guo, J., Carballo‐Casla, A., Bennett, D. A., & Xu, W. (2025) · European Journal of Epidemiology · doi:10.1007/s10654-025-01318-6 · Cited by 5
Phytate enhances gut Parasutterella colonization to alleviate radiation injury
Li, Y., Qiu, J., Liu, Z., Xiao, H., Wang, B., Dong, Y., Xiao, Y., Wang, Q., Dong, J., & Cui, M. (2025) · Cell chemical biology · doi:10.1016/j.chembiol.2025.10.009 · Cited by 5
Calcaterra, V., Cena, H., Ferrara, C., Magenes, V. C., Boussetta, S., Zambon, I., & Zuccotti, G. (2025) · Nutrients · doi:10.3390/nu17233744 · Cited by 7
Williams, G. M., Hoedt, E. C., Duncanson, K., Gan, L. T., Prakoso, E., Talley, N. J., & Beck, E. J. (2025) · Nutrition & Metabolism · doi:10.1186/s12986-025-00939-8 · Cited by 5
Elbehiry, A., Marzouk, E., Alhumaydhi, F. A., & Abalkhail, A. (2026) · Journal of Clinical Medicine · doi:10.3390/jcm15051788 · Cited by 7
A gut microbiome-kidney-heart axis predictive of future cardiovascular diseases
Chechi, K., Chakaroun, R., Myridakis, A., Forslund, S. K., Fromentin, S., Nielsen, T., Aron‐Wisnewsky, J., Belda, E., Prifti, E., Lassen, P. B., et al. (2026) · Nature Communications · doi:10.1038/s41467-026-69405-0 · Cited by 6
Challenges, advances and future directions in nutritional epidemiology
Zhang, J., Geng, T., Wang, Y., Yu, H., Xia, P., Yuan, C., Huang, T., Zong, G., Zheng, J.-S., Liu, G., et al. (2026) · The Innovation Nutrition · doi:10.59717/j.xinn-nutri.2026.100009 · Cited by 6
Study of gut microbiome alterations in plaque psoriasis patients compared to healthy individuals
Polak, K., Muszyński, T., Frątczak, A., Meznerics, F. A., Bánvölgyi, A., Kiss, N., Miziołek, B., & Bergler-Czop, B. S. (2024) · Advances in Dermatology and Allergology · doi:10.5114/ada.2024.142394 · Cited by 5
Chen, Q., Sha, Y., Liu, X., Gao, M., Chen, X., Yang, W., Huang, W., Wang, J., He, Y., Gao, X., et al. (2025) · Animals · doi:10.3390/ani15111603 · Cited by 5
Dietary soybeans worsen dextran sodium sulfate-induced colitis by disrupting intestinal ecology
Chen, K., Gao, C., Tang, M., Dong, Q., Wang, N., Man, S., Lu, F., & Wang, H. (2022) · Food & Function · doi:10.1039/d2fo00446a · Cited by 5
Tea Consumption and Gut Microbiome in Older Chinese Adults
Wang, L., Shu, X., Cai, H., Yang, Y., Xu, W., Wu, J., Cai, Q., Zheng, W., & Yu, D. (2022) · Journal of Nutrition · doi:10.1016/j.tjnut.2022.12.002 · Cited by 5
Sun, Y., Li, X., Zhang, G., Han, L., Wu, H., Peng, W., & Zhao, L. (2023) · Nutritional Neuroscience · doi:10.1080/1028415x.2023.2218563 · Cited by 5
The Role of Gut Microbiome in the Pathogenesis and the Treatment of Inflammatory Bowel Diseases
Vidal-Gallardo, A., Benítez, J. E. M., Rios, L. F., Meza, L. F. O., Pérez, R. A. M., Romero, E. M., Vargas-Beltran, A. M., Hernandez, J. L. B., Banegas, D., Perez, B., et al. (2024) · Cureus · doi:10.7759/cureus.54569 · Cited by 5
Liu, L., Huang, J., Huang, Y., Qin, Z., & Zhang, F. (2025) · Aquaculture Nutrition · doi:10.1155/anu/5594265 · Cited by 4
Li, Q., Wang, G., Zhao, J., Chen, W., & Tian, P. (2025) · Microbiological Research · doi:10.1016/j.micres.2025.128286 · Cited by 6
Schorr, K., Beekman, M., Agayn, V., de Vries, J. H. M., de Groot, C. P. G. M., & Slagboom, P. E. (2025) · Journal of Nutritional Science · doi:10.1017/jns.2025.10023 · Cited by 7
Intestinal Bacterium Akkermansia muciniphila Inhibits Progression of Abdominal Aortic Aneurysm
He, X., Liu, Y., Zhou, H., & Wu, K.-M. (2025) · Antioxidants and Redox Signaling · doi:10.1177/15230864251376034 · Cited by 5
Hou, X., Wu, H., Yue, R., Zhou, X., Chen, Y., Luo, L., Lin, S., Ge, H., & He, Y. (2025) · Microorganisms · doi:10.3390/microorganisms13112535 · Cited by 4
López-Fernández-Roldán, Á., Serrano-Fernandez, V., Laredo‐Aguilera, J. A., Barroso‐Corroto, E., de Paz-Montón, L. P., & Carmona‐Torres, J. M. (2026) · Nutrients · doi:10.3390/nu18020299 · Cited by 5
Zhai, J., Li, Y., Liu, J., & Dai, C. (2026) · Clinical and Translational Discovery · doi:10.1002/ctd2.70117 · Cited by 4
Soy and the gut microbiome: a bi-directional relationship shaping nutrition and health
Nolan, L., & O’Toole, P. W. (2026) · European Journal of Nutrition · doi:10.1007/s00394-026-03900-4 · Cited by 4
Zhang, C., Lin, H., Wei, C., Long, X., Bai, S., Wu, H., Li, X., Zhou, Y., Li, S., Gao, Y., et al. (2026) · Carbohydrate Polymers · doi:10.1016/j.carbpol.2026.125225 · Cited by 5
Gut microbiota of healthy Asians and their discriminative features revealed by metagenomics approach
Taha, S. F. M., Bhassu, S., Omar, H., Raju, C. S., Rajamanikam, A., Govind, S. K., & Mohamad, S. B. (2023) · 3 Biotech · doi:10.1007/s13205-023-03671-3 · Cited by 4
da Costa, P. C. T., Duarte, D. B., das Neves, T. A. F. V., de Moraes, R. C. S., Toscano, L. T., Neta, A. D. C. P. D. A., Martins, V. J. B., & Alves, J. L. D. B. (2024) · Nutrients · doi:10.3390/nu16152477 · Cited by 5
Wei, D.-F., Xu, W., & Song, X.-Z. (2025) · European Journal of Nutrition · doi:10.1007/s00394-025-03677-y · Cited by 4
Szilagyi, A., Wyse, J. M., & Abdulezer, J. (2025) · Current Gastroenterology Reports · doi:10.1007/s11894-025-00980-w · Cited by 4
Nohesara, S., Abdolmaleky, H. M., Dickerson, F., Pinto‐Tomás, A. A., Jeste, D. V., & Thiagalingam, S. (2025) · Neuroscience & Biobehavioral Reviews · doi:10.1016/j.neubiorev.2025.106208 · Cited by 5
Liao, Y., Guo, J., Gao, Z., Pan, Z., Peng, M., Fu, Y., Fu, F., & Shan, Y. (2025) · Food Frontiers · doi:10.1002/fft2.70021 · Cited by 4
Thomas, R., Williams, M. M. A., Aldous, J. W. F., & Wyld, K. (2023) · Nutraceuticals · doi:10.3390/nutraceuticals3030027 · Cited by 4
Alterations in the “Gut–Liver Axis” on Rats with Immunological Hepatic Fibrosis
Qi, Z., Qi, X., Xu, Y., Sun, H., Li, D., Liu, J., Cong, M., & Liu, T. (2023) · Journal of Immunology Research · doi:10.1155/2023/5577850 · Cited by 4
Crohn’s disease in hemophilic arthropathy patient: a case report
Zhang, Z., Chen, L., Zhou, H., Chen, G., & Tong, P. (2024) · BMC Musculoskeletal Disorders · doi:10.1186/s12891-024-07610-y · Cited by 4
Li, Q., Chen, Y., Yang, M., & Li, P. (2024) · BMC Public Health · doi:10.1186/s12889-024-20490-0 · Cited by 4
Deng, N., Xie, S., Liu, Q., Peng, H., Fang, L., Shen, J., & Lin, X. (2025) · Frontiers in Cellular and Infection Microbiology · doi:10.3389/fcimb.2025.1549617 · Cited by 4
Huang, X., Hu, L., Sun, W., Shao, Z., Ma, W., Yuan, Q., Liu, J., Wu, D., Cheng, L., & Li, H. (2025) · Journal of Pharmaceutical and Biomedical Analysis · doi:10.1016/j.jpba.2025.117121 · Cited by 4
Wang, D., Meng, S., Li, J., Zhao, J., Wang, Y. H. D., Du, M., Wang, Y., Lu, W., & Zhu, Y. (2023) · Nutrients · doi:10.3390/nu15173705 · Cited by 4
Gunchick, V., Wen, W., Jia, G., Roberts, L. R., Koshiol, J. E., Shu, X., & Zheng, W. (2024) · International Journal of Cancer · doi:10.1002/ijc.35048 · Cited by 4
Gut microbiota, malnutrition, and immunity: COVID-19’s confounding triad
Creus-Cuadros, A., Tabusi, M., Carpio-Arias, T. V., & Finlay, B. B. (2023) · Cell Host & Microbe · doi:10.1016/j.chom.2023.05.020 · Cited by 4
Qu, Y., Lyu, R., Wang, D., Dai, Y., Turcan, A., Yu, S., Xie, J., Roach, J. M., Butler, C. A., Yap, P., et al. (2025) · bioRxiv (Cold Spring Harbor Laboratory) · doi:10.1101/2025.02.17.638709 · Cited by 4
Gut microbiota mediates the anti‐inflammatory effects of supplemental infrared irradiation in mice
Wang, S., Chen, L., Ma, Z., Zhao, L., Lu, Y., Fu, Y., & Liu, H. (2024) · Photochemistry and Photobiology · doi:10.1111/php.14008 · Cited by 3
Østergaard, S. K., Cetin, Z., Rasmussen, H. H., Lærke, H. N., Holst, M., Lauridsen, C., & Nielsen, J. L. (2024) · Frontiers in Nutrition · doi:10.3389/fnut.2024.1502967 · Cited by 3
Dunk, M. M., Dove, A. E., Wang, J., Sakakibara, S., Carballo‐Casla, A., & Xu, W. (2025) · JACC Advances · doi:10.1016/j.jacadv.2025.102229 · Cited by 4
Hu, J., Zhang, L., Wang, Z., Shi, L., Zhang, Y., Mao, T., Chen, X., & Pei, W. (2025) · iScience · doi:10.1016/j.isci.2025.113568 · Cited by 3
Cutting edge developments and novel targets in IBD: Microbiome in IBD
Deleu, S., & Sabino, J. P. G. (2025) · Best Practice & Research Clinical Gastroenterology · doi:10.1016/j.bpg.2025.102060 · Cited by 4
Cai, Y., Sun, J., 陈思铭, Wang, D., Jing, Y., Jin, X., Li, Z., Li, C., & Ban, X. (2026) · Journal of Agricultural and Food Chemistry · doi:10.1021/acs.jafc.5c16297 · Cited by 3
Tao, M., LIU, Y. F., Guo, H., Gao, S., Wang, Y., Yan, X., & Zhu, Y. (2026) · Communications Biology · doi:10.1038/s42003-026-10263-3 · Cited by 4
Redmond, L. C., Wensel, C. R., Estradé, M., Fleischhacker, S. E., Poirer, L., Jock, B., & Gittelsohn, J. (2023) · Current Developments in Nutrition · doi:10.1016/j.cdnut.2023.100043 · Cited by 5
Salo, T. E., Hakola, L., Niinistö, S., Takkinen, H., Ahonen, S., Puustinen, L., Ilonen, J., Toppari, J., Veijola, R., Hyöty, H., et al. (2024) · Journal of Nutrition · doi:10.1016/j.tjnut.2024.05.015 · Cited by 3
Neamți, L., Gheorghe, S. R., Ventuneac, A. D., Drugan, T., Drugan, C., Silaghi, C. N., Ciobanu, L., & Craciun, A. M. (2024) · Biomedicines · doi:10.3390/biomedicines12081733 · Cited by 3
Li, J., Ye, J., Zhou, Q., Guo, K., & Zhou, Z. (2024) · Diabetes Research and Clinical Practice · doi:10.1016/j.diabres.2024.111942 · Cited by 3
Healthy Eating Index-2020 and bowel habits: a cross-sectional analysis of NHANES
Chen, R., Fu, Z., Feng, Z., Xiao, F., & Wang, G. (2025) · Frontiers in Nutrition · doi:10.3389/fnut.2025.1578124 · Cited by 4
Ji, Z., Yu, X., Gu, H., Wang, P., Meng, L., Lin, H., & Lv, H. (2025) · Frontiers in Cardiovascular Medicine · doi:10.3389/fcvm.2025.1677684 · Cited by 3
Metadata
- Authors
- Bolte, L. A., Vich Vila, A., Imhann, F., Collij, V., Gacesa, R., Peters, V., Wijmenga, C., Kurilshikov, A., Campmans-Kuijpers, M. J. E., Fu, J., Dijkstra, G., Zhernakova, A., & Weersma, R. K.
- Affiliations
- University Medical Center Groningen (NL)
- Department of Gastroenterology and Hepatology, University of Groningen and University Medical Centre Groningen, Groningen, The Netherlands
- Corresponding author
- Weersma, Rinse K
- ORCID
- Venue
- Gut
- Publisher
- BMJ
- Published
- 2021-04-02
- Volume
- 70
- Issue
- 7
- Pages
- 1287-1298
- ISSN
- 0017-5749 (ISSN-L)
- 1468-3288
- PMC
- PMC8223641
- OpenAlex
- W3151963551
- Cited by
- 595
- References
- 60
- Citations by year
- 2026: 87 · 2025: 151 · 2024: 121 · 2023: 117 · 2022: 92 · 2021: 26
- FWCI
- 28.57
- Type
- journal article
- Language
- en
- Open access
- hybrid
- doi.org
- Locations
- Gut (publishedVersion, cc-by)
- PubMed Central (publishedVersion, cc-by)
- PubMed (publishedVersion)
- University of Groningen research database (University of Groningen / Centre for Information Technology) (publishedVersion, cc-by)
- University of Groningen research database (University of Groningen / Centre for Information Technology) (submittedVersion, cc-by)
- Funders
- CardioVasculair Onderzoek Nederland (CVON 2012-03)
- Netherlands’ Top Institute Food and Nutrition (GH001)
- Top Sector Life Sciences & Health, Samenwerkende Gezondheidsfondsen (LSHM18057-SGF)
- European Research Council (ERC Consolidator grant 101001678, ERC-715772)
- Nederlandse Organisatie voor Wetenschappelijk Onderzoek (NWO Gravitation grant ExposomeNL 024.004.017, NWO Gravitation grant Organ-on-Chip 024.003.001, NWO SPI 92-266, NWO VIDI grant 016.178.056)
- Topics
- Life Sciences › Biochemistry, Genetics and Molecular Biology › Molecular Biology › Gut microbiota and health
- Health Sciences › Medicine › Public Health, Environmental and Occupational Health › Nutritional Studies and Diet
- Health Sciences › Medicine › Gastroenterology › Inflammatory Bowel Disease
- Keywords
- dietary habits, gut microbiota, intestinal inflammation, Crohn's disease, ulcerative colitis, irritable bowel syndrome, processed foods, animal products, plant-based foods, fish consumption, Firmicutes, Ruminococcus, Blautia, short-chain fatty acids, mucosal protection, anti-inflammatory bacteria, microbial metabolic pathways
- MeSH terms
- Gastrointestinal Microbiome, Adult, Bacteria, Beverages, Colitis, Ulcerative, Crohn Disease, Diet, Feces, Food, Humans, Inflammation, Middle Aged, Surveys and Questionnaires, Time Factors, Irritable Bowel Syndrome, Metagenomics
About these checks
Registry, retraction, Cites and statistics results are computed, not judged, with one exception: a printed reference that no index lists is read once by a model before it counts as a citation error. Claims are extracted by a model and kept only when their quote appears verbatim in the text; each cited source is then checked, with a model’s help, for whether it says what the claim relies on. Those verdicts can be wrong — read the claim’s quote and the cited source before relying on one.
Statistics and arithmetic are recomputed, not judged.
Confidence bands are shown only for fields calibrated on our annotated test set. None is calibrated yet, so no band is shown.
What counts as a claim ›How we measure confidence ›How we check this ›
Are you an author, or do you see a problem with this page? Request a review
