

The DOI matches its Crossref record; 67 of the 67 references it cites were found in a registry or an index; 34 of the 76 sources its claims cite were checked for support.
Knowledge Graph Embedding for Link Prediction
Open accessAbstract
Knowledge Graphs (KGs) have found many applications in industrial and in academic settings, which in turn, have motivated considerable research efforts towards large-scale information extraction from a variety of sources. Despite such efforts, it is well known that even the largest KGs suffer from incompleteness; Link Prediction (LP) techniques address this issue by identifying missing facts among entities already in the KG. Among the recent LP techniques, those based on KG embeddings have achieved very promising performance in some benchmarks. Despite the fast-growing literature on the subject, insufficient attention has been paid to the effect of the design choices in those methods. Moreover, the standard practice in this area is to report accuracy by aggregating over a large number of test facts in which some entities are vastly more represented than others; this allows LP methods to exhibit good results by just attending to structural properties that include such entities, while ignoring the remaining majority of the KG. This analysis provides a comprehensive comparison of embedding-based LP methods, extending the dimensions of analysis beyond what is commonly available in the literature. We experimentally compare the effectiveness and efficiency of 18 state-of-the-art methods, consider a rule-based baseline, and report detailed analysis over the most popular benchmarks in the literature.
Overview
AI snapshot
Written from the paper’s full text.
TL;DR
This paper presents a comparative analysis of 16 KG embedding link-prediction models plus a rule-based baseline across 5 standard benchmarks, evaluating effectiveness, efficiency, and structural factors. It finds that graph structure, relation properties, and tie-handling policies strongly affect results, with ComplEx-N3 and AnyBURL among the most consistently strong performers.
Key findings
- Across 16 embedding models and the AnyBURL baseline on FB15k, WN18, FB15k-237, WN18RR, and YAGO3-10, Tensor Decomposition models were generally solid; ComplEx with N3 regularization was the only embedding-based model consistently comparable to AnyBURL. RotatE was consistent and particularly strong on H@10, while ConvR and RSN were the best deep-learning models in the study.
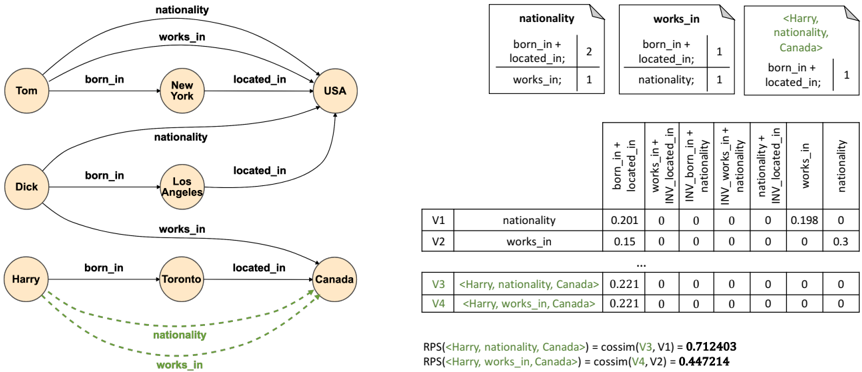
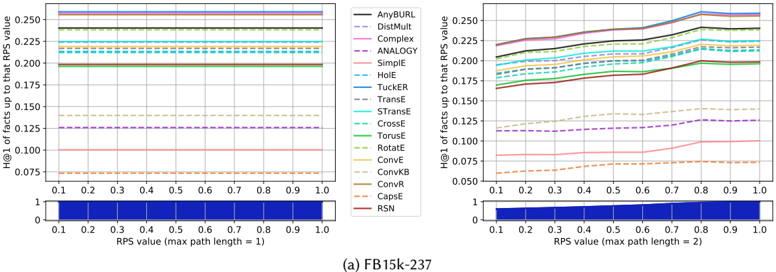
- Structural features matter: more source peers usually improved H@1, while more target peers often worsened it; higher Relational Path Support (RPS) generally improved performance. A standalone RPS-based observable-feature model achieved H@1 of 50.49 on FB15k, 93.55 on WN18, 10.45 on FB15k-237, and 36.33 on WN18RR, which the authors use as evidence of test leakage in FB15k/WN18.
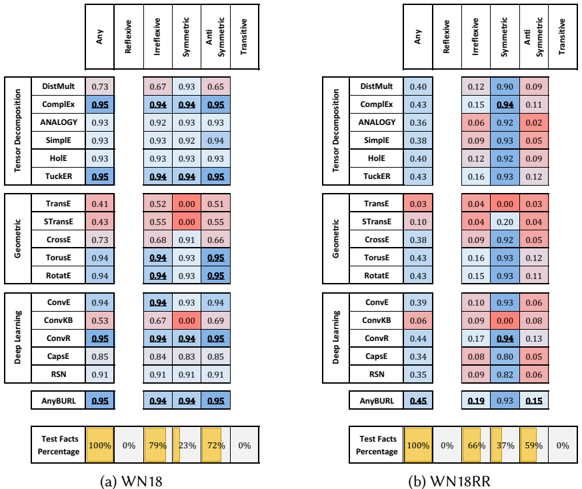
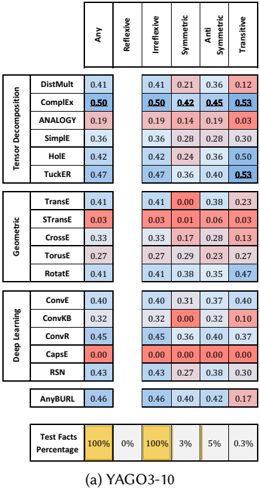
- Relation properties affect models differently: translational models such as TransE, CrossE, and STransE struggled with symmetric and transitive relations; in FB15k-237 most models performed poorly on symmetric relations, possibly because sampling removes training facts that would reveal symmetry. In WN18/WN18RR, symmetric relations were handled well by most models except TransE and ConvKB.
- Tie policy can dramatically change reported results: CapsE obtained FB15k H@1 of 73.01 under min policy versus 1.93 under average, and YAGO3-10 H@1 of 100.0 under min versus 0.00 under average; ConvKB obtained FB15k H@1 of 52.86 under min versus 11.43 under average. Saturating activations such as ReLU were identified as a main cause; replacing CapsE’s ReLUs with Leaky ReLUs reduced discrepancies, and removing CrossE’s final sigmoid eliminated them.
Methods
- Comparative experimental design: 16 state-of-the-art KG embedding models organized into Tensor Decomposition, Geometric, and Deep Learning families, plus AnyBURL as a rule-based baseline. Models were trained and evaluated from scratch on 5 datasets: FB15k, WN18, FB15k-237, WN18RR, and YAGO3-10.
- Evaluation used the filtered scenario with H@1, H@10, MR, and MRR; efficiency was measured as training time and prediction time. Hyperparameters were taken from authors where available and otherwise hand-tuned.
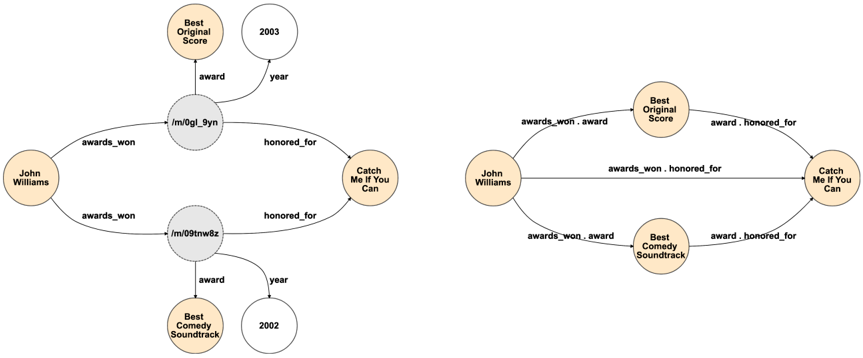
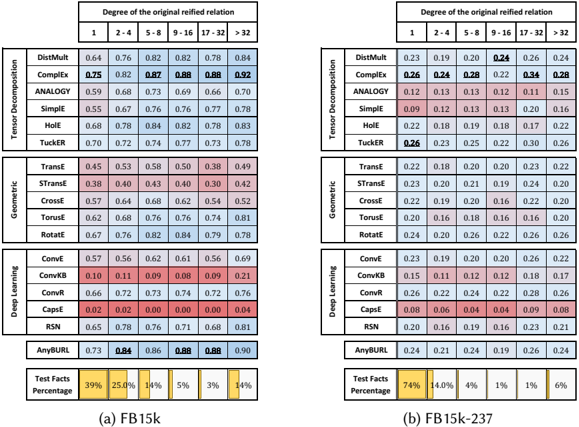
- Structural analyses defined and measured: number of source/target peers; Relational Path Support via a TF-IDF-style cosine similarity over relational paths up to length 3; relation properties (reflexivity, irreflexivity, symmetry, anti-symmetry, transitivity) with a 0.5 tolerance threshold; and degree of original reified relations for FreeBase-derived datasets.
Limitations
- Stated: hyperparameter tuning was not exhaustive and often used hand tuning rather than full grid/random search; AnyBURL was trained for 1,000s instead of 10,000s on FB15k-237 and YAGO3-10 because full-ranking prediction became prohibitively slow; the standalone RPS model used only 512 test facts and paths up to length 2, and was not run on YAGO3-10; Entity-Pair Ranking evaluation was considered but deemed too time-consuming.
- Stated: the Star-to-Clique conversion of FreeBase reified relations is irreversible and loses information through deduplication; for some S2C test facts no CVT was found and degree was set to 2; WN18RR’s test set includes 212 entities absent from training, making about 6.7% of test facts impossible to predict reasonably.
- Evident from the provided text: several tables are garbled or partially unreadable, so some numeric results cannot be reliably extracted from this version.
Model-written summary. Check it against the paper before relying on it.
Integrity signals
Registry
Cites
Statistics
Figures
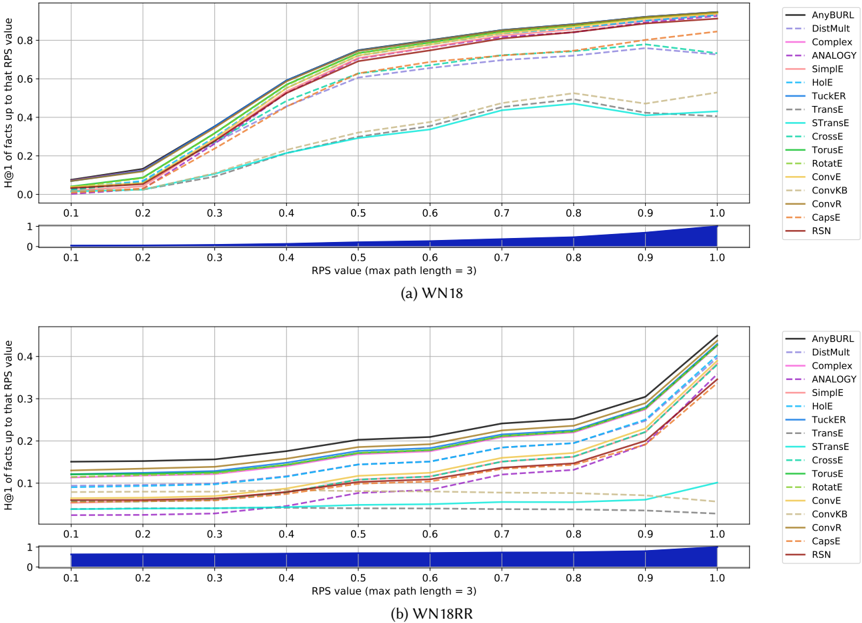
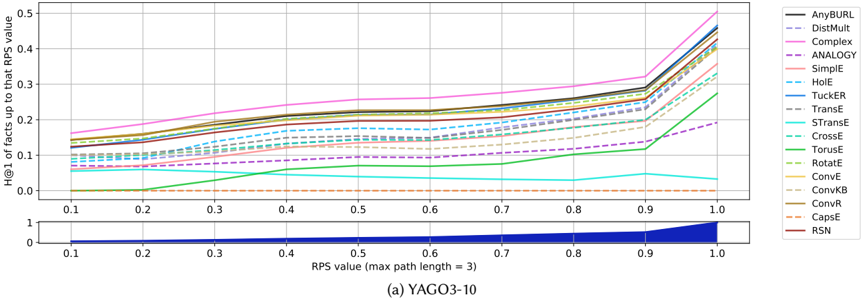
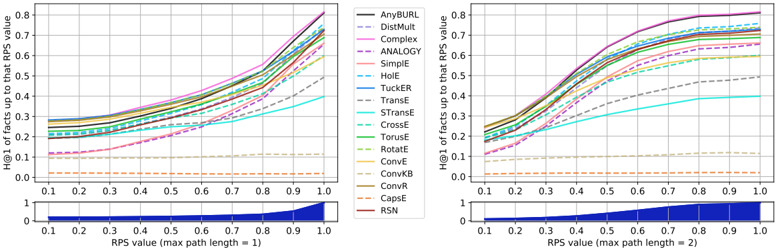
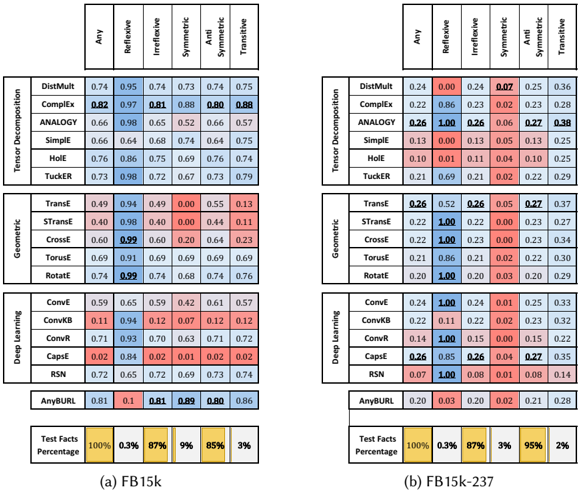
Verification
Claims the paper makes
41 Own result · 40 No basis given · 38 Own interpretation · 20 Supported · 17 Sources not found · 9 Own method · 8 Partly supported · 3 Not checked yet · 2 No full text of the sources · 1 Couldn’t confirm · accuracy not yet measured
Every source the paper cites for this claim was checked and supports it.
In the paper
“That the poor performances of the Inverse Model [11] in YAGO3-10 suggest that this benchmark should not suffer from the same test leakage issues as FB15k and WN18.”
What the sources say
- Supportedcites [11] [11] T. Dettmers, P. Minervini, P. Stenetorp, and S. Riedel. Convolutional 2d knowledge graph embeddings. In AAAI Conference on Artificial Intelligence , 2018. - source
Table 5 (p. 7) reports very poor YAGO3-10 performance for the Inverse Model (MRR 0.02), while the Results (p. 5) say it fails to pick up inverse relations there. The Knowledge Graph Datasets section (p. 4) identifies inverse-relation test leakage in FB15k and WN18 and recommends YAGO3-10 instead, supporting the citing sentence’s qualified inference. (LLM, conf=0.94)
hedged- Asserted: passes — The authors put it forward as true.
- Checkable: passes — It can be checked against evidence.
- Load-bearing: unclear — It is unclear whether the paper’s conclusions depend on it.
- Based: passes — The paper gives a reason why it holds.
- Supported
Every source the paper cites for this claim was checked and supports it.
In the paper
“In order to filter away all trivial triples, they also ensured that none of the entities connected in the training set are also directly linked in the validation and test sets.”
What the sources say
- Supportedcites [57] [57] K. Toutanova and D. Chen. Observed versus latent features for knowledge base and text inference. In Proceedings of the 3rd Workshop on Continuous Vector Space Models and their Compositionality , pages 57-66, 2015. - source
Section 4.3 states that the authors removed from the validation and test sets any triples whose entity pairs were directly linked in the training database. It says this was done to avoid additional trivial cases. (LLM, conf=0.94)
plain- Asserted: passes — The authors put it forward as true.
- Checkable: passes — It can be checked against evidence.
- Load-bearing: passes — The paper’s conclusions depend on it.
- Based: passes — The paper gives a reason why it holds.
- Supported
Every source the paper cites for this claim was checked and supports it.
In the paper
“TorusE [13] was motivated by the observation that the regularization used in TransE forces entity embeddings to lie on a hypersphere, thus limiting their capability to satisfy the translational constraint. To solve this problem, TorusE projects each point 𝒙 of the traditional open manifold R 𝑑 into a [ 𝒙 ] point on a torus T 𝑑 .”
What the sources say
- Supportedcites [13] [13] T. Ebisu and R. Ichise. Toruse: Knowledge graph embedding on a lie group. In Proceedings of the Thirty-Second AAAI Conference on Artificial Intelligence, (AAAI-18), the 30th innovative Applications of Artificial Intelligence (IAAI-18), and the 8th AAAI Symposium on Educational Advances in Artificial Intelligence (EAAI-18), New Orleans, Louisiana, USA, February 2-7, 2018 , pages 1819-1826, 2018. - source
The Abstract (p. 1) says TransE’s sphere regularization makes its translational principle difficult to fulfill. Section 4 (p. 3) says TorusE changes the embedding space to a torus to avoid regularization, and §4.3 (p. 4) explicitly defines the projection from Rⁿ to Tⁿ as x ↦ [x]. (LLM, conf=0.94)
plaindirect- Asserted: passes — The authors put it forward as true.
- Checkable: passes — It can be checked against evidence.
- Load-bearing: passes — The paper’s conclusions depend on it.
- Based: passes — The paper gives a reason why it holds.
- Supported
Every source the paper cites for this claim was checked and supports it.
In the paper
“WN18RR is a subset of WN18 built by Dettmers et al . [11], also after observing test leakage in WN18.”
What the sources say
- Supportedcites [11] [11] T. Dettmers, P. Minervini, P. Stenetorp, and S. Riedel. Convolutional 2d knowledge graph embeddings. In AAAI Conference on Artificial Intelligence , 2018. - source
The Knowledge Graph Datasets section (p. 4) reports inverse-relation test leakage in WN18 and says the authors created WN18RR after finding flaws in WN18. It identifies WN18RR as the replacement dataset; the paper credits Toutanova and Chen (2015) with first noting the leakage. (LLM, conf=0.94)
plain- Asserted: passes — The authors put it forward as true.
- Checkable: passes — It can be checked against evidence.
- Load-bearing: passes — The paper’s conclusions depend on it.
- Based: passes — The paper gives a reason why it holds.
- Supported
Every source the paper cites for this claim was checked and supports it.
In the paper
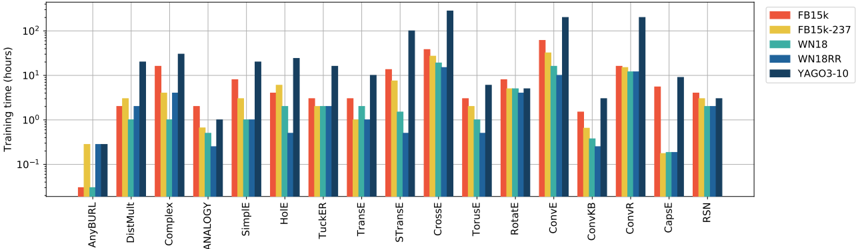
“In comparison to the embedding-based models, the baseline project AnyBURL [37] is strikingly fast.”
What the sources say
- Supportedcites [37] [37] C. Meilicke, M. W. Chekol, D. Ruffinelli, and H. Stuckenschmidt. Anytime bottom-up rule learning for knowledge graph completion. 2019. - source
Section 5.2 reports that AnyBURL reaches results comparable to several embedding models after 1,000 seconds of learning and outperforms SimplE with rules learned in 10 seconds. It also contrasts AnyBURL's runtime with substantially longer reported runtimes for ComplEx-N3. These passages support the qualitative speed comparison, although the paper notes that AnyBURL's listed runtimes cover rule learning only. (LLM, conf=0.90)
boostedcorrelational- Asserted: passes — The authors put it forward as true.
- Checkable: passes — It can be checked against evidence.
- Load-bearing: unclear — It is unclear whether the paper’s conclusions depend on it.
- Based: passes — The paper gives a reason why it holds.
- Supported
The cited sources support only part of this claim — read each source’s verdict below.
In the paper
“Hyperedges constitute the large majority of edges in FreeBase:”
What the sources say
- Not matchedcites Fatemi et al . [15]
Couldn’t be matched to a paper in Crossref, so it can’t be checked.
- Partly supportedcites Wen et al. [68] [68] J. Wen, J. Li, Y. Mao, S. Chen, and R. Zhang. On the representation and embedding of knowledge bases beyond binary relations. In IJCAI , pages 1300-1307. IJCAI/AAAI Press, 2016. - sourceExperimental — accuracy not yet measured
The Introduction (p. 1) says that a large portion of knowledge data comes from non-binary relations and that more than one-third of Freebase entities participate in them. It does not say that hyperedges make up a majority of Freebase edges; the entity statistic cannot establish an edge majority. Section 2.6 (pp. 3–4) describes Freebase’s triple representation without giving that proportion. (LLM, conf=0.84)
plain- Asserted: passes — The authors put it forward as true.
- Checkable: passes — It can be checked against evidence.
- Load-bearing: passes — The paper’s conclusions depend on it.
- Based: passes — The paper gives a reason why it holds.
- Not matched
A result the paper reports from its own data — it cites no other source for it, so there is none to check. The quote shows it is in the paper.
In the paper
“We do not consider other properties, such as Equivalence and Order (partial or complete), because we experimentally observed that in all datasets included in our analysis only a negligible number of facts would be included in the resulting buckets.”
plaindirect- Asserted: passes — The authors put it forward as true.
- Checkable: passes — It can be checked against evidence.
- Load-bearing: unclear — It is unclear whether the paper’s conclusions depend on it.
- Based: passes — The paper gives a reason why it holds.
The paper states this without a source or data behind it here, so there is nothing to check it against. The quote shows it is in the paper.
In the paper
“we have observed that the implementations of different models may rely on different policies for handling ties.”
hedgedconditional- Asserted: passes — The authors put it forward as true.
- Checkable: passes — It can be checked against evidence.
- Load-bearing: passes — The paper’s conclusions depend on it.
- Based: passes — The paper gives a reason why it holds.
The paper states this without a source or data behind it here, so there is nothing to check it against. The quote shows it is in the paper.
In the paper
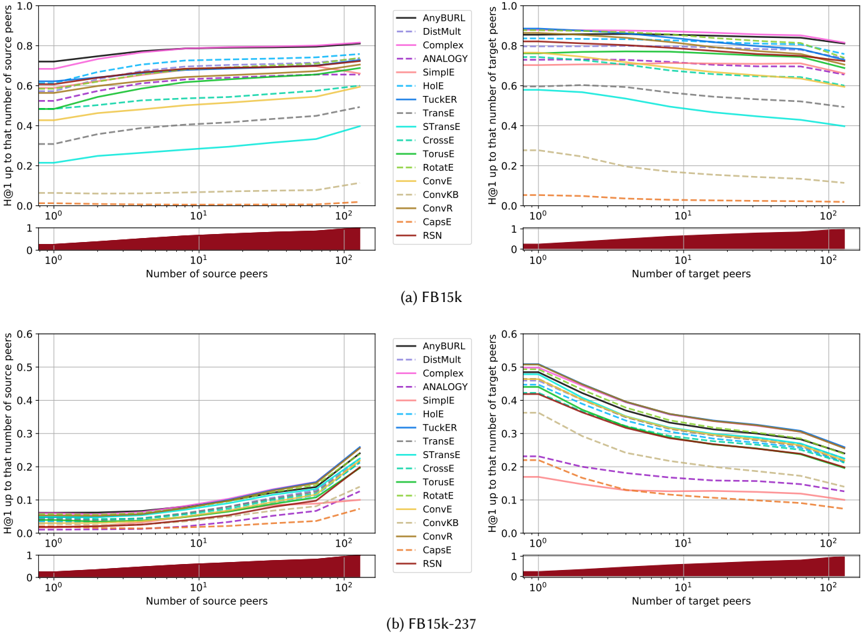
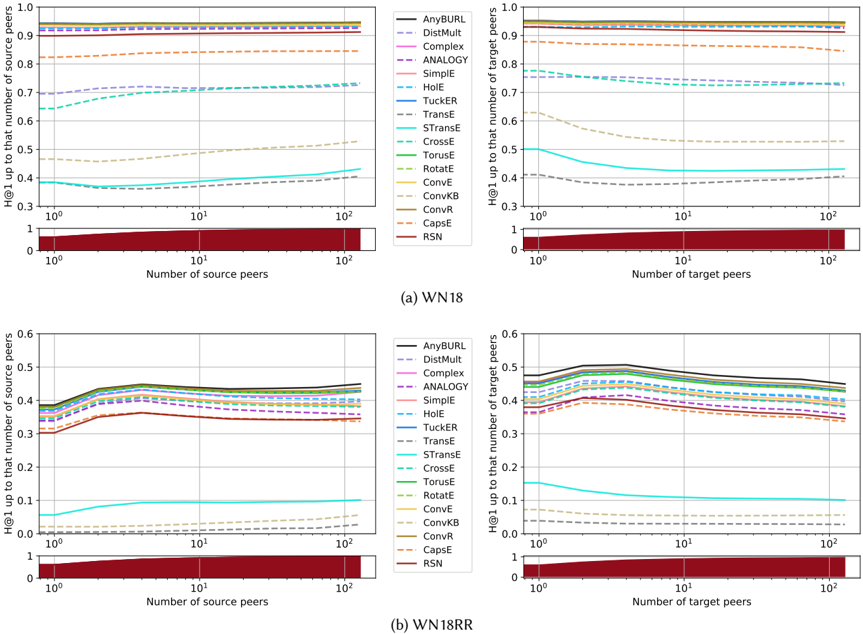
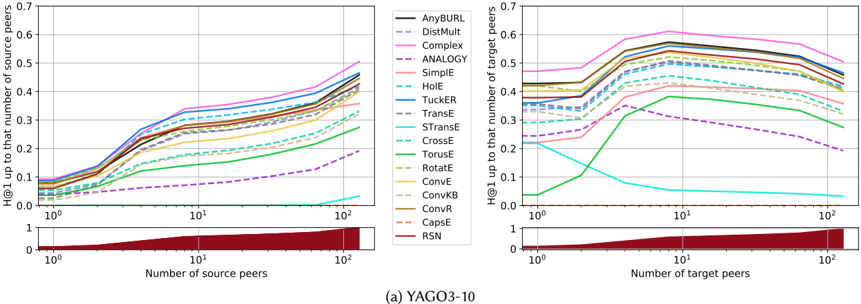
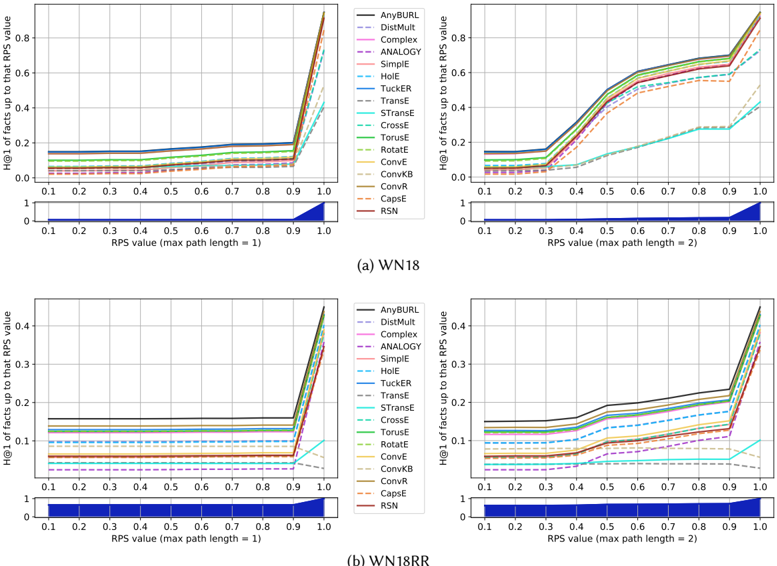
“First, we point out that almost always, predictions with a greater number of source peers show better H@1 results.”
plaincorrelational- Asserted: passes — The authors put it forward as true.
- Checkable: passes — It can be checked against evidence.
- Load-bearing: unclear — It is unclear whether the paper’s conclusions depend on it.
- Based: passes — The paper gives a reason why it holds.
The paper states this without a source or data behind it here, so there is nothing to check it against. The quote shows it is in the paper.
In the paper
“From a semantic standpoint, the original meaning of the relations is vastly altered.”
plaindirect- Asserted: passes — The authors put it forward as true.
- Checkable: passes — It can be checked against evidence.
- Load-bearing: passes — The paper’s conclusions depend on it.
- Based: passes — The paper gives a reason why it holds.
The paper states this without a source or data behind it here, so there is nothing to check it against. The quote shows it is in the paper.
In the paper
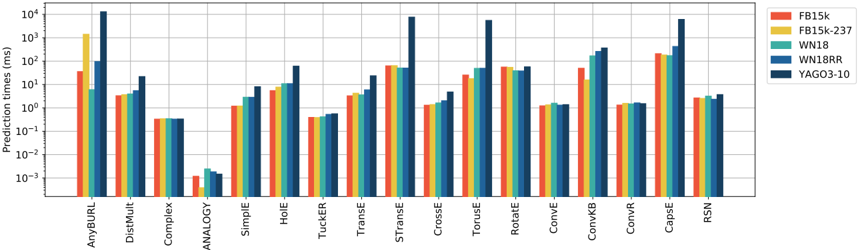
“The obtained prediction times are significantly higher than the ones for embedding-based methods”
plain- Asserted: passes — The authors put it forward as true.
- Checkable: passes — It can be checked against evidence.
- Load-bearing: unclear — It is unclear whether the paper’s conclusions depend on it.
- Based: passes — The paper gives a reason why it holds.
The paper states this without a source or data behind it here, so there is nothing to check it against. The quote shows it is in the paper.
In the paper
“Therefore, some parts of the graph become locally much denser than before.”
plaindirect- Asserted: passes — The authors put it forward as true.
- Checkable: passes — It can be checked against evidence.
- Load-bearing: passes — The paper’s conclusions depend on it.
- Based: passes — The paper gives a reason why it holds.
A result the paper reports from its own data — it cites no other source for it, so there is none to check. The quote shows it is in the paper.
In the paper
“We observe that training times range from around 1h to about 200-300 hours.”
plain- Asserted: passes — The authors put it forward as true.
- Checkable: passes — It can be checked against evidence.
- Load-bearing: unclear — It is unclear whether the paper’s conclusions depend on it.
- Based: passes — The paper gives a reason why it holds.
A result the paper reports from its own data — it cites no other source for it, so there is none to check. The quote shows it is in the paper.
In the paper
“we observed that min policy can lead to results not directly comparable to those of the other models.”
plaindirect- Asserted: passes — The authors put it forward as true.
- Checkable: passes — It can be checked against evidence.
- Load-bearing: passes — The paper’s conclusions depend on it.
- Based: passes — The paper gives a reason why it holds.
A result the paper reports from its own data — it cites no other source for it, so there is none to check. The quote shows it is in the paper.
In the paper
“Our experimental results on source and target peers, reported in Section 5.3.1, confirm our hypothesis.”
plaincorrelational- Asserted: passes — The authors put it forward as true.
- Checkable: passes — It can be checked against evidence.
- Load-bearing: unclear — It is unclear whether the paper’s conclusions depend on it.
- Based: passes — The paper gives a reason why it holds.
The paper states this without a source or data behind it here, so there is nothing to check it against. The quote shows it is in the paper.
In the paper
“From a structural standpoint, S2C transforms a CVT with degree 𝑛 into a clique with at most at most 𝑛 ! edges.”
plaindirect- Asserted: passes — The authors put it forward as true.
- Checkable: passes — It can be checked against evidence.
- Load-bearing: passes — The paper’s conclusions depend on it.
- Based: unclear — It is unclear why the paper says it holds.
The paper states this without a source or data behind it here, so there is nothing to check it against. The quote shows it is in the paper.
In the paper
“Second, we observe that very often a greater number of target peers leads to worse H@1 results.”
hedgeddirect- Asserted: passes — The authors put it forward as true.
- Checkable: passes — It can be checked against evidence.
- Load-bearing: unclear — It is unclear whether the paper’s conclusions depend on it.
- Based: passes — The paper gives a reason why it holds.
The paper states this without a source or data behind it here, so there is nothing to check it against. The quote shows it is in the paper.
In the paper
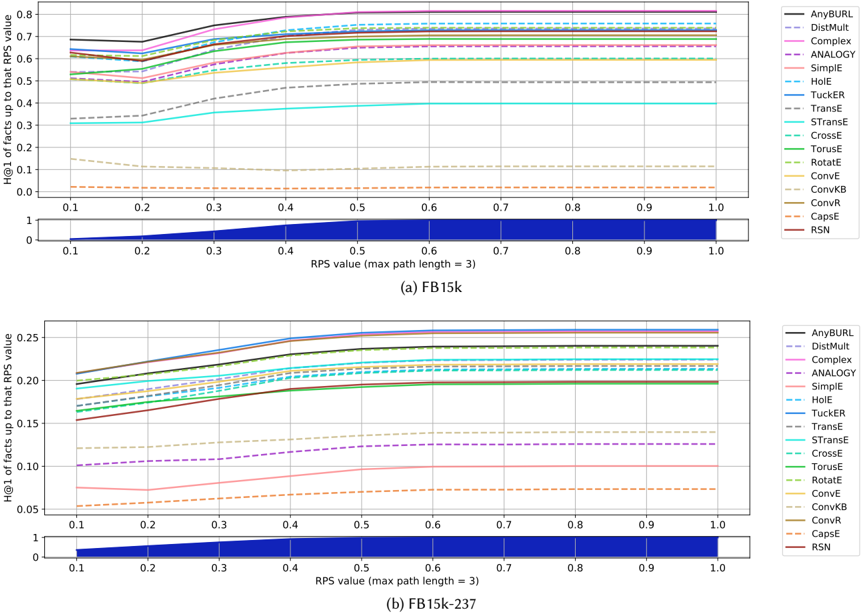
“FB15k is the dataset in which the correlation between RPS and performances, albeit clearly observable, seems weakest”
hedgedcorrelational- Asserted: passes — The authors put it forward as true.
- Checkable: passes — It can be checked against evidence.
- Load-bearing: passes — The paper’s conclusions depend on it.
- Based: passes — The paper gives a reason why it holds.
A result the paper reports from its own data — it cites no other source for it, so there is none to check. The quote shows it is in the paper.
In the paper
“We have found strong experimental evidence that saturating activation functions may be the one of the main causes of this issue.”
hedgedconditional- Asserted: passes — The authors put it forward as true.
- Checkable: passes — It can be checked against evidence.
- Load-bearing: passes — The paper’s conclusions depend on it.
- Based: passes — The paper gives a reason why it holds.
The paper states this without a source or data behind it here, so there is nothing to check it against. The quote shows it is in the paper.
In the paper
“Most of them reach almost perfect results, above 90% H@1.”
plain- Asserted: passes — The authors put it forward as true.
- Checkable: passes — It can be checked against evidence.
- Load-bearing: unclear — It is unclear whether the paper’s conclusions depend on it.
- Based: passes — The paper gives a reason why it holds.
A result the paper reports from its own data — it cites no other source for it, so there is none to check. The quote shows it is in the paper.
In the paper
“For all the other models in our analysis we have not found significant differences among their results obtained with different policies.”
plain- Asserted: passes — The authors put it forward as true.
- Checkable: passes — It can be checked against evidence.
- Load-bearing: unclear — It is unclear whether the paper’s conclusions depend on it.
- Based: passes — The paper gives a reason why it holds.
The paper states this without a source or data behind it here, so there is nothing to check it against. The quote shows it is in the paper.
In the paper
“On the contrary they all display terrible performance in symmetric relations.”
plain- Asserted: passes — The authors put it forward as true.
- Checkable: passes — It can be checked against evidence.
- Load-bearing: unclear — It is unclear whether the paper’s conclusions depend on it.
- Based: passes — The paper gives a reason why it holds.
A result the paper reports from its own data — it cites no other source for it, so there is none to check. The quote shows it is in the paper.
In the paper
“Albeit at a lesser extent, they are also visible in YAGO3-10, especially regarding the source peers.”
plaincorrelational- Asserted: passes — The authors put it forward as true.
- Checkable: passes — It can be checked against evidence.
- Load-bearing: unclear — It is unclear whether the paper’s conclusions depend on it.
- Based: passes — The paper gives a reason why it holds.
A result the paper reports from its own data — it cites no other source for it, so there is none to check. The quote shows it is in the paper.
In the paper
“We have observed that a few models, in their evaluation, are strikingly sensitive to the policy used for handling ties.”
plaincorrelational- Asserted: passes — The authors put it forward as true.
- Checkable: passes — It can be checked against evidence.
- Load-bearing: unclear — It is unclear whether the paper’s conclusions depend on it.
- Based: passes — The paper gives a reason why it holds.
A result the paper reports from its own data — it cites no other source for it, so there is none to check. The quote shows it is in the paper.
In the paper
“On these datasets, no remarkable differences are observable for CrossE, except for MR, that is inherently sensitive to small variations.”
plain- Asserted: passes — The authors put it forward as true.
- Checkable: passes — It can be checked against evidence.
- Load-bearing: unclear — It is unclear whether the paper’s conclusions depend on it.
- Based: passes — The paper gives a reason why it holds.
The paper states this without a source or data behind it here, so there is nothing to check it against. The quote shows it is in the paper.
In the paper
“In WN18RR these trends seem much less evident.”
hedged- Asserted: passes — The authors put it forward as true.
- Checkable: passes — It can be checked against evidence.
- Load-bearing: unclear — It is unclear whether the paper’s conclusions depend on it.
- Based: passes — The paper gives a reason why it holds.
A result the paper reports from its own data — it cites no other source for it, so there is none to check. The quote shows it is in the paper.
In the paper
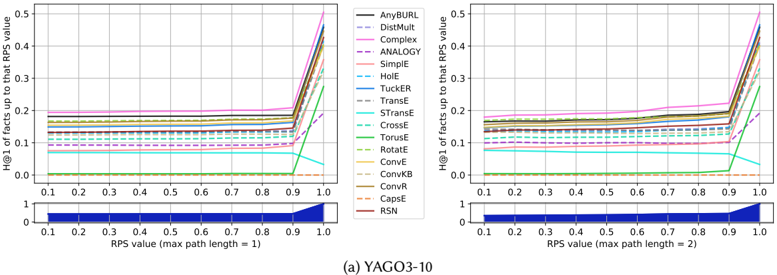
“In FB15k-237, WN18RR and YAGO3-10, on the contrary, it weakens”
plaincorrelational- Asserted: passes — The authors put it forward as true.
- Checkable: passes — It can be checked against evidence.
- Load-bearing: passes — The paper’s conclusions depend on it.
- Based: passes — The paper gives a reason why it holds.
The paper states this without a source or data behind it here, so there is nothing to check it against. The quote shows it is in the paper.
In the paper
“These correlations between numbers of peers and performance are particularly evident in datasets FB15K and FB15K237.”
plaincorrelational- Asserted: passes — The authors put it forward as true.
- Checkable: passes — It can be checked against evidence.
- Load-bearing: unclear — It is unclear whether the paper’s conclusions depend on it.
- Based: passes — The paper gives a reason why it holds.
The paper states this without a source or data behind it here, so there is nothing to check it against. The quote shows it is in the paper.
In the paper
“We point out that in FB15k-237 and WN18RR a significant percentage of facts displays a very low path support (less than 0.1).”
plain- Asserted: passes — The authors put it forward as true.
- Checkable: passes — It can be checked against evidence.
- Load-bearing: passes — The paper’s conclusions depend on it.
- Based: passes — The paper gives a reason why it holds.
A result the paper reports from its own data — it cites no other source for it, so there is none to check. The quote shows it is in the paper.
In the paper
“As a matter of fact, for CapsE 'Leaky' the differences between results obtained with min and average are much less prominent.”
plain- Asserted: passes — The authors put it forward as true.
- Checkable: passes — It can be checked against evidence.
- Load-bearing: passes — The paper’s conclusions depend on it.
- Based: passes — The paper gives a reason why it holds.
None of the sources cited for this claim could be matched to a paper in Crossref, so there is nothing to check it against.
In the paper
“In WN18 and WN18RR we observe a rather different situation. This time, symmetric relations are easily handled by most models, with the notable exceptions of TransE [8] and ConvKB [41].”
What the sources say
- Not matchedcites TransE [8]
Couldn’t be matched to a paper in Crossref, so it can’t be checked.
- Not matchedcites ConvKB [41]
Couldn’t be matched to a paper in Crossref, so it can’t be checked.
plain- Asserted: passes — The authors put it forward as true.
- Checkable: passes — It can be checked against evidence.
- Load-bearing: unclear — It is unclear whether the paper’s conclusions depend on it.
- Based: passes — The paper gives a reason why it holds.
- Not matched
The paper states this without a source or data behind it here, so there is nothing to check it against. The quote shows it is in the paper.
In the paper
“In WN18, where the distribution is very skewed as well, models show pretty balanced behaviours.”
plain- Asserted: passes — The authors put it forward as true.
- Checkable: passes — It can be checked against evidence.
- Load-bearing: unclear — It is unclear whether the paper’s conclusions depend on it.
- Based: passes — The paper gives a reason why it holds.
The paper states this without a source or data behind it here, so there is nothing to check it against. The quote shows it is in the paper.
In the paper
“We found that, considering more permissive H@K metrics (e.g. H@10), all models, including these three, improve their performance;”
plaindirect- Asserted: passes — The authors put it forward as true.
- Checkable: passes — It can be checked against evidence.
- Load-bearing: passes — The paper’s conclusions depend on it.
- Based: passes — The paper gives a reason why it holds.
A result the paper reports from its own data — it cites no other source for it, so there is none to check. The quote shows it is in the paper.
In the paper
“In FB15k and FB15k-237, differences in H@1 and MRR either disappear or decrease of 2 or even 3 orders of magnitude, becoming barely observable.”
plain- Asserted: passes — The authors put it forward as true.
- Checkable: passes — It can be checked against evidence.
- Load-bearing: passes — The paper’s conclusions depend on it.
- Based: passes — The paper gives a reason why it holds.
A result the paper reports from its own data — it cites no other source for it, so there is none to check. The quote shows it is in the paper.
In the paper
“As a matter of fact, we have found evidence suggesting that, in presence of many relations with same or inverse meaning, models tend to focus on shorter dependencies for predictions, ignoring longer relational paths.”
hedgedconditional- Asserted: passes — The authors put it forward as true.
- Checkable: passes — It can be checked against evidence.
- Load-bearing: passes — The paper’s conclusions depend on it.
- Based: passes — The paper gives a reason why it holds.
A result the paper reports from its own data — it cites no other source for it, so there is none to check. The quote shows it is in the paper.
In the paper
“In WN18 and WN18RR, much like in the original CapsE, no differences are observable.”
plain- Asserted: passes — The authors put it forward as true.
- Checkable: passes — It can be checked against evidence.
- Load-bearing: unclear — It is unclear whether the paper’s conclusions depend on it.
- Based: passes — The paper gives a reason why it holds.
The paper states this without a source or data behind it here, so there is nothing to check it against. The quote shows it is in the paper.
In the paper
“In FB15K-237, all models display globally worse performance;”
plaincorrelational- Asserted: passes — The authors put it forward as true.
- Checkable: passes — It can be checked against evidence.
- Load-bearing: unclear — It is unclear whether the paper’s conclusions depend on it.
- Based: passes — The paper gives a reason why it holds.
The paper states this without a source or data behind it here, so there is nothing to check it against. The quote shows it is in the paper.
In the paper
“nonetheless, after thoroughly investigating the model architecture, we have found that in this case too the issue is rooted in saturation.”
boosteddirect- Asserted: passes — The authors put it forward as true.
- Checkable: passes — It can be checked against evidence.
- Load-bearing: passes — The paper’s conclusions depend on it.
- Based: passes — The paper gives a reason why it holds.
None of the sources cited for this claim could be matched to a paper in Crossref, so there is nothing to check it against.
In the paper
“We also observe that translational models such as TransE [8], CrossE [72] and STransE [42] struggle to handle symmetric and transitive relations, with very poor results.”
What the sources say
- Not matchedcites TransE [8]
Couldn’t be matched to a paper in Crossref, so it can’t be checked.
- Not matchedcites CrossE [72]
Couldn’t be matched to a paper in Crossref, so it can’t be checked.
- Not matchedcites STransE [42]
Couldn’t be matched to a paper in Crossref, so it can’t be checked.
plaindirect- Asserted: passes — The authors put it forward as true.
- Checkable: passes — It can be checked against evidence.
- Load-bearing: unclear — It is unclear whether the paper’s conclusions depend on it.
- Based: passes — The paper gives a reason why it holds.
- Not matched
A result the paper reports from its own data — it cites no other source for it, so there is none to check. The quote shows it is in the paper.
In the paper
“Among those included in our analysis, Tensor Decomposition models show the most solid results across datasets.”
plaincorrelational- Asserted: passes — The authors put it forward as true.
- Checkable: passes — It can be checked against evidence.
- Load-bearing: unclear — It is unclear whether the paper’s conclusions depend on it.
- Based: passes — The paper gives a reason why it holds.
None of the sources cited for this claim could be matched to a paper in Crossref, so there is nothing to check it against.
In the paper
“nonetheless, interestingly most of them manage to keep good performance on reflexive relations, the exceptions being ANALOGY , SimplE [27], ConvE [11] and RSN [19].”
What the sources say
- Not matchedcites SimplE [27]
Couldn’t be matched to a paper in Crossref, so it can’t be checked.
- Not matchedcites ConvE [11]
Couldn’t be matched to a paper in Crossref, so it can’t be checked.
- Not matchedcites RSN [19]
Couldn’t be matched to a paper in Crossref, so it can’t be checked.
plain- Asserted: passes — The authors put it forward as true.
- Checkable: passes — It can be checked against evidence.
- Load-bearing: unclear — It is unclear whether the paper’s conclusions depend on it.
- Based: passes — The paper gives a reason why it holds.
- Not matched
A result the paper reports from its own data — it cites no other source for it, so there is none to check. The quote shows it is in the paper.
In the paper
“This correlation is visible in all datasets.”
plaincorrelational- Asserted: passes — The authors put it forward as true.
- Checkable: passes — It can be checked against evidence.
- Load-bearing: passes — The paper’s conclusions depend on it.
- Based: passes — The paper gives a reason why it holds.
The paper states this without a source or data behind it here, so there is nothing to check it against. The quote shows it is in the paper.
In the paper
“On WN18RR, the good results on symmetric relations balance, for most models, sub-par performance on irreflexive and anti-symmetric relations.”
plaincorrelational- Asserted: passes — The authors put it forward as true.
- Checkable: passes — It can be checked against evidence.
- Load-bearing: unclear — It is unclear whether the paper’s conclusions depend on it.
- Based: passes — The paper gives a reason why it holds.
None of the sources cited for this claim could be matched to a paper in Crossref, so there is nothing to check it against.
In the paper
“This problem seems alleviated by the introducton of rotational operations in TorusE [13] and RotatE [55].”
What the sources say
- Not matchedcites TorusE [13]
Couldn’t be matched to a paper in Crossref, so it can’t be checked.
- Not matchedcites RotatE [55]
Couldn’t be matched to a paper in Crossref, so it can’t be checked.
hedgedconditional- Asserted: passes — The authors put it forward as true.
- Checkable: passes — It can be checked against evidence.
- Load-bearing: unclear — It is unclear whether the paper’s conclusions depend on it.
- Based: passes — The paper gives a reason why it holds.
- Not matched
A result the paper reports from its own data — it cites no other source for it, so there is none to check. The quote shows it is in the paper.
In the paper
“We observe that, for almost all models, greater RPS values lead to better performance.”
plaindirect- Asserted: passes — The authors put it forward as true.
- Checkable: passes — It can be checked against evidence.
- Load-bearing: passes — The paper’s conclusions depend on it.
- Based: passes — The paper gives a reason why it holds.
A result the paper reports from its own data — it cites no other source for it, so there is none to check. The quote shows it is in the paper.
In the paper
“In the obtained results all discrepancies between min and average policies disappear.”
plain- Asserted: passes — The authors put it forward as true.
- Checkable: passes — It can be checked against evidence.
- Load-bearing: passes — The paper’s conclusions depend on it.
- Based: passes — The paper gives a reason why it holds.
A result the paper reports from its own data — it cites no other source for it, so there is none to check. The quote shows it is in the paper.
In the paper
“In the implementations taken into account, most of these systems display uniform performances on all evaluation metrics across the datasets of our analysis (with the potential exceptions of ANALOGY and SimplE, that are seemingly more fluctuating).”
hedged- Asserted: passes — The authors put it forward as true.
- Checkable: passes — It can be checked against evidence.
- Load-bearing: unclear — It is unclear whether the paper’s conclusions depend on it.
- Based: passes — The paper gives a reason why it holds.
A result the paper reports from its own data — it cites no other source for it, so there is none to check. The quote shows it is in the paper.
In the paper
“We report that differences in the policies used to handle score ties can lead to huge differences in predictive performance in evaluation.”
plaindirect- Asserted: passes — The authors put it forward as true.
- Checkable: passes — It can be checked against evidence.
- Load-bearing: passes — The paper’s conclusions depend on it.
- Based: passes — The paper gives a reason why it holds.
The paper states this without a source or data behind it here, so there is nothing to check it against. The quote shows it is in the paper.
In the paper
“We stress that in the LP task the rule-based AnyBURL proves to be a remarkably well-performing model, as it consistently ranks among the best models across almost all datasets and metrics.”
boosted- Asserted: passes — The authors put it forward as true.
- Checkable: passes — It can be checked against evidence.
- Load-bearing: unclear — It is unclear whether the paper’s conclusions depend on it.
- Based: passes — The paper gives a reason why it holds.
The paper states this without a source or data behind it here, so there is nothing to check it against. The quote shows it is in the paper.
In the paper
“For instance, models such as TransE and STransE seem to particularly struggle on the WN18RR dataset, especially when it comes to H@1 and MRR metrics.”
hedgedcorrelational- Asserted: passes — The authors put it forward as true.
- Checkable: passes — It can be checked against evidence.
- Load-bearing: unclear — It is unclear whether the paper’s conclusions depend on it.
- Based: unclear — It is unclear why the paper says it holds.
The paper states this without a source or data behind it here, so there is nothing to check it against. The quote shows it is in the paper.
In the paper
“In FB15k and WN18, which display strong test leakage, model performances show a prominent correlation with the support provided by shorter relational paths, with length 1 or 2.”
plaincorrelational- Asserted: passes — The authors put it forward as true.
- Checkable: passes — It can be checked against evidence.
- Load-bearing: passes — The paper’s conclusions depend on it.
- Based: passes — The paper gives a reason why it holds.
A result the paper reports from its own data — it cites no other source for it, so there is none to check. The quote shows it is in the paper.
In the paper
“We have also found strong experimental evidence that saturating activation functions, such as ReLU, play a key role in leading models to assign the same scores to multiple entities in the same prediction;”
boosteddirect- Asserted: passes — The authors put it forward as true.
- Checkable: passes — It can be checked against evidence.
- Load-bearing: passes — The paper’s conclusions depend on it.
- Based: passes — The paper gives a reason why it holds.
A result the paper reports from its own data — it cites no other source for it, so there is none to check. The quote shows it is in the paper.
In the paper
“we have shown strong experimental evidence that they produce paramount effects on prediction performances.”
boosteddirect- Asserted: passes — The authors put it forward as true.
- Checkable: passes — It can be checked against evidence.
- Load-bearing: passes — The paper’s conclusions depend on it.
- Based: passes — The paper gives a reason why it holds.
A result the paper reports from its own data — it cites no other source for it, so there is none to check. The quote shows it is in the paper.
In the paper
“verifying that they can rely on different low-level policies producing incomparable and, in some cases, misleading results.”
plaindirect- Asserted: passes — The authors put it forward as true.
- Checkable: passes — It can be checked against evidence.
- Load-bearing: passes — The paper’s conclusions depend on it.
- Based: passes — The paper gives a reason why it holds.
A result the paper reports from its own data — it cites no other source for it, so there is none to check. The quote shows it is in the paper.
In the paper
“We also observe evidence suggesting that almost all models - even across those that only learn individual facts in training - seem able to leverage to some extent relational paths and patterns.”
hedgedconditional- Asserted: passes — The authors put it forward as true.
- Checkable: passes — It can be checked against evidence.
- Load-bearing: unclear — It is unclear whether the paper’s conclusions depend on it.
- Based: passes — The paper gives a reason why it holds.
A claim is checked only against the cited paper’s full text, never its abstract, and none is available for its sources.
In the paper
“Despite such efforts, it is well known that even state-of-the-art KGs suffer from incompleteness .”
What the sources say
- Not checked — no full text of the sourcecites [12] [12] X. L. Dong, E. Gabrilovich, G. Heitz, W. Horn, N. Lao, K. Murphy, T. Strohmann, S. Sun, and W. Zhang. Knowledge vault: A web-scale approach to probabilistic knowledge fusion. In Proceedings of the 20th ACM SIGKDD International Conference on Knowledge Discovery and Data Mining , KDD '14, pages 601-610. ACM, 2014. - source
- Not checked — no full text of the sourcecites [69] [69] R. West, E. Gabrilovich, K. Murphy, S. Sun, R. Gupta, and D. Lin. Knowledge base completion via search-based question answering. In Proceedings of the 23rd international conference on World wide web , pages 515-526. ACM, 2014. - source
boosted- Asserted: passes — The authors put it forward as true.
- Checkable: passes — It can be checked against evidence.
- Load-bearing: passes — The paper’s conclusions depend on it.
- Based: passes — The paper gives a reason why it holds.
A conclusion the paper draws from its own results — it cites no other source for it, so there is none to check. The quote shows it is in the paper.
In the paper
“As a result, LP methods can exhibit good performance on these benchmarks by attending only to such entities while ignoring the others.”
plaindirect- Asserted: passes — The authors put it forward as true.
- Checkable: passes — It can be checked against evidence.
- Load-bearing: passes — The paper’s conclusions depend on it.
- Based: passes — The paper gives a reason why it holds.
- Rests on an assumption: The standard practice of reporting accuracy aggregated over test facts with over-represented entities allows LP methods to exhibit good performance by attending only to structural properties involving those entities, while ignoring the remaining majority of the KG.
In the paper
“On the other hand, this makes the scoring function commutative, with 𝜙 ( 𝒉 , 𝒓 , 𝒕 ) = 𝜙 ( 𝒕 , 𝒓 , 𝒔 ) , which amounts to treating all relations as symmetric.”
What the sources say
- Not checked yetcites [71] [71] B. Yang, W. Yih, X. He, J. Gao, and L. Deng. Embedding entities and relations for learning and inference in knowledge bases. In 3rd International Conference on Learning Representations, ICLR 2015, San Diego, CA, USA, May 7-9, 2015, Conference Track Proceedings , 2015. -
plaindirect- Asserted: passes — The authors put it forward as true.
- Checkable: passes — It can be checked against evidence.
- Load-bearing: unclear — It is unclear whether the paper’s conclusions depend on it.
- Based: passes — The paper gives a reason why it holds.
A conclusion the paper draws from its own results — it cites no other source for it, so there is none to check. The quote shows it is in the paper.
In the paper
“In other words, using different tie policies may make results not directly comparable to one another.”
hedgedconditional- Asserted: passes — The authors put it forward as true.
- Checkable: passes — It can be checked against evidence.
- Load-bearing: passes — The paper’s conclusions depend on it.
- Based: passes — The paper gives a reason why it holds.
A conclusion the paper draws from its own results — it cites no other source for it, so there is none to check. The quote shows it is in the paper.
In the paper
“Intuitively, such examples provide the models with meaningful information, allowing them to more easily understand when other entities (such as Barack Obama) have nationality USA as well.”
plaindirect- Asserted: passes — The authors put it forward as true.
- Checkable: passes — It can be checked against evidence.
- Load-bearing: passes — The paper’s conclusions depend on it.
- Based: passes — The paper gives a reason why it holds.
A conclusion the paper draws from its own results — it cites no other source for it, so there is none to check. The quote shows it is in the paper.
In the paper
“Being capable of learning certain relations, however, does not necessarily imply reaching good performance on them.”
plain- Asserted: passes — The authors put it forward as true.
- Checkable: passes — It can be checked against evidence.
- Load-bearing: passes — The paper’s conclusions depend on it.
- Based: passes — The paper gives a reason why it holds.
In the paper
“as observed by Kadlec et al . [26], low values of 𝐾 allow the emerging of more more marked differences among different models.”
What the sources say
- Not matchedcites Kadlec et al . [26]
Couldn’t be matched to a paper in Crossref, so it can’t be checked.
plaindirect- Asserted: passes — The authors put it forward as true.
- Checkable: passes — It can be checked against evidence.
- Load-bearing: passes — The paper’s conclusions depend on it.
- Based: passes — The paper gives a reason why it holds.
- Not matched
What the paper did — it cites no source for this, so there is none to check. The quote shows it is in the paper.
In the paper
“Considering the sheer size of such spaces (often containing thousands of combinations), as well as the duration of each training (usually taking several hours), running a grid search or even a random search was generally unfeasible.”
plaindirect- Asserted: passes — The authors put it forward as true.
- Checkable: passes — It can be checked against evidence.
- Load-bearing: passes — The paper’s conclusions depend on it.
- Based: passes — The paper gives a reason why it holds.
In the paper
“Analogously, DistMult [71] can not handle anti-symmetric relations, because given any fact ⟨ ℎ, 𝑟, 𝑡 ⟩ , it assigns the same score to ⟨ 𝑡, 𝑟, ℎ ⟩ too.”
What the sources say
- Not checked yetcites [71] [71] B. Yang, W. Yih, X. He, J. Gao, and L. Deng. Embedding entities and relations for learning and inference in knowledge bases. In 3rd International Conference on Learning Representations, ICLR 2015, San Diego, CA, USA, May 7-9, 2015, Conference Track Proceedings , 2015. -
plaindirect- Asserted: passes — The authors put it forward as true.
- Checkable: passes — It can be checked against evidence.
- Load-bearing: unclear — It is unclear whether the paper’s conclusions depend on it.
- Based: passes — The paper gives a reason why it holds.
A conclusion the paper draws from its own results — it cites no other source for it, so there is none to check. The quote shows it is in the paper.
In the paper
“As a matter of fact, depending on their scoring function, some models may be even incapable of learning certain types of relations correctly.”
hedgedconditional- Asserted: passes — The authors put it forward as true.
- Checkable: passes — It can be checked against evidence.
- Load-bearing: unclear — It is unclear whether the paper’s conclusions depend on it.
- Based: passes — The paper gives a reason why it holds.
The paper states this without a source or data behind it here, so there is nothing to check it against. The quote shows it is in the paper.
In the paper
“since the sigmoid function is monotonous and growing, removing it does not affect entity ranks.”
plainSingle case- Asserted: passes — The authors put it forward as true.
- Checkable: passes — It can be checked against evidence.
- Load-bearing: passes — The paper’s conclusions depend on it.
- Based: passes — The paper gives a reason why it holds.
A conclusion the paper draws from its own results — it cites no other source for it, so there is none to check. The quote shows it is in the paper.
In the paper
“These entities seem confuse models when they are asked to predict that other entities (such as Michelle Obama ) are born in Chicago as well.”
hedgeddirectSingle case- Asserted: passes — The authors put it forward as true.
- Checkable: passes — It can be checked against evidence.
- Load-bearing: passes — The paper’s conclusions depend on it.
- Based: passes — The paper gives a reason why it holds.
A conclusion the paper draws from its own results — it cites no other source for it, so there is none to check. The quote shows it is in the paper.
In the paper
“This happens when models give the same score to multiple different entities in the same prediction: in this case results obtained with different policies diverge, and they are not comparable to one another anymore.”
plaindirect- Asserted: passes — The authors put it forward as true.
- Checkable: passes — It can be checked against evidence.
- Load-bearing: passes — The paper’s conclusions depend on it.
- Based: passes — The paper gives a reason why it holds.
A conclusion the paper draws from its own results — it cites no other source for it, so there is none to check. The quote shows it is in the paper.
In the paper
“Intuitively, saturating activation functions make it more likely to set identical scores to different entities, thus causing the observed issue.”
hedgeddirect- Asserted: passes — The authors put it forward as true.
- Checkable: passes — It can be checked against evidence.
- Load-bearing: passes — The paper’s conclusions depend on it.
- Based: passes — The paper gives a reason why it holds.
A conclusion the paper draws from its own results — it cites no other source for it, so there is none to check. The quote shows it is in the paper.
In the paper
“This is probably due to the very skewed dataset structure: more than 60% predictions involve less than 1 source peer or target peer.”
hedgedconditional- Asserted: passes — The authors put it forward as true.
- Checkable: passes — It can be checked against evidence.
- Load-bearing: unclear — It is unclear whether the paper’s conclusions depend on it.
- Based: passes — The paper gives a reason why it holds.
In the paper
“As shown in the scoring function in table 1, CrossE normalizes its scores by applying a sigmoid function in a final step.”
What the sources say
- Not matchedcites table 1
Couldn’t be matched to a paper in Crossref, so it can’t be checked.
plaindirect- Asserted: passes — The authors put it forward as true.
- Checkable: passes — It can be checked against evidence.
- Load-bearing: passes — The paper’s conclusions depend on it.
- Based: passes — The paper gives a reason why it holds.
- Not matched
A conclusion the paper draws from its own results — it cites no other source for it, so there is none to check. The quote shows it is in the paper.
In the paper
“Test leakage in FB15k and WN18 is actually so prominent that, on these datasets, we were able to use RPS as the scoring function of a standalone LP model based on observable features, obtaining acceptable results.”
boosted- Asserted: passes — The authors put it forward as true.
- Checkable: passes — It can be checked against evidence.
- Load-bearing: passes — The paper’s conclusions depend on it.
- Based: passes — The paper gives a reason why it holds.
A conclusion the paper draws from its own results — it cites no other source for it, so there is none to check. The quote shows it is in the paper.
In the paper
“we see this as a consequence of the severe test leakage displayed by FB15k.”
plaindirect- Asserted: passes — The authors put it forward as true.
- Checkable: passes — It can be checked against evidence.
- Load-bearing: passes — The paper’s conclusions depend on it.
- Based: passes — The paper gives a reason why it holds.
A conclusion the paper draws from its own results — it cites no other source for it, so there is none to check. The quote shows it is in the paper.
In the paper
“This is likely due to the filtering process employed to generate these datasets: removing facts breaks paths in the graph, thus making relational patterns less frequently observable.”
hedgedconditional- Asserted: passes — The authors put it forward as true.
- Checkable: passes — It can be checked against evidence.
- Load-bearing: unclear — It is unclear whether the paper’s conclusions depend on it.
- Based: passes — The paper gives a reason why it holds.
A conclusion the paper draws from its own results — it cites no other source for it, so there is none to check. The quote shows it is in the paper.
In the paper
“meaning that 3-step relational paths are actually associated with correct predictions in these datasets.”
plaincorrelational- Asserted: passes — The authors put it forward as true.
- Checkable: passes — It can be checked against evidence.
- Load-bearing: passes — The paper’s conclusions depend on it.
- Based: passes — The paper gives a reason why it holds.
The paper states this without a source or data behind it here, so there is nothing to check it against. The quote shows it is in the paper.
In the paper
“CrossE does not employ explicitly saturating activation functions;”
plain- Asserted: passes — The authors put it forward as true.
- Checkable: passes — It can be checked against evidence.
- Load-bearing: passes — The paper’s conclusions depend on it.
- Based: passes — The paper gives a reason why it holds.
A conclusion the paper draws from its own results — it cites no other source for it, so there is none to check. The quote shows it is in the paper.
In the paper
“This proves that such models, to a certain extent, are capable of benefiting from longer-range dependencies.”
boostedconditional- Asserted: passes — The authors put it forward as true.
- Checkable: passes — It can be checked against evidence.
- Load-bearing: passes — The paper’s conclusions depend on it.
- Based: passes — The paper gives a reason why it holds.
None of the sources cited for this claim could be matched to a paper in Crossref, so there is nothing to check it against.
In the paper
“models such as m-TransH [68] and the recent HypE [15] have tried to circumvent these issues by developing systems that can explicitly learn hyperedges.”
What the sources say
- Not matchedcites m-TransH [68]
Couldn’t be matched to a paper in Crossref, so it can’t be checked.
- Not matchedcites HypE [15]
Couldn’t be matched to a paper in Crossref, so it can’t be checked.
plaindirect- Asserted: passes — The authors put it forward as true.
- Checkable: passes — It can be checked against evidence.
- Load-bearing: unclear — It is unclear whether the paper’s conclusions depend on it.
- Based: passes — The paper gives a reason why it holds.
- Not matched
The paper states this without a source or data behind it here, so there is nothing to check it against. The quote shows it is in the paper.
In the paper
“the FreeBase KG represents hyperedges as reified CVT nodes.”
plain- Asserted: passes — The authors put it forward as true.
- Checkable: passes — It can be checked against evidence.
- Load-bearing: passes — The paper’s conclusions depend on it.
- Based: passes — The paper gives a reason why it holds.
A conclusion the paper draws from its own results — it cites no other source for it, so there is none to check. The quote shows it is in the paper.
In the paper
“All in all, models relying solely on translations seem to have been outclassed by recent roto-translational ones.”
hedgedcorrelational- Asserted: passes — The authors put it forward as true.
- Checkable: passes — It can be checked against evidence.
- Load-bearing: unclear — It is unclear whether the paper’s conclusions depend on it.
- Based: passes — The paper gives a reason why it holds.
A conclusion the paper draws from its own results — it cites no other source for it, so there is none to check. The quote shows it is in the paper.
In the paper
“We have shown consistent experimental evidence that graph structural features have a large influence on what models manage to learn and predict.”
boosteddirect- Asserted: passes — The authors put it forward as true.
- Checkable: passes — It can be checked against evidence.
- Load-bearing: passes — The paper’s conclusions depend on it.
- Based: passes — The paper gives a reason why it holds.
A conclusion the paper draws from its own results — it cites no other source for it, so there is none to check. The quote shows it is in the paper.
In the paper
“This is likely caused by such short paths including relations with inverse meaning or same meaning as the relation in the facts to predict.”
hedgedconditional- Asserted: passes — The authors put it forward as true.
- Checkable: passes — It can be checked against evidence.
- Load-bearing: passes — The paper’s conclusions depend on it.
- Based: passes — The paper gives a reason why it holds.
A conclusion the paper draws from its own results — it cites no other source for it, so there is none to check. The quote shows it is in the paper.
In the paper
“All in all, the toughest scenarios for LP models seem to take place when there are relatively more target peers than source peers, in conjunction with a low support offered by relational paths. In these cases, models usually tend to show quite unsatisfactory performances.”
hedgeddirect- Asserted: passes — The authors put it forward as true.
- Checkable: passes — It can be checked against evidence.
- Load-bearing: passes — The paper’s conclusions depend on it.
- Based: passes — The paper gives a reason why it holds.
- Probably not a substantial claim. 44
- It may state two separate claims as one. 60
- The quote only partly states this claim. 5
Every source the paper cites for this claim was checked and supports it.
In the paper
“Despite this flaw, it has been demonstrated by Kadlec et al . [26] that, when carefully tuned, DistMult can still reach state-of-the-art performance.”
What the sources say
- Supportedcites [26] [26] R. Kadlec, O. Bajgar, and J. Kleindienst. Knowledge base completion: Baselines strike back. arXiv preprint arXiv:1705.10744 , 2017. - source
The Introduction says that DistMult with proper hyperparameters and a training objective outperformed 27 of 29 models on the standard Hits@10 metric across WN18 and FB15k. The Model section also reports a best mean reciprocal rank on FB15k, while noting weaker results on some WN18 metrics. This supports the qualified claim that careful tuning can yield state-of-the-art performance, not that DistMult leads on every metric. (LLM, conf=0.92)
boostedconditional- Asserted: passes — The authors put it forward as true.
- Checkable: passes — It can be checked against evidence.
- Load-bearing: fails — The paper’s conclusions may not depend on it.
- Based: passes — The paper gives a reason why it holds.
Probably not a substantial claim. The paper’s conclusions may not depend on it.
- Supported
Every source the paper cites for this claim was checked and supports it.
In the paper
“ComplEx [61], similarly to DistMult, forces each relation embedding to be a diagonal matrix, but extends such formulation in the complex space: 𝒉 ∈ C 𝑑 , 𝒕 ∈ C 𝑑 , 𝒓 ∈ C 𝑑 × 𝑑 . In the complex space, the bilinear product becomes a Hermitian product, where in lieu of the traditional 𝒕 , its conjugate-transpose 𝒕 is employed. This disables the commutativeness above mentioned for the scoring function”
What the sources say
- Supportedcites [61] [61] T. Trouillon, J. Welbl, S. Riedel, É. Gaussier, and G. Bouchard. Complex embeddings for simple link prediction. In Proceedings of the 33nd International Conference on Machine Learning, ICML 2016, New York City, NY, USA, June 19-24, 2016 , pages 2071-2080, 2016. - source
The model comparison (Section 2.1, p. 3) gives DistMult a real-valued scoring function and ComplEx a complex-valued one with a conjugated entity embedding. The Introduction (p. 2) says this makes the score order-dependent and enables antisymmetric relations; Section 3 (p. 4) explicitly describes the formulation as DistMult with real embeddings extended to handle asymmetry through conjugation. (LLM, conf=0.94)
plaindirect- Asserted: passes — The authors put it forward as true.
- Checkable: passes — It can be checked against evidence.
- Load-bearing: unclear — It is unclear whether the paper’s conclusions depend on it.
- Based: passes — The paper gives a reason why it holds.
It may state two separate claims as one.
- Supported
Every source the paper cites for this claim was checked and supports it.
In the paper
“STransE [42], in addition to the 𝑑 -sized embeddings seen in TransE, associates to each relation 𝑟 two additional 𝑑 × 𝑑 independent matrices 𝑾 𝒉 𝒓 and 𝑾 𝒕 𝒓 . When computing the score of a fact ⟨ ℎ, 𝑟, 𝑡 ⟩ , before operating the usual translation, 𝒉 is pre-multiplied by 𝑾 𝒉 𝒓 and 𝒕 by 𝑾 𝒕 𝒓 ; this amounts to use relation-specific embeddings for the head and tail, alleviating the issues suffered by”
What the sources say
- Supportedcites [42] [42] D. Q. Nguyen, K. Sirts, L. Qu, and M. Johnson. Stranse: a novel embedding model of entities and relationships in knowledge bases. arXiv preprint arXiv:1606.08140 , 2016. - source
Section 2 (“Our approach”; page unavailable) defines the STransE score using separate relation-specific matrices applied to the head and tail before the translation. The results discussion (page unavailable) says its full matrices help it model 1-to-many, many-to-one, and especially many-to-many relations better than comparable models. (LLM, conf=0.92)
plaindirect- Asserted: passes — The authors put it forward as true.
- Checkable: passes — It can be checked against evidence.
- Load-bearing: unclear — It is unclear whether the paper’s conclusions depend on it.
- Based: passes — The paper gives a reason why it holds.
It may state two separate claims as one.
- Supported
Every source the paper cites for this claim was checked and supports it.
In the paper
“They demonstrate the severity of said leakage by showing that a simple rule-based model based on inverse relation detection, dubbed Inverse Model, achieves state-of-the-art results in both WN18 and FB15k.”
What the sources say
- Supportedcites [11] [11] T. Dettmers, P. Minervini, P. Stenetorp, and S. Riedel. Convolutional 2d knowledge graph embeddings. In AAAI Conference on Artificial Intelligence , 2018. - source
The Inverse Model section (p. 5) says the authors construct a simple rule-based model that detects inverse relationships and call it the inverse model. The Results section (p. 5) says it achieves state-of-the-art results on many metrics for both FB15k and WN18, demonstrating the severity of inverse-relation leakage. (LLM, conf=0.95)
boosted- Asserted: passes — The authors put it forward as true.
- Checkable: passes — It can be checked against evidence.
- Load-bearing: passes — The paper’s conclusions depend on it.
- Based: passes — The paper gives a reason why it holds.
Probably not a substantial claim.
- Supported
Every source the paper cites for this claim was checked and supports it.
In the paper
“FB15k-237 was built to be a more challenging dataset: the authors first selected facts from FB15k involving the 401 largest relations and removed all equivalent or inverse relations.”
What the sources say
- Supportedcites [57] [57] K. Toutanova and D. Chen. Observed versus latent features for knowledge base and text inference. In Proceedings of the 3rd Workshop on Continuous Vector Space Models and their Compositionality , pages 57-66, 2015. - source
Section 4.2 describes a harder dataset derived from FB15K, which the paper calls FB15KSelected. Section 4.3 says it began with the 401 most frequent FB15K relations and retained only one from each detected set of inverse or near-duplicate relations, leaving 237. (LLM, conf=0.88)
plaindirect- Asserted: passes — The authors put it forward as true.
- Checkable: passes — It can be checked against evidence.
- Load-bearing: unclear — It is unclear whether the paper’s conclusions depend on it.
- Based: passes — The paper gives a reason why it holds.
It may state two separate claims as one.
- Supported
Every source the paper cites for this claim was checked and supports it.
In the paper
“RotatE [55] represents relations as rotations in a complex latent space, with 𝒉 , 𝒓 and 𝒕 all belonging to C 𝑑 . The 𝒓 embedding is a rotation vector: in all its elements, the complex component conveys the rotation along that axis, whereas the real component is always equal to 1. The rotation 𝒓 is applied to 𝒉 by operating an element-wise product (once again noted with ⊙ in 1). L1 norm is used for”
What the sources say
- Supportedcites [55] [55] Z. Sun, Z. Deng, J. Nie, and J. Tang. Rotate: Knowledge graph embedding by relational rotation in complex space. In 7th International Conference on Learning Representations, ICLR 2019, New Orleans, LA, USA, May 6-9, 2019 , 2019. - source
Section 3.2 (p. 4) defines relations as element-wise rotations in complex vector space. Its three lemmas state that RotatE can infer symmetry/antisymmetry, inversion, and composition patterns. (LLM, conf=0.94)
plaindirect- Asserted: passes — The authors put it forward as true.
- Checkable: passes — It can be checked against evidence.
- Load-bearing: unclear — It is unclear whether the paper’s conclusions depend on it.
- Based: passes — The paper gives a reason why it holds.
It may state two separate claims as one.
- Supported
Every source the paper cites for this claim was checked and supports it.
In the paper
“In order to assess the severity of this problem, Toutanova and Chen have shown that a simple model based on observable features can easily reach state-of-the-art performance on FB15k.”
What the sources say
- Supportedcites [57] [57] K. Toutanova and D. Chen. Observed versus latent features for knowledge base and text inference. In Proceedings of the 3rd Workshop on Continuous Vector Space Models and their Compositionality , pages 57-66, 2015. - source
The Introduction (§1) says the authors compared a very simple observed-features model with state-of-the-art latent-feature models on FB15K and found that it substantially outperformed them. Section 4.2 likewise reports much higher MRR for the observed-feature models and links their success to direct links in the training graph. (LLM, conf=0.92)
boosteddirect- Asserted: passes — The authors put it forward as true.
- Checkable: passes — It can be checked against evidence.
- Load-bearing: passes — The paper’s conclusions depend on it.
- Based: passes — The paper gives a reason why it holds.
Probably not a substantial claim.
- Supported
Every source the paper cites for this claim was checked and supports it.
In the paper
“It has been demonstrated that SimplE is fully expressive, and therefore, unlike DistMult, it can model also asymmetric relations.”
What the sources say
- Supportedcites [27] [27] S. M. Kazemi and D. Poole. Simple embedding for link prediction in knowledge graphs. In Advances in Neural Information Processing Systems 31: Annual Conference on Neural Information Processing Systems 2018, NeurIPS 2018, 3-8 December 2018, Montréal, Canada. , pages 4289-4300, 2018. - source
Proposition 1 in §5.1 (p. 4) establishes that SimplE can represent any ground truth over entities and relations, supporting full expressivity and thus the ability to model asymmetric relations. The same section says DistMult forces relations to be symmetric; §3 (p. 3) likewise says it can only model symmetric relations. (LLM, conf=0.94)
boosteddirect- Asserted: passes — The authors put it forward as true.
- Checkable: passes — It can be checked against evidence.
- Load-bearing: unclear — It is unclear whether the paper’s conclusions depend on it.
- Based: passes — The paper gives a reason why it holds.
It may state two separate claims as one.
- Supported
Every source the paper cites for this claim was checked and supports it.
In the paper
“ConvE [11] represents entities and relations as one-dimensional 𝑑 -sized embeddings. When computing the score of a fact, it concatenates and reshapes the head and relation embeddings 𝒉 and 𝒓 into a unique input [ 𝒉 ; 𝒓 ] ; we dub the resulting dimensions 𝑑 𝑚 × 𝑑 𝑛 . This input is let through a convolutional layer with a set 𝝎 of 𝑚 × 𝑛 fi lters, and then through a dense layer with 𝑑 neurons and a”
What the sources say
- Supportedcites [11] [11] T. Dettmers, P. Minervini, P. Stenetorp, and S. Riedel. Convolutional 2d knowledge graph embeddings. In AAAI Conference on Artificial Intelligence , 2018. - source
The model description (p. 3) says ConvE looks up entity and relation embedding vectors, concatenates and reshapes them, applies a 2D convolution, then projects the result into the embedding dimension with a linear layer before scoring it against an object embedding. This supports the attributed architecture. (LLM, conf=0.93)
plain- Asserted: passes — The authors put it forward as true.
- Checkable: passes — It can be checked against evidence.
- Load-bearing: fails — The paper’s conclusions may not depend on it.
- Based: passes — The paper gives a reason why it holds.
Probably not a substantial claim. The paper’s conclusions may not depend on it. It may state two separate claims as one.
- Supported
The cited sources support only part of this claim — read each source’s verdict below.
In the paper
“To resolve that, they build the far more challenging WN18RR dataset by applying a pipeline similar to the one employed for FB15k-237 [57].”
What the sources say
- Supportedcites [11] [11] T. Dettmers, P. Minervini, P. Stenetorp, and S. Riedel. Convolutional 2d knowledge graph embeddings. In AAAI Conference on Artificial Intelligence , 2018. - source
The Knowledge Graph Datasets section (p. 4) says the authors created WN18RR to address flaws in WN18 and make it resistant to completion by a single rule. The Results section (p. 5) explicitly says WN18RR was derived using the same procedure used to derive FB15k-237. (LLM, conf=0.93)
- Partly supportedcites [57] [57] K. Toutanova and D. Chen. Observed versus latent features for knowledge base and text inference. In Proceedings of the 3rd Workshop on Continuous Vector Space Models and their Compositionality , pages 57-66, 2015. - sourceExperimental — accuracy not yet measured
Section 4.3 describes a pipeline that removes duplicate and inverse relations to create the more challenging FB15KSelected dataset, with 237 relations. Section 4.2 discusses WN18, but the paper does not say that WN18RR was built using a similar pipeline or assess how challenging WN18RR is relative to WN18. (LLM, conf=0.88)
plaindirect- Asserted: passes — The authors put it forward as true.
- Checkable: passes — It can be checked against evidence.
- Load-bearing: fails — The paper’s conclusions may not depend on it.
- Based: passes — The paper gives a reason why it holds.
Probably not a substantial claim. The paper’s conclusions may not depend on it.
- Supported
Every source the paper cites for this claim was checked and supports it.
In the paper
“HolE [45], instead of using bilinear products, computes circular correlation (denoted by ★ in Table 1) between the embeddings of head and tail entities; then, it performs matrix multiplication with the relation embedding.”
What the sources say
- Supportedcites [45] [45] M. Nickel, L. Rosasco, and T. A. Poggio. Holographic embeddings of knowledge graphs. In Proceedings of the Thirtieth AAAI Conference on Artificial Intelligence, February 12-17, 2016, Phoenix, Arizona, USA. , pages 1955-1961, 2016. - source
The Holographic Embeddings section (p. 3) says HolE uses circular correlation to represent pairs of entities. The Embedding Models section (p. 4) gives the resulting score as σ(rₚᵀ(eₛ ⋆ eₒ)): the correlation is followed by multiplication by the transposed relation embedding, yielding a scalar. (LLM, conf=0.90)
plaindirect- Asserted: passes — The authors put it forward as true.
- Checkable: passes — It can be checked against evidence.
- Load-bearing: fails — The paper’s conclusions may not depend on it.
- Based: passes — The paper gives a reason why it holds.
Probably not a substantial claim. The paper’s conclusions may not depend on it. It may state two separate claims as one.
- Supported
Every source the paper cites for this claim was checked and supports it.
In the paper
“FB15k-237 is a subset of FB15k built by Toutanova and Chen [57], inspired by the observation that FB15k suffers from test leakage , consisting in test data being seen by models at training time. In FB15k this issue is due to the presence of relations that are near-identical or the inverse of one another.”
What the sources say
- Supportedcites [57] [57] K. Toutanova and D. Chen. Observed versus latent features for knowledge base and text inference. In Proceedings of the 3rd Workshop on Continuous Vector Space Models and their Compositionality , pages 57-66, 2015. - source
Section 4.2 reports that almost 81% of FB15K test triples have entity pairs directly linked in the training graph, making many cases trivial for a model using those links. Section 4.3 says the authors constructed FB15KSelected by removing near-duplicate and inverse relations and filtering test triples whose entity pairs were directly linked in training. This supports the claimed leakage mechanism. (LLM, conf=0.90)
plaindirect- Asserted: passes — The authors put it forward as true.
- Checkable: passes — It can be checked against evidence.
- Load-bearing: passes — The paper’s conclusions depend on it.
- Based: passes — The paper gives a reason why it holds.
It may state two separate claims as one.
- Supported
The cited sources support only part of this claim — read each source’s verdict below.
In the paper
“TuckER [6] relies on the Tucker decomposition [21], which factorizes a tensor into a set of vectors and a smaller shared core 𝑾 . The TuckER model learns 𝑾 jointly with the KG embeddings.”
What the sources say
- Supportedcites [6] [6] I. Balazevic, C. Allen, and T. M. Hospedales. Tucker: Tensor factorization for knowledge graph completion. CoRR , abs/1901.09590, 2019. - source
Section 4 defines TuckER using Tucker decomposition, with entity and relation embeddings and a core tensor W. It describes W as shared across entities and relations and explains that TuckER is trained numerically; together, these passages support that the core is learned jointly with the embeddings. (LLM, conf=0.92)
- Not matchedcites [21] [21] F. L. Hitchcock. The expression of a tensor or a polyadic as a sum of products. Journal of Mathematics and Physics , 6(1-4):164-189, 1927. -
Couldn’t be matched to a paper in Crossref, so it can’t be checked.
plain- Asserted: passes — The authors put it forward as true.
- Checkable: passes — It can be checked against evidence.
- Load-bearing: fails — The paper’s conclusions may not depend on it.
- Based: passes — The paper gives a reason why it holds.
Probably not a substantial claim. The paper’s conclusions may not depend on it. It may state two separate claims as one.
- Supported
Every source the paper cites for this claim was checked and supports it.
In the paper
“Examples of models that have been demonstrated to be fully expressive are SimplE [27], TuckER [6], ComplEx [61] and HolE [60].”
What the sources say
- Supportedcites [27] [27] S. M. Kazemi and D. Poole. Simple embedding for link prediction in knowledge graphs. In Advances in Neural Information Processing Systems 31: Annual Conference on Neural Information Processing Systems 2018, NeurIPS 2018, 3-8 December 2018, Montréal, Canada. , pages 4289-4300, 2018. - source
The citation to this paper is attached to SimplE, not to the other models in the list. Section 5.1 (p. 4) explicitly states that Proposition 1 establishes SimplE’s full expressivity and gives the proposition. (LLM, conf=0.94)
- Supportedcites [6] [6] I. Balazevic, C. Allen, and T. M. Hospedales. Tucker: Tensor factorization for knowledge graph completion. CoRR , abs/1901.09590, 2019. - source
The citation to this paper is attached to TuckER, not to the other models in the list. Section 5.1, Theorem 1, establishes that a TuckER model can represent any ground truth over a set of entities and relations, which is the paper’s definition of full expressiveness. Page numbers were not provided in our copy. (LLM, conf=0.94)
- Supportedcites [61] [61] T. Trouillon, J. Welbl, S. Riedel, É. Gaussier, and G. Bouchard. Complex embeddings for simple link prediction. In Proceedings of the 33nd International Conference on Machine Learning, ICML 2016, New York City, NY, USA, June 19-24, 2016 , pages 2071-2080, 2016. - source
The citation to this paper is attached to ComplEx, not to the other three models. Section 2.2 (p. 4) says its factorization encompasses all possible binary relations, supporting the claim that ComplEx is fully expressive. (LLM, conf=0.88)
boosted- Asserted: passes — The authors put it forward as true.
- Checkable: passes — It can be checked against evidence.
- Load-bearing: fails — The paper’s conclusions may not depend on it.
- Based: passes — The paper gives a reason why it holds.
Probably not a substantial claim. The paper’s conclusions may not depend on it.
- Supported
The cited sources that could be checked couldn’t confirm or dispute this claim.
In the paper
“we note that ConvKB [41] and CapsE [43] are the only models that require multiple batches for running one prediction, and this may have negatively affected their prediction performance.”
What the sources say
- Could not verifycites [41] [41] D. Q. Nguyen, T. D. Nguyen, D. Q. Nguyen, and D. Q. Phung. A novel embedding model for knowledge base completion based on convolutional neural network. In Proceedings of the 2018 Conference of the North American Chapter of the Association for Computational Linguistics: Human Language Technologies, NAACL-HLT, New Orleans, Louisiana, USA, June 1-6, 2018, Volume 2 (Short Papers) , pages 327-333, 2018. - sourceExperimental — accuracy not yet measured
The survey’s Table 4 (Additional information; page unavailable) lists entity-prediction results for ConvKB and CapsE, but does not describe their batching requirements. A search of our copy for multiple batches and their possible effect on prediction performance found no passage addressing either point. (LLM, conf=0.75)
- Not matchedcites [43] [43] D. Q. Nguyen, T. Vu, T. D. Nguyen, D. Q. Nguyen, and D. Q. Phung. A capsule network-based embedding model for knowledge graph completion and search personalization. In NAACL-HLT (1) , pages 2180-2189. Association for Computational Linguistics, 2019. -
Couldn’t be matched to a paper in Crossref, so it can’t be checked.
hedgedconditional- Asserted: passes — The authors put it forward as true.
- Checkable: passes — It can be checked against evidence.
- Load-bearing: unclear — It is unclear whether the paper’s conclusions depend on it.
- Based: passes — The paper gives a reason why it holds.
It may state two separate claims as one.
- Could not verify
Every source the paper cites for this claim was checked and supports it.
In the paper
“As a baseline we use AnyBURL [37], a popular LP model based on observable features.”
What the sources say
- Supportedcites [37] [37] C. Meilicke, M. W. Chekol, D. Ruffinelli, and H. Stuckenschmidt. Anytime bottom-up rule learning for knowledge graph completion. 2019. - source
The Experiments section identifies the cited paper’s approach as AnyBURL (Anytime Bottom-Up Rule Learning). The citation therefore correctly identifies the model that the citing authors say they use as a baseline; the baseline choice is the citing authors’ own. (LLM, conf=0.94)
plain- Asserted: passes — The authors put it forward as true.
- Checkable: passes — It can be checked against evidence.
- Load-bearing: fails — The paper’s conclusions may not depend on it.
- Based: passes — The paper gives a reason why it holds.
Probably not a substantial claim. The paper’s conclusions may not depend on it.
- Supported
Every source the paper cites for this claim was checked and supports it.
In the paper
“It has been pointed out that this conversion, dubbed 'Star-to-Clique' (S2C), is irreversible [68].”
What the sources say
- Supportedcites [68] [68] J. Wen, J. Li, Y. Mao, S. Chen, and R. Zhang. On the representation and embedding of knowledge bases beyond binary relations. In IJCAI , pages 1300-1307. IJCAI/AAAI Press, 2016. - source
The Introduction (p. 1) explicitly says the star-to-clique (S2C) conversion is irreversible. Lemma 2 in §3.2 (p. 5) specifies the qualification: after S2C conversion, the original graph is generally not recoverable. (LLM, conf=0.95)
plain- Asserted: passes — The authors put it forward as true.
- Checkable: passes — It can be checked against evidence.
- Load-bearing: passes — The paper’s conclusions depend on it.
- Based: passes — The paper gives a reason why it holds.
Probably not a substantial claim.
- Supported
The cited sources support only part of this claim — read each source’s verdict below.
In the paper
“We also note that STransE [42], ConvKB [41] and CapsE [43] use transfer learning and require embeddings pre-trained on TransE [8].”
What the sources say
- Partly supportedcites [42] [42] D. Q. Nguyen, K. Sirts, L. Qu, and M. Johnson. Stranse: a novel embedding model of entities and relationships in knowledge bases. arXiv preprint arXiv:1606.08140 , 2016. - sourceExperimental — accuracy not yet measured
Section 4.1 states that the authors initialized STransE’s entity and relation vectors with vectors produced by TransE, supporting the pre-training part for their experiments. The model description presents STransE’s structure without making TransE-pretrained embeddings a requirement, and this paper does not establish the claim about ConvKB or CapsE. (LLM, conf=0.85)
- Partly supportedcites [41] [41] D. Q. Nguyen, T. D. Nguyen, D. Q. Nguyen, and D. Q. Phung. A novel embedding model for knowledge base completion based on convolutional neural network. In Proceedings of the 2018 Conference of the North American Chapter of the Association for Computational Linguistics: Human Language Technologies, NAACL-HLT, New Orleans, Louisiana, USA, June 1-6, 2018, Volume 2 (Short Papers) , pages 327-333, 2018. - sourceExperimental — accuracy not yet measured
Section 4.2 (page unavailable) says CapsE uses pre-trained word embeddings to initialize entity vectors on WN18RR. It does not say those embeddings were pre-trained on TransE or that they are required. Section 3.1 describes STransE and ConvKB but does not establish transfer learning or a TransE pre-training requirement for either model. (LLM, conf=0.83)
- Not matchedcites [43] [43] D. Q. Nguyen, T. Vu, T. D. Nguyen, D. Q. Nguyen, and D. Q. Phung. A capsule network-based embedding model for knowledge graph completion and search personalization. In NAACL-HLT (1) , pages 2180-2189. Association for Computational Linguistics, 2019. -
Couldn’t be matched to a paper in Crossref, so it can’t be checked.
plain- Asserted: passes — The authors put it forward as true.
- Checkable: passes — It can be checked against evidence.
- Load-bearing: fails — The paper’s conclusions may not depend on it.
- Based: passes — The paper gives a reason why it holds.
Probably not a substantial claim. The paper’s conclusions may not depend on it. It may state two separate claims as one.
- Partly supported
The cited sources support only part of this claim — read each source’s verdict below.
In the paper
“As already mentioned, STransE [42], ConvKB [41] and CapsE [43] require embeddings pre-trained on TransE [8]; we do not include pre-training times in our measurements.”
What the sources say
- Supportedcites [42] [42] D. Q. Nguyen, K. Sirts, L. Qu, and M. Johnson. Stranse: a novel embedding model of entities and relationships in knowledge bases. arXiv preprint arXiv:1606.08140 , 2016. - source
Section 4.1 states that the authors used entity and relation vectors produced by TransE to initialize STransE. The citation to this paper supports that STransE uses TransE-pre-trained embeddings; the statement about excluding pre-training times describes the citing authors’ own measurements. (LLM, conf=0.91)
- Could not verifycites [41] [41] D. Q. Nguyen, T. D. Nguyen, D. Q. Nguyen, and D. Q. Phung. A novel embedding model for knowledge base completion based on convolutional neural network. In Proceedings of the 2018 Conference of the North American Chapter of the Association for Computational Linguistics: Human Language Technologies, NAACL-HLT, New Orleans, Louisiana, USA, June 1-6, 2018, Volume 2 (Short Papers) , pages 327-333, 2018. - sourceExperimental — accuracy not yet measured
The survey’s Tables 3 and 4 (Additional information; page unavailable) report entity-prediction results, not training-time measurements. A search for pre-training times and their exclusion found no passage addressing either. In the citing sentence, “we do not include pre-training times in our measurements” describes the citing authors’ own measurements, rather than a finding attributed to this survey. (LLM, conf=0.75)
- Not matchedcites [43] [43] D. Q. Nguyen, T. Vu, T. D. Nguyen, D. Q. Nguyen, and D. Q. Phung. A capsule network-based embedding model for knowledge graph completion and search personalization. In NAACL-HLT (1) , pages 2180-2189. Association for Computational Linguistics, 2019. -
Couldn’t be matched to a paper in Crossref, so it can’t be checked.
plain- Asserted: passes — The authors put it forward as true.
- Checkable: passes — It can be checked against evidence.
- Load-bearing: fails — The paper’s conclusions may not depend on it.
- Based: passes — The paper gives a reason why it holds.
Probably not a substantial claim. The paper’s conclusions may not depend on it.
- Supported
Every source the paper cites for this claim was checked and supports it.
In the paper
“It is also computationally fast: depending on the training setting, in order to learn its rules it can take from a couple of minutes ( 100s setting) to about 3 hours ( 10000s setting).”
What the sources say
- Supportedcites [37] [37] C. Meilicke, M. W. Chekol, D. Ruffinelli, and H. Stuckenschmidt. Anytime bottom-up rule learning for knowledge graph completion. 2019. - source
Section 5.1 (Anytime Behavior and Runtime) reports rule sets learned after 100 and 10,000 seconds. The Table 2 caption specifies that AnyBURL’s runtimes refer to rule learning only. Those settings correspond to about two minutes and three hours, respectively. (LLM, conf=0.94)
plaincorrelational- Asserted: passes — The authors put it forward as true.
- Checkable: passes — It can be checked against evidence.
- Load-bearing: fails — The paper’s conclusions may not depend on it.
- Based: passes — The paper gives a reason why it holds.
Probably not a substantial claim. The paper’s conclusions may not depend on it.
- Supported
The cited sources support only part of this claim — read each source’s verdict below.
In the paper
“We note that in AnyBURL [37], for datasets FB15k-237 and YAGO3-10 we used training time 1,000 secs whereas the original papers report slightly better results with a training time of 10000s; this is because, due to our already described necessity for full rankings, when using models trained for 10,000 secs prediction times got prohibitively long.”
What the sources say
- Partly supportedcites [37] [37] C. Meilicke, M. W. Chekol, D. Ruffinelli, and H. Stuckenschmidt. Anytime bottom-up rule learning for knowledge graph completion. 2019. - sourceExperimental — accuracy not yet measured
Section 5.1 reports AnyBURL results after both 1,000 and 10,000 seconds of rule learning and says that learning more rules increases application time. It does not say the original paper chose 1,000 seconds instead of 10,000 because prediction became prohibitively slow. In the citing sentence, that choice and its reason are described as the citing authors’ own. (LLM, conf=0.84)
plaindirect- Asserted: passes — The authors put it forward as true.
- Checkable: passes — It can be checked against evidence.
- Load-bearing: fails — The paper’s conclusions may not depend on it.
- Based: passes — The paper gives a reason why it holds.
Probably not a substantial claim. The paper’s conclusions may not depend on it.
- Partly supported
The cited sources support only part of this claim — read each source’s verdict below.
In the paper
“As a matter of fact, AnyBURL is a very challenging baseline for LP, as it is shown to outperform most latent-featuresbased models.”
What the sources say
- Partly supportedcites [37] [37] C. Meilicke, M. W. Chekol, D. Ruffinelli, and H. Stuckenschmidt. Anytime bottom-up rule learning for knowledge graph completion. 2019. - sourceExperimental — accuracy not yet measured
Section 5.2 says AnyBURL's results are at the same level as, and sometimes slightly better than, most of the embedding models compared. It reports stronger results than ConvE on most datasets and than SimplE, but says ComplEx-N3 performs better than AnyBURL. Thus the paper supports calling AnyBURL a challenging baseline, but 'outperform most' overstates its qualified comparison. (LLM, conf=0.86)
boosteddirect- Asserted: passes — The authors put it forward as true.
- Checkable: passes — It can be checked against evidence.
- Load-bearing: unclear — It is unclear whether the paper’s conclusions depend on it.
- Based: passes — The paper gives a reason why it holds.
It may state two separate claims as one.
- Partly supported
The cited sources support only part of this claim — read each source’s verdict below.
In the paper
“as noted by Fatemi et al . [15] and Wen et al. [68], 61% of the FreeBase relations are beyond-binary, and the corresponding hyperedges involve more than 1/3rd of the FreeBase entities.”
What the sources say
- Not matchedcites Fatemi et al . [15]
Couldn’t be matched to a paper in Crossref, so it can’t be checked.
- Partly supportedcites Wen et al. [68] [68] J. Wen, J. Li, Y. Mao, S. Chen, and R. Zhang. On the representation and embedding of knowledge bases beyond binary relations. In IJCAI , pages 1300-1307. IJCAI/AAAI Press, 2016. - sourceExperimental — accuracy not yet measured
The Introduction (p. 1) says that more than one-third of Freebase entities participate in non-binary relations, supporting the entity portion of the claim. Our copy does not report that 61% of Freebase relations are beyond-binary; a search for “61%” found no such statistic. (LLM, conf=0.88)
plain- Asserted: passes — The authors put it forward as true.
- Checkable: passes — It can be checked against evidence.
- Load-bearing: passes — The paper’s conclusions depend on it.
- Based: passes — The paper gives a reason why it holds.
It may state two separate claims as one.
- Not matched
The paper states this without a source or data behind it here, so there is nothing to check it against. The quote shows it is in the paper.
In the paper
“After exploding CVTs into cliques, deduplication is performed: if the same two entities were linked multiple times by the same types of relation using multiple CVTs - e.g. an artist winning multiple awards for the same work - this information is lost, as shown in Figure 4.”
plaindirect- Asserted: passes — The authors put it forward as true.
- Checkable: passes — It can be checked against evidence.
- Load-bearing: passes — The paper’s conclusions depend on it.
- Based: passes — The paper gives a reason why it holds.
It may state two separate claims as one.
The paper states this without a source or data behind it here, so there is nothing to check it against. The quote shows it is in the paper.
In the paper
“we observe that in AnyBURL predictions, even the full ranking may not contain all entities, as it only includes those supported by at least one rule in the model.”
hedgeddirect- Asserted: passes — The authors put it forward as true.
- Checkable: passes — It can be checked against evidence.
- Load-bearing: fails — The paper’s conclusions may not depend on it.
- Based: passes — The paper gives a reason why it holds.
Probably not a substantial claim. The paper’s conclusions may not depend on it.
A result the paper reports from its own data — it cites no other source for it, so there is none to check. The quote shows it is in the paper.
In the paper
“Not surprisingly, the largest dataset YAGO3-10 usually requires significantly longer training times.”
plaindirect- Asserted: passes — The authors put it forward as true.
- Checkable: passes — It can be checked against evidence.
- Load-bearing: fails — The paper’s conclusions may not depend on it.
- Based: passes — The paper gives a reason why it holds.
Probably not a substantial claim. The paper’s conclusions may not depend on it.
A result the paper reports from its own data — it cites no other source for it, so there is none to check. The quote shows it is in the paper.
In the paper
“AnyBURL treats the training time as a configuration parameter, and reaches stateof-the-art performance after just 100s for FB15k and WN18, and 1000s for FB15k237, WN18RR and YAGO3-10.”
plaindirect- Asserted: passes — The authors put it forward as true.
- Checkable: passes — It can be checked against evidence.
- Load-bearing: unclear — It is unclear whether the paper’s conclusions depend on it.
- Based: passes — The paper gives a reason why it holds.
It may state two separate claims as one.
The paper states this without a source or data behind it here, so there is nothing to check it against. The quote shows it is in the paper.
In the paper
“We also report that, quite strangely, for a few test facts built with S2C we could not find any CVTs in the FreeBase dump.”
hedged- Asserted: passes — The authors put it forward as true.
- Checkable: passes — It can be checked against evidence.
- Load-bearing: fails — The paper’s conclusions may not depend on it.
- Based: passes — The paper gives a reason why it holds.
Probably not a substantial claim. The paper’s conclusions may not depend on it.
A result the paper reports from its own data — it cites no other source for it, so there is none to check. The quote shows it is in the paper.
In the paper
“as we have usually observed analogous trends using MRR.”
plaincorrelational- Asserted: passes — The authors put it forward as true.
- Checkable: passes — It can be checked against evidence.
- Load-bearing: fails — The paper’s conclusions may not depend on it.
- Based: passes — The paper gives a reason why it holds.
Probably not a substantial claim. The paper’s conclusions may not depend on it.
The paper states this without a source or data behind it here, so there is nothing to check it against. The quote shows it is in the paper.
In the paper
“The generated edges are often redundant, and in the filtering operated to create FB15k-237, many of them are removed.”
plaindirect- Asserted: passes — The authors put it forward as true.
- Checkable: passes — It can be checked against evidence.
- Load-bearing: passes — The paper’s conclusions depend on it.
- Based: passes — The paper gives a reason why it holds.
It may state two separate claims as one.
A result the paper reports from its own data — it cites no other source for it, so there is none to check. The quote shows it is in the paper.
In the paper
“In most cases we have not found significant variations; nonetheless, for a few models, min policy yields significantly different results from the other policies.”
plain- Asserted: passes — The authors put it forward as true.
- Checkable: passes — It can be checked against evidence.
- Load-bearing: passes — The paper’s conclusions depend on it.
- Based: passes — The paper gives a reason why it holds.
It may state two separate claims as one.
The paper states this without a source or data behind it here, so there is nothing to check it against. The quote shows it is in the paper.
In the paper
“In other words, in the new semantics, each fact has happened at least once .”
plain- Asserted: passes — The authors put it forward as true.
- Checkable: passes — It can be checked against evidence.
- Load-bearing: passes — The paper’s conclusions depend on it.
- Based: passes — The paper gives a reason why it holds.
Probably not a substantial claim.
The paper states this without a source or data behind it here, so there is nothing to check it against. The quote shows it is in the paper.
In the paper
“We observe that ANALOGY behaves particularly well in terms of prediction time”
plain- Asserted: passes — The authors put it forward as true.
- Checkable: passes — It can be checked against evidence.
- Load-bearing: fails — The paper’s conclusions may not depend on it.
- Based: passes — The paper gives a reason why it holds.
Probably not a substantial claim. The paper’s conclusions may not depend on it.
A result the paper reports from its own data — it cites no other source for it, so there is none to check. The quote shows it is in the paper.
In the paper
“On YAGO3-10, quite interestingly, ConvKB does not seem to suffer from this issue, while CrossE shows a noticeable difference. CapsE shows the largest problems, with a behaviour akin to the extreme example described above.”
hedged- Asserted: passes — The authors put it forward as true.
- Checkable: passes — It can be checked against evidence.
- Load-bearing: unclear — It is unclear whether the paper’s conclusions depend on it.
- Based: passes — The paper gives a reason why it holds.
It may state two separate claims as one.
A result the paper reports from its own data — it cites no other source for it, so there is none to check. The quote shows it is in the paper.
In the paper
“we were able to use RPS as the scoring function of a standalone LP model based on observable features, obtaining acceptable results.”
plain- Asserted: passes — The authors put it forward as true.
- Checkable: passes — It can be checked against evidence.
- Load-bearing: passes — The paper’s conclusions depend on it.
- Based: passes — The paper gives a reason why it holds.
The quote only partly states this claim.
A result the paper reports from its own data — it cites no other source for it, so there is none to check. The quote shows it is in the paper.
In the paper
“In FB15k and FB15k-237 both ConvKB and CapsE display huge discrepancies on all metrics, whereas on WN18 and WN18RR the results are almost identical.”
plain- Asserted: passes — The authors put it forward as true.
- Checkable: passes — It can be checked against evidence.
- Load-bearing: passes — The paper’s conclusions depend on it.
- Based: passes — The paper gives a reason why it holds.
It may state two separate claims as one.
A result the paper reports from its own data — it cites no other source for it, so there is none to check. The quote shows it is in the paper.
In the paper
“In WN18 and WN18RR the percentage of facts with symmetric relations is quite higher, but no reflexive and transitive relations are found at all.”
plain- Asserted: passes — The authors put it forward as true.
- Checkable: passes — It can be checked against evidence.
- Load-bearing: unclear — It is unclear whether the paper’s conclusions depend on it.
- Based: passes — The paper gives a reason why it holds.
It may state two separate claims as one.
The paper states this without a source or data behind it here, so there is nothing to check it against. The quote shows it is in the paper.
In the paper
“In FB15k-237 most of the redundant facts obtained from reified relations have been filtered away, therefore the large majority of test facts belongs to the first bucket.”
plaindirect- Asserted: passes — The authors put it forward as true.
- Checkable: passes — It can be checked against evidence.
- Load-bearing: unclear — It is unclear whether the paper’s conclusions depend on it.
- Based: passes — The paper gives a reason why it holds.
It may state two separate claims as one.
A result the paper reports from its own data — it cites no other source for it, so there is none to check. The quote shows it is in the paper.
In the paper
“In FB15k and WN18, well known for their test leakage, the correlation with performances becomes evidently stronger.”
boostedcorrelational- Asserted: passes — The authors put it forward as true.
- Checkable: passes — It can be checked against evidence.
- Load-bearing: passes — The paper’s conclusions depend on it.
- Based: passes — The paper gives a reason why it holds.
The quote only partly states this claim.
A result the paper reports from its own data — it cites no other source for it, so there is none to check. The quote shows it is in the paper.
In the paper
“It is particularly evident in WN18, WN18RR and YAGO3-10, and to a slightly lesser extent in FB15k-237.”
plaincorrelational- Asserted: passes — The authors put it forward as true.
- Checkable: passes — It can be checked against evidence.
- Load-bearing: unclear — It is unclear whether the paper’s conclusions depend on it.
- Based: passes — The paper gives a reason why it holds.
It may state two separate claims as one.
None of the sources cited for this claim could be matched to a paper in Crossref, so there is nothing to check it against.
In the paper
“In YAGO3-10 we observe once again TransE [8] and ConvKB [41] having a hard time handling symmetric relations; on these relations, most models actually tend to behave a little worse than their global H@1.”
What the sources say
- Not matchedcites TransE [8]
Couldn’t be matched to a paper in Crossref, so it can’t be checked.
- Not matchedcites ConvKB [41]
Couldn’t be matched to a paper in Crossref, so it can’t be checked.
plaincorrelational- Asserted: passes — The authors put it forward as true.
- Checkable: passes — It can be checked against evidence.
- Load-bearing: unclear — It is unclear whether the paper’s conclusions depend on it.
- Based: passes — The paper gives a reason why it holds.
It may state two separate claims as one.
- Not matched
The paper states this without a source or data behind it here, so there is nothing to check it against. The quote shows it is in the paper.
In the paper
“The Geometric family, on the other hand, shows slightly more unstable results.”
plaincorrelational- Asserted: passes — The authors put it forward as true.
- Checkable: passes — It can be checked against evidence.
- Load-bearing: unclear — It is unclear whether the paper’s conclusions depend on it.
- Based: unclear — It is unclear why the paper says it holds.
The quote only partly states this claim.
A result the paper reports from its own data — it cites no other source for it, so there is none to check. The quote shows it is in the paper.
In the paper
“In FB15K and FB15K-237 we observe an impressive majority of irreflexive and anti-symmetric relations. Only a few facts involve reflexive, symmetric or transitive relations.”
plain- Asserted: passes — The authors put it forward as true.
- Checkable: passes — It can be checked against evidence.
- Load-bearing: unclear — It is unclear whether the paper’s conclusions depend on it.
- Based: passes — The paper gives a reason why it holds.
It may state two separate claims as one.
A result the paper reports from its own data — it cites no other source for it, so there is none to check. The quote shows it is in the paper.
In the paper
“In YAGO3-10 all test facts feature irreflexive relations; there is a high percentage of facts featuring anti-symmetric relations as well, whereas only a few of them involve symmetric or transitive relations.”
plain- Asserted: passes — The authors put it forward as true.
- Checkable: passes — It can be checked against evidence.
- Load-bearing: unclear — It is unclear whether the paper’s conclusions depend on it.
- Based: passes — The paper gives a reason why it holds.
It may state two separate claims as one.
A result the paper reports from its own data — it cites no other source for it, so there is none to check. The quote shows it is in the paper.
In the paper
“In particular, ComplEx with its N3 regularization displays amazing results on all metrics across all datasets, being the only embedding-based model consistently comparable to the baseline AnyBURL.”
boostedcorrelational- Asserted: passes — The authors put it forward as true.
- Checkable: passes — It can be checked against evidence.
- Load-bearing: unclear — It is unclear whether the paper’s conclusions depend on it.
- Based: passes — The paper gives a reason why it holds.
It may state two separate claims as one.
None of the sources cited for this claim could be matched to a paper in Crossref, so there is nothing to check it against.
In the paper
“In our experiments we have found that CrossE [72] and, to a much greater extent, ConvKB [41] and CapsE [43], seem sensitive to this issue.”
What the sources say
- Not matchedcites CrossE [72]
Couldn’t be matched to a paper in Crossref, so it can’t be checked.
- Not matchedcites ConvKB [41]
Couldn’t be matched to a paper in Crossref, so it can’t be checked.
- Not matchedcites CapsE [43]
Couldn’t be matched to a paper in Crossref, so it can’t be checked.
hedgedcorrelational- Asserted: passes — The authors put it forward as true.
- Checkable: passes — It can be checked against evidence.
- Load-bearing: unclear — It is unclear whether the paper’s conclusions depend on it.
- Based: passes — The paper gives a reason why it holds.
It may state two separate claims as one.
- Not matched
A result the paper reports from its own data — it cites no other source for it, so there is none to check. The quote shows it is in the paper.
In the paper
“In YAGO3-10 we still report a significant difference between min and average results, but it is much smaller than before.”
plain- Asserted: passes — The authors put it forward as true.
- Checkable: passes — It can be checked against evidence.
- Load-bearing: unclear — It is unclear whether the paper’s conclusions depend on it.
- Based: passes — The paper gives a reason why it holds.
It may state two separate claims as one.
In the paper
“In FB15K all models based on embeddings seem to perform quite well on reflexive relations; on the other hand, the baseline AnyBURL [37] obtains quite bad results on them possibly due to its rule-based approach”
What the sources say
- Not matchedcites AnyBURL [37]
Couldn’t be matched to a paper in Crossref, so it can’t be checked.
hedgedcorrelational- Asserted: passes — The authors put it forward as true.
- Checkable: passes — It can be checked against evidence.
- Load-bearing: unclear — It is unclear whether the paper’s conclusions depend on it.
- Based: passes — The paper gives a reason why it holds.
It may state two separate claims as one.
- Not matched
None of the sources cited for this claim could be matched to a paper in Crossref, so there is nothing to check it against.
In the paper
“In FB15K, in most models we observe that a higher degree generally corresponds to better H@1. The main exceptions are TransE [8], CrossE [72] and STransE [42], that show a stable or even worsening pattern.”
What the sources say
- Not matchedcites TransE [8]
Couldn’t be matched to a paper in Crossref, so it can’t be checked.
- Not matchedcites CrossE [72]
Couldn’t be matched to a paper in Crossref, so it can’t be checked.
- Not matchedcites STransE [42]
Couldn’t be matched to a paper in Crossref, so it can’t be checked.
plaincorrelational- Asserted: passes — The authors put it forward as true.
- Checkable: passes — It can be checked against evidence.
- Load-bearing: passes — The paper’s conclusions depend on it.
- Based: passes — The paper gives a reason why it holds.
It may state two separate claims as one.
- Not matched
The paper states this without a source or data behind it here, so there is nothing to check it against. The quote shows it is in the paper.
In the paper
“unfortunately, we found that for our experiments, where the full ranking for all predictions is required for all models in all datasets, PR evaluation is way too time-consuming and thus unfeasible.”
plain- Asserted: passes — The authors put it forward as true.
- Checkable: passes — It can be checked against evidence.
- Load-bearing: passes — The paper’s conclusions depend on it.
- Based: passes — The paper gives a reason why it holds.
Probably not a substantial claim. It may state two separate claims as one.
A result the paper reports from its own data — it cites no other source for it, so there is none to check. The quote shows it is in the paper.
In the paper
“These models show interesting results, but still suffer from some irregularities across metrics and datasets.”
plain- Asserted: passes — The authors put it forward as true.
- Checkable: passes — It can be checked against evidence.
- Load-bearing: unclear — It is unclear whether the paper’s conclusions depend on it.
- Based: passes — The paper gives a reason why it holds.
It may state two separate claims as one.
The paper states this without a source or data behind it here, so there is nothing to check it against. The quote shows it is in the paper.
In the paper
“On the contrary, in their FB15k-237, WN18RR and YAGO3-10, which do not suffer from test leakage, models appear to rely also on longer relational paths (3 steps), as well as on the numbers of source/target peers.”
hedgedcorrelational- Asserted: passes — The authors put it forward as true.
- Checkable: passes — It can be checked against evidence.
- Load-bearing: passes — The paper’s conclusions depend on it.
- Based: passes — The paper gives a reason why it holds.
It may state two separate claims as one.
A result the paper reports from its own data — it cites no other source for it, so there is none to check. The quote shows it is in the paper.
In the paper
“ConvR and RSN display by far the best results in this family, achieving very similar, state-of-the-art performance in FB15k, WN18 and YAGO3-10.”
boostedcorrelational- Asserted: passes — The authors put it forward as true.
- Checkable: passes — It can be checked against evidence.
- Load-bearing: unclear — It is unclear whether the paper’s conclusions depend on it.
- Based: passes — The paper gives a reason why it holds.
It may state two separate claims as one.
The paper states this without a source or data behind it here, so there is nothing to check it against. The quote shows it is in the paper.
In the paper
“Deep Learning models, finally, are the most diverse family, with wildly different results depending on the architectural choices of the models and on their implementations.”
plaindirect- Asserted: passes — The authors put it forward as true.
- Checkable: passes — It can be checked against evidence.
- Load-bearing: fails — The paper’s conclusions may not depend on it.
- Based: passes — The paper gives a reason why it holds.
Probably not a substantial claim. The paper’s conclusions may not depend on it.
The paper states this without a source or data behind it here, so there is nothing to check it against. The quote shows it is in the paper.
In the paper
“We observe that in almost all models and datasets, predictions seem to be facilitated by the presence of source peers and hindered by the presence of target peers.”
hedgeddirect- Asserted: passes — The authors put it forward as true.
- Checkable: passes — It can be checked against evidence.
- Load-bearing: passes — The paper’s conclusions depend on it.
- Based: passes — The paper gives a reason why it holds.
It may state two separate claims as one.
The paper states this without a source or data behind it here, so there is nothing to check it against. The quote shows it is in the paper.
In the paper
“At this regard, RotatE shows remarkably consistent performances across all datasets, and it particularly shines when taking into account H@10.”
boostedcorrelational- Asserted: passes — The authors put it forward as true.
- Checkable: passes — It can be checked against evidence.
- Load-bearing: unclear — It is unclear whether the paper’s conclusions depend on it.
- Based: passes — The paper gives a reason why it holds.
It may state two separate claims as one.
A result the paper reports from its own data — it cites no other source for it, so there is none to check. The quote shows it is in the paper.
In the paper
“On the other hand, models such as ConvKB and CapsE often achieve promising results on H@10 and MR metrics, whereas they seem to struggle with H@1 and MRR; furthermore, in some datasets they are clearly hindered by their issues with tie policies described in Section 5.4.1.”
hedgedcorrelational- Asserted: passes — The authors put it forward as true.
- Checkable: passes — It can be checked against evidence.
- Load-bearing: unclear — It is unclear whether the paper’s conclusions depend on it.
- Based: passes — The paper gives a reason why it holds.
It may state two separate claims as one.
A claim is checked only against the cited paper’s full text, never its abstract, and none is available for its sources.
In the paper
“For instance, it has been observed that over 70% of person entities have no known place of birth, and over 99% have no known ethnicity [12, 69] in FreeBase, one of the largest and most widely used KGs for research purposes.”
What the sources say
- Not checked — no full text of the sourcecites [12] [12] X. L. Dong, E. Gabrilovich, G. Heitz, W. Horn, N. Lao, K. Murphy, T. Strohmann, S. Sun, and W. Zhang. Knowledge vault: A web-scale approach to probabilistic knowledge fusion. In Proceedings of the 20th ACM SIGKDD International Conference on Knowledge Discovery and Data Mining , KDD '14, pages 601-610. ACM, 2014. - source
- Not checked — no full text of the sourcecites [69] [69] R. West, E. Gabrilovich, K. Murphy, S. Sun, R. Gupta, and D. Lin. Knowledge base completion via search-based question answering. In Proceedings of the 23rd international conference on World wide web , pages 515-526. ACM, 2014. - source
plain- Asserted: passes — The authors put it forward as true.
- Checkable: passes — It can be checked against evidence.
- Load-bearing: fails — The paper’s conclusions may not depend on it.
- Based: passes — The paper gives a reason why it holds.
Probably not a substantial claim. The paper’s conclusions may not depend on it. It may state two separate claims as one.
In the paper
“CrossE [72] is one of the most recent and also most effective models in this group. For each relation it learns an additional relation-specific embedding 𝒄 𝒓 . Given any fact ⟨ ℎ, 𝑟, 𝑡 ⟩ , CrossE uses element-wise products (denoted by ⊙ in Table 1) to combine 𝒉 and 𝒓 with 𝒄 𝒓 . This results in triple-specific embeddings, dubbed interaction embeddings, that are then used in the translation.”
What the sources say
- Not matchedcites [72] [72] W. Zhang, B. Paudel, W. Zhang, A. Bernstein, and H. Chen. Interaction embeddings for prediction and explanation in knowledge graphs. In Proceedings of the Twelfth ACM International Conference on Web Search and Data Mining, WSDM 2019, Melbourne, VIC, Australia, February 11-15, 2019 , pages 96-104, 2019.
Couldn’t be matched to a paper in Crossref, so it can’t be checked.
plaindirect- Asserted: passes — The authors put it forward as true.
- Checkable: passes — It can be checked against evidence.
- Load-bearing: fails — The paper’s conclusions may not depend on it.
- Based: passes — The paper gives a reason why it holds.
Probably not a substantial claim. The paper’s conclusions may not depend on it. It may state two separate claims as one.
- Not matched
In the paper
“It has been recently acknowledged by the authors [56] that the test set includes 212 entities that do not appear in the training set, making it impossible to reasonably predict about 6.7% test facts.”
What the sources say
- Not matchedcites [56] [56] TimDettmers. Conve. https://github.com/TimDettmers/ConvE. [Online; accessed 10-October-2019]. -
Couldn’t be matched to a paper in Crossref, so it can’t be checked.
plaindirect- Asserted: passes — The authors put it forward as true.
- Checkable: passes — It can be checked against evidence.
- Load-bearing: unclear — It is unclear whether the paper’s conclusions depend on it.
- Based: passes — The paper gives a reason why it holds.
It may state two separate claims as one.
- Not matched
A conclusion the paper draws from its own results — it cites no other source for it, so there is none to check. The quote shows it is in the paper.
In the paper
“Training Time and Prediction Time mostly depend ( 𝑖 ) on the model architecture (e.g. deep neural networks may require longer computations due to their inherently longer pipeline of operations);”
plaindirect- Asserted: passes — The authors put it forward as true.
- Checkable: passes — It can be checked against evidence.
- Load-bearing: fails — The paper’s conclusions may not depend on it.
- Based: passes — The paper gives a reason why it holds.
Probably not a substantial claim. The paper’s conclusions may not depend on it. The quote only partly states this claim.
In the paper
“Due to the nature of translation, TransE is not able to correctly handle one-to-many and many-to-one relations, as well as symmetric and transitive relations.”
What the sources say
- Not matchedcites [8] [8] A. Bordes, N. Usunier, A. Garcia-Duran, J. Weston, and O. Yakhnenko. Translating embeddings for modeling multi-relational data. In Advances in neural information processing systems , pages 2787-2795. NIPS, 2013. -
Couldn’t be matched to a paper in Crossref, so it can’t be checked.
plain- Asserted: passes — The authors put it forward as true.
- Checkable: passes — It can be checked against evidence.
- Load-bearing: unclear — It is unclear whether the paper’s conclusions depend on it.
- Based: passes — The paper gives a reason why it holds.
It may state two separate claims as one.
- Not matched
In the paper
“DistMult [71] forces all relation embeddings to be diagonal matrices, which consistently reduces the space of parameters to be learned, resulting in a much easier model to train.”
What the sources say
- Not checked yetcites [71] [71] B. Yang, W. Yih, X. He, J. Gao, and L. Deng. Embedding entities and relations for learning and inference in knowledge bases. In 3rd International Conference on Learning Representations, ICLR 2015, San Diego, CA, USA, May 7-9, 2015, Conference Track Proceedings , 2015. -
plaindirect- Asserted: passes — The authors put it forward as true.
- Checkable: passes — It can be checked against evidence.
- Load-bearing: unclear — It is unclear whether the paper’s conclusions depend on it.
- Based: passes — The paper gives a reason why it holds.
It may state two separate claims as one.
The paper states this without a source or data behind it here, so there is nothing to check it against. The quote shows it is in the paper.
In the paper
“Depending on their semantics, relations can be characterized by several properties heavily affecting the ways in which they appear in the facts.”
plaindirect- Asserted: passes — The authors put it forward as true.
- Checkable: passes — It can be checked against evidence.
- Load-bearing: fails — The paper’s conclusions may not depend on it.
- Based: passes — The paper gives a reason why it holds.
Probably not a substantial claim. The paper’s conclusions may not depend on it.
What the paper did — it cites no source for this, so there is none to check. The quote shows it is in the paper.
In the paper
“Therefore, we have modified them in order to extract evaluation results with multiple policies for each model.”
plain- Asserted: passes — The authors put it forward as true.
- Checkable: passes — It can be checked against evidence.
- Load-bearing: passes — The paper’s conclusions depend on it.
- Based: passes — The paper gives a reason why it holds.
Probably not a substantial claim.
A conclusion the paper draws from its own results — it cites no other source for it, so there is none to check. The quote shows it is in the paper.
In the paper
“As already pointed out, S2C is not reversible due to its inherent deduplication; therefore, this process often yields multiple CVTs for the same fact.”
plaindirect- Asserted: passes — The authors put it forward as true.
- Checkable: passes — It can be checked against evidence.
- Load-bearing: passes — The paper’s conclusions depend on it.
- Based: passes — The paper gives a reason why it holds.
It may state two separate claims as one.
A conclusion the paper draws from its own results — it cites no other source for it, so there is none to check. The quote shows it is in the paper.
In the paper
“( 𝑖𝑖𝑖 ) on the dataset size, namely the number of entities and relations to learn and, for the Training Time, the number of training triples to process.”
plaindirect- Asserted: passes — The authors put it forward as true.
- Checkable: passes — It can be checked against evidence.
- Load-bearing: fails — The paper’s conclusions may not depend on it.
- Based: fails — The paper may give no reason why it holds.
Probably not a substantial claim. The paper’s conclusions may not depend on it. The paper may give no reason why it holds. It may state two separate claims as one.
In the paper
“As shown by Kadlec et al . [26], LP models tend to be extremely sensitive to hyperparameter tuning, and the hyperparameters for any model often need to be tuned separately for each dataset.”
What the sources say
- Not matchedcites Kadlec et al . [26]
Couldn’t be matched to a paper in Crossref, so it can’t be checked.
plaincorrelational- Asserted: passes — The authors put it forward as true.
- Checkable: passes — It can be checked against evidence.
- Load-bearing: passes — The paper’s conclusions depend on it.
- Based: passes — The paper gives a reason why it holds.
It may state two separate claims as one.
- Not matched
A conclusion the paper draws from its own results — it cites no other source for it, so there is none to check. The quote shows it is in the paper.
In the paper
“we stress that this depends on the fact that AnyBURL is not designed to generate full rankings, and that using top-k policy lower 𝑘 values would result in much faster computations.”
hedgeddirect- Asserted: passes — The authors put it forward as true.
- Checkable: passes — It can be checked against evidence.
- Load-bearing: passes — The paper’s conclusions depend on it.
- Based: passes — The paper gives a reason why it holds.
It may state two separate claims as one.
A conclusion the paper draws from its own results — it cites no other source for it, so there is none to check. The quote shows it is in the paper.
In the paper
“this may possibly depend on this model being implemented in C++.”
hedgedconditional- Asserted: passes — The authors put it forward as true.
- Checkable: passes — It can be checked against evidence.
- Load-bearing: fails — The paper’s conclusions may not depend on it.
- Based: fails — The paper may give no reason why it holds.
Probably not a substantial claim. The paper’s conclusions may not depend on it. The paper may give no reason why it holds.
A conclusion the paper draws from its own results — it cites no other source for it, so there is none to check. The quote shows it is in the paper.
In the paper
“( 𝑖𝑖 ) on the model hyperparameters, such as embedding size and number of negative samples for each positive one;”
plaindirect- Asserted: passes — The authors put it forward as true.
- Checkable: passes — It can be checked against evidence.
- Load-bearing: fails — The paper’s conclusions may not depend on it.
- Based: passes — The paper gives a reason why it holds.
Probably not a substantial claim. The paper’s conclusions may not depend on it. The quote only partly states this claim.
In the paper
“For instance, Meilicke et al. [38] have analyzed how their implementations of HolE [45], RESCAL [46] and TransE [8] perform on symmetric relations in various datasets; they report surprisingly bad results for HolE on symmetric relations in FB15K, despite HolE being fully expressive).”
What the sources say
- Not matchedcites [38] [38] C. Meilicke, M. Fink, Y. Wang, D. Ruffinelli, R. Gemulla, and H. Stuckenschmidt. Fine-grained evaluation of rule-and embedding-based systems for knowledge graph completion. In International Semantic Web Conference , pages 3-20. Springer, 2018. -
Couldn’t be matched to a paper in Crossref, so it can’t be checked.
plaincorrelational- Asserted: passes — The authors put it forward as true.
- Checkable: passes — It can be checked against evidence.
- Load-bearing: fails — The paper’s conclusions may not depend on it.
- Based: passes — The paper gives a reason why it holds.
Probably not a substantial claim. The paper’s conclusions may not depend on it. It may state two separate claims as one.
- Not matched
The paper states this without a source or data behind it here, so there is nothing to check it against. The quote shows it is in the paper.
In the paper
“Such properties have been well known in the LP literature for a long time, because they may lead a relation to form very specific structures and patterns in the graph; this, depending on the model, can make their facts easier or harder to learn and predict.”
boostedconditional- Asserted: passes — The authors put it forward as true.
- Checkable: passes — It can be checked against evidence.
- Load-bearing: fails — The paper’s conclusions may not depend on it.
- Based: passes — The paper gives a reason why it holds.
Probably not a substantial claim. The paper’s conclusions may not depend on it.
A conclusion the paper draws from its own results — it cites no other source for it, so there is none to check. The quote shows it is in the paper.
In the paper
“While the number of peers only depends on the local neighborhood of the source and target entity, RPS relies on paths that typically have length greater than one.”
plaindirect- Asserted: passes — The authors put it forward as true.
- Checkable: passes — It can be checked against evidence.
- Load-bearing: unclear — It is unclear whether the paper’s conclusions depend on it.
- Based: passes — The paper gives a reason why it holds.
It may state two separate claims as one.
In the paper
“For instance, TransE [8] and some of its successors are inherently unable to learn symmetric and transitive relations due to the nature of translation itself.”
What the sources say
- Not matchedcites [8] [8] A. Bordes, N. Usunier, A. Garcia-Duran, J. Weston, and O. Yakhnenko. Translating embeddings for modeling multi-relational data. In Advances in neural information processing systems , pages 2787-2795. NIPS, 2013. -
Couldn’t be matched to a paper in Crossref, so it can’t be checked.
plaindirect- Asserted: passes — The authors put it forward as true.
- Checkable: passes — It can be checked against evidence.
- Load-bearing: fails — The paper’s conclusions may not depend on it.
- Based: passes — The paper gives a reason why it holds.
Probably not a substantial claim. The paper’s conclusions may not depend on it.
- Not matched
What the paper did — it cites no source for this, so there is none to check. The quote shows it is in the paper.
In the paper
“When we have found multiple implementations for the same model, we have always chosen the best best performing one, with the goal of analyzing each model at its best.”
plain- Asserted: passes — The authors put it forward as true.
- Checkable: passes — It can be checked against evidence.
- Load-bearing: fails — The paper’s conclusions may not depend on it.
- Based: passes — The paper gives a reason why it holds.
Probably not a substantial claim. The paper’s conclusions may not depend on it.
A conclusion the paper draws from its own results — it cites no other source for it, so there is none to check. The quote shows it is in the paper.
In the paper
“These scores are mainly affected by the embedding dimensions and by the evaluation batch size”
plaindirect- Asserted: passes — The authors put it forward as true.
- Checkable: passes — It can be checked against evidence.
- Load-bearing: fails — The paper’s conclusions may not depend on it.
- Based: passes — The paper gives a reason why it holds.
Probably not a substantial claim. The paper’s conclusions may not depend on it.
What the paper did — it cites no source for this, so there is none to check. The quote shows it is in the paper.
In the paper
“In order to use it as a baseline in our experiments, however, we needed to extract full ranking for each prediction, setting 𝑘 = |E| : this resulted in much longer computation times.”
plaindirect- Asserted: passes — The authors put it forward as true.
- Checkable: passes — It can be checked against evidence.
- Load-bearing: fails — The paper’s conclusions may not depend on it.
- Based: passes — The paper gives a reason why it holds.
Probably not a substantial claim. The paper’s conclusions may not depend on it. It may state two separate claims as one.
What the paper did — it cites no source for this, so there is none to check. The quote shows it is in the paper.
In the paper
“In order to make our results directly reproducible, we have employed, whenever possible, publicly available implementations.”
plain- Asserted: passes — The authors put it forward as true.
- Checkable: passes — It can be checked against evidence.
- Load-bearing: fails — The paper’s conclusions may not depend on it.
- Based: passes — The paper gives a reason why it holds.
Probably not a substantial claim. The paper’s conclusions may not depend on it.
What the paper did — it cites no source for this, so there is none to check. The quote shows it is in the paper.
In the paper
“for models relying on min policy in their original implementation we report their results obtained with average policy instead”
plain- Asserted: passes — The authors put it forward as true.
- Checkable: passes — It can be checked against evidence.
- Load-bearing: passes — The paper’s conclusions depend on it.
- Based: passes — The paper gives a reason why it holds.
Probably not a substantial claim.
What the paper did — it cites no source for this, so there is none to check. The quote shows it is in the paper.
In the paper
“Therefore, unless differently specified, for models that employed min policy in their original implementation we report their average results instead, as the latter are directly comparable to the results of the other models, whereas the former are not.”
plaindirect- Asserted: passes — The authors put it forward as true.
- Checkable: passes — It can be checked against evidence.
- Load-bearing: passes — The paper’s conclusions depend on it.
- Based: passes — The paper gives a reason why it holds.
Probably not a substantial claim. It may state two separate claims as one.
What the paper did — it cites no source for this, so there is none to check. The quote shows it is in the paper.
In the paper
“In our trainings, we have relied on the hyperparameter settings reported by the authors for all datasets on which they have run experiments.”
plain- Asserted: passes — The authors put it forward as true.
- Checkable: passes — It can be checked against evidence.
- Load-bearing: passes — The paper’s conclusions depend on it.
- Based: passes — The paper gives a reason why it holds.
Probably not a substantial claim.
A conclusion the paper draws from its own results — it cites no other source for it, so there is none to check. The quote shows it is in the paper.
In the paper
“This means that in very few facts, the target entity may not be included even in the full ranking.”
hedged- Asserted: passes — The authors put it forward as true.
- Checkable: passes — It can be checked against evidence.
- Load-bearing: fails — The paper’s conclusions may not depend on it.
- Based: passes — The paper gives a reason why it holds.
Probably not a substantial claim. The paper’s conclusions may not depend on it.
What the paper did — it cites no source for this, so there is none to check. The quote shows it is in the paper.
In the paper
“We show this by replicating our experiment using RPS values computed with relational paths of maximum lengths 1 and 2, instead of 3.”
plain- Asserted: passes — The authors put it forward as true.
- Checkable: passes — It can be checked against evidence.
- Load-bearing: passes — The paper’s conclusions depend on it.
- Based: passes — The paper gives a reason why it holds.
Probably not a substantial claim.
A conclusion the paper draws from its own results — it cites no other source for it, so there is none to check. The quote shows it is in the paper.
In the paper
“The sigmoid function is not saturating, but for values with very large modulus its slope is almost nil: therefore, due to low-level approximations, it behaves just like a saturating function.”
plaindirect- Asserted: passes — The authors put it forward as true.
- Checkable: passes — It can be checked against evidence.
- Load-bearing: passes — The paper’s conclusions depend on it.
- Based: passes — The paper gives a reason why it holds.
It may state two separate claims as one.
A conclusion the paper draws from its own results — it cites no other source for it, so there is none to check. The quote shows it is in the paper.
In the paper
“In the most extreme case, if a model always gives the same score to all entities in the dataset, using min policy it will obtain H@1 = 1.0 (perfect score) whereas using any other policy it would obtain H@1 around 0.0.”
hedgeddirect- Asserted: passes — The authors put it forward as true.
- Checkable: passes — It can be checked against evidence.
- Load-bearing: unclear — It is unclear whether the paper’s conclusions depend on it.
- Based: passes — The paper gives a reason why it holds.
It may state two separate claims as one.
A conclusion the paper draws from its own results — it cites no other source for it, so there is none to check. The quote shows it is in the paper.
In the paper
“as a consequence, when learning facts with symmetric relations, these models tend to place the possible answers very close to each other in the embedding space. The result would be a crowded area in which the the correct target is often outranked when it comes to H@1, but manages to make it to the top K answers for larger values of K.”
hedgeddirect- Asserted: passes — The authors put it forward as true.
- Checkable: passes — It can be checked against evidence.
- Load-bearing: passes — The paper’s conclusions depend on it.
- Based: passes — The paper gives a reason why it holds.
It may state two separate claims as one.
- Rests on an assumption: TransE, STransE, and CrossE are naturally inclined to represent symmetric relations with very small vectors in the embedding space.
- Rests on an assumption: Due to the S2C transformation, original reified relations tend to generate a high number of facts containing symmetric relations.
A conclusion the paper draws from its own results — it cites no other source for it, so there is none to check. The quote shows it is in the paper.
In the paper
“We underline that this decrease in performance is not caused by the target peers just outscoring the target entity: we are taking into account filtered scenario results, therefore target peers, being valid answers to our predictions, do not contribute to the rank computation.”
plain- Asserted: passes — The authors put it forward as true.
- Checkable: passes — It can be checked against evidence.
- Load-bearing: passes — The paper’s conclusions depend on it.
- Based: passes — The paper gives a reason why it holds.
It may state two separate claims as one.
The paper states this without a source or data behind it here, so there is nothing to check it against. The quote shows it is in the paper.
In the paper
“Saturating activation functions yield the same result for inputs beyond (or below) a certain value.”
plain- Asserted: passes — The authors put it forward as true.
- Checkable: passes — It can be checked against evidence.
- Load-bearing: passes — The paper’s conclusions depend on it.
- Based: passes — The paper gives a reason why it holds.
Probably not a substantial claim.
A conclusion the paper draws from its own results — it cites no other source for it, so there is none to check. The quote shows it is in the paper.
In the paper
“In more balanced scenarios, on the contrary, models seem to investigate to a certain extent longer dependencies, as well as to focus more on analogical reasoning supported by examples (such as source peers).”
hedgedcorrelational- Asserted: passes — The authors put it forward as true.
- Checkable: passes — It can be checked against evidence.
- Load-bearing: unclear — It is unclear whether the paper’s conclusions depend on it.
- Based: passes — The paper gives a reason why it holds.
It may state two separate claims as one.
A conclusion the paper draws from its own results — it cites no other source for it, so there is none to check. The quote shows it is in the paper.
In the paper
“As already mentioned, source peers work as examples that allow models to characterize more effectively the relation and the target to predict, whereas target peers lead models to confusion, as they try to optimize embeddings to fit too many different answers for the same question.”
plaindirect- Asserted: passes — The authors put it forward as true.
- Checkable: passes — It can be checked against evidence.
- Load-bearing: passes — The paper’s conclusions depend on it.
- Based: passes — The paper gives a reason why it holds.
It may state two separate claims as one.
A conclusion the paper draws from its own results — it cites no other source for it, so there is none to check. The quote shows it is in the paper.
In the paper
“The FB15k and FB15k-237 datasets have been built by performing S2C explosion on FreeBase subsamples; this has resulted in greatly altering both the graph structure and its semantics, with overall loss of information.”
plaindirect- Asserted: passes — The authors put it forward as true.
- Checkable: passes — It can be checked against evidence.
- Load-bearing: passes — The paper’s conclusions depend on it.
- Based: passes — The paper gives a reason why it holds.
It may state two separate claims as one.
A conclusion the paper draws from its own results — it cites no other source for it, so there is none to check. The quote shows it is in the paper.
In the paper
“Nevertheless, we show that performances computed relying on different policies risk to be not directly comparable to one another, and might not even reflect the actual predictive effectiveness of models.”
hedgedconditional- Asserted: passes — The authors put it forward as true.
- Checkable: passes — It can be checked against evidence.
- Load-bearing: passes — The paper’s conclusions depend on it.
- Based: passes — The paper gives a reason why it holds.
It may state two separate claims as one.
A conclusion the paper draws from its own results — it cites no other source for it, so there is none to check. The quote shows it is in the paper.
In the paper
“approximations may also lead non-saturating functions, such as Sigmoid, behave as saturating in regions where their slope is particularly close to 0.”
hedgedconditional- Asserted: passes — The authors put it forward as true.
- Checkable: passes — It can be checked against evidence.
- Load-bearing: fails — The paper’s conclusions may not depend on it.
- Based: fails — The paper may give no reason why it holds.
Probably not a substantial claim. The paper’s conclusions may not depend on it. The paper may give no reason why it holds.
A conclusion the paper draws from its own results — it cites no other source for it, so there is none to check. The quote shows it is in the paper.
In the paper
“In presence of very short patterns providing overwhelming predictive evidence (e.g., the inverse relations that cause test leakage), models seem very prone to just focusing on them, disregarding other forms of reasoning: this can be seen as an unhealthy consequence of the test leakage problem.”
hedgeddirect- Asserted: passes — The authors put it forward as true.
- Checkable: passes — It can be checked against evidence.
- Load-bearing: passes — The paper’s conclusions depend on it.
- Based: passes — The paper gives a reason why it holds.
It may state two separate claims as one.
A conclusion the paper draws from its own results — it cites no other source for it, so there is none to check. The quote shows it is in the paper.
In the paper
“In FB15k-237 and WN18RR, whose filtering processes have cut away the most relevant paths, RSN seems to have a harder time, probably due to its formulation that explicitly leverages paths.”
hedgedconditional- Asserted: passes — The authors put it forward as true.
- Checkable: passes — It can be checked against evidence.
- Load-bearing: unclear — It is unclear whether the paper’s conclusions depend on it.
- Based: passes — The paper gives a reason why it holds.
It may state two separate claims as one.
The paper relies on this without support.
The standard practice of reporting accuracy aggregated over test facts with over-represented entities allows LP methods to exhibit good performance by attending only to structural properties involving those entities, while ignoring the remaining majority of the KG.
“One aspect that is common to the vast majority of papers in this area, but nevertheless also problematic, is that they report results aggregated over a large number of test facts in which few entities are over-represented. As a result, LP methods can exhibit good performance on these benchmarks by attending only to such entities while ignoring the others.”
The paper relies on this without support.
The strengths, weaknesses and limitations of current LP techniques are still unknown; the circumstances allowing models to perform better have been hardly investigated.
“the strengths, weaknesses and limitations of the current techniques are still unknown, that is, the circumstances allowing models to perform better have been hardly investigated.”
The paper relies on this without support.
It is still unknown what makes a fact easy or hard to learn and predict.
“Roughly speaking, we still do not really know what makes a fact easy or hard to learn and predict.”
The paper relies on this without support.
Insufficient attention has been paid to the effect of various design choices in embedding-based LP methods.
“Despite the fast growing literature in the subject, insufficient attention has been paid to the effect of the various design choices in those methods.”
The paper relies on this without support.
Embedding-based LP methods have achieved very promising performances in some benchmarks.
“Among the recent LP techniques, those based on KG embeddings have achieved very promising performances in some benchmarks.”
The paper relies on this without support.
The 5 datasets used in the analysis are the best-established datasets in the LP field.
“We conduct our analysis using the 5 best-established datasets in the LP field; we report some of their most important properties in Table 2.”
The paper relies on this without support.
MRR is a very stable metric, while simple MR tends to be highly sensitive to outliers.
“Similarly, we choose MRR because is a very stable metric, while simple MR tends to be highly sensitive to outliers.”
The authors state this as an assumption.
In the very unlikely event that the target entity is not included in the full ranking, all entities that have not been predicted have identical score 0, and the avg policy for ties is applied.
“In this very unlikely event, we assume that all the entities that have not been predicted have identical score 0, and we apply the avg policy for ties.”
The paper relies on this without support.
The authors of a model usually define the space of acceptable values of each hyperparameter, and then run grid or random search to find the best performing combination.
“The authors of a model usually define the space of acceptable values of each hyperparameter, and then run grid or random search to find the best performing combination.”
The paper relies on this without support.
TransE, STransE, and CrossE are naturally inclined to represent symmetric relations with very small vectors in the embedding space.
“TransE, STransE and CrossE are naturally inclined to represent symmetric relations with very small vectors in the embedding space:”
The paper relies on this without support.
In their original implementations, ConvKB and CapsE use min policy by default, whereas CrossE uses ordinal policy by default.
“Note that in their original implementations ConvKB and CapsE use min policy by default, whereas CrossE uses ordinal policy by default.”
The paper relies on this without support.
Tie policies are today treated as almost negligible implementation details, and they are hardly ever even reported when presenting novel LP models.
“As a matter of fact, such policies are today treated as almost negligible implementation details, and they are hardly ever even reported when presenting novel LP models.”
The paper relies on this without support.
Due to the S2C transformation, original reified relations tend to generate a high number of facts containing symmetric relations.
“due to the very nature of the S2C transformation, original reified relations tend to generate a high number of facts containing symmetric relations.”
The paper relies on this without support.
This work is the first extensive comparative analysis on LP models based on KG embedding.
“we have presented the first extensive comparative analysis on LP models based on KG embedding.”
The paper relies on this without support.
The five datasets used are the most popular in the literature.
“the 5 most popular datasets in literature”
Claims other papers make about this one
Each is checked against this paper’s own text: does it say what the citing paper says it does?
The cited source doesn’t support the claim as written.
In the citing paper
“However, there is no overall classification and summary of the KGE models proposed in recent years in this paper, and the selected models are few, which cannot cover all types of KGE models.”
From A Survey on Knowledge Graph Embeddings for Link Prediction (2021) · cites this paper as [28]
Checked by a reasoning model — may be wrong.
Experimental — accuracy not yet measuredThe source backs part of the claim, not all of it — or backs it for a different population, condition or comparison.
In the citing paper
“In addition, the experiment of this survey was not reproduced in a unified environment configuration but used different coding frameworks, such as Python and C++.”
From A Survey on Knowledge Graph Embeddings for Link Prediction (2021) · cites this paper as [28]
Experimental — accuracy not yet measuredThe source backs part of the claim, not all of it — or backs it for a different population, condition or comparison.
In the citing paper
“The embedding vectors contain rich information about entities and relationships and learned embeddings can be used in tasks such as entity classification and link prediction/ knowledge graph completion [97].”
From Scholarly knowledge graphs through structuring scholarly communication: a review (2023) · cites this paper as [97]
Experimental — accuracy not yet measuredThe cited source says what the claim attributes to it.
In the citing paper
“Rossi et al. [28] classified models into three categories: tensor decomposition models, geometric models and deep learning models.”
From A Survey on Knowledge Graph Embeddings for Link Prediction (2021) · cites this paper as [28]
The cited source says what the claim attributes to it.
In the citing paper
“Tensor decomposition has been effective for KGC methods because it is light weighted and easy to train [Rossi et al., 2021].”
From Temporal Knowledge Graph Completion: A Survey (2023) · cites this paper as Rossi et al., 2021
Self-check
Percentages, sums and reported differences re-computed from the paper’s own numbers.
Each contradiction between two passages listed here was confirmed by an independent check.
Rated major: it would touch a result — a value a result rests on, reported and recomputed p-values on opposite sides of the significance level, two passages that conflict with no sign which is right, or a cited work retracted before this paper was published.
In the paper
§ 5.4 Reified Relation Degree · p. 32
“| | min | 52.86 | 40.83 | 324 | 0.211”
§ 2 THE LINK PREDICTION PROBLEM · p. 5
“Hits@K (H@K). It is the ratio of predictions for which the rank is equal or lesser than a threshold 𝐾 :”
Rated minor: it would not touch a result — a value no result rests on, a p-value that stays on the same side of the significance level, or a conflict that is clerical, resolved elsewhere in the paper, or outside its own findings.
In the paper
§ 4.3.1 Number of Peers. · p. 16
“the RPS for 〈 Harry , works\_in , Canada 〉 is the cosine-similarity with the vector of nationality , and it measures 0.447214.”
§ 4.3.1 Number of Peers. · p. 15
“For each 𝑞 we compute 𝑅𝑃𝑆 as the cosine-similarity between its TF-IDF vector and the TD-IDF vector of its relation 𝑟 𝑞”
Rated minor: it would not touch a result — a value no result rests on, a p-value that stays on the same side of the significance level, or a conflict that is clerical, resolved elsewhere in the paper, or outside its own findings.
In the paper
§ 5.4 Reified Relation Degree · p. 32
“In the obtained results all discrepancies between min and average policies disappear.”
§ 5.4 Reified Relation Degree · p. 32
“| CrossE without sigmoid | avg | 60.16 | 86.23 | 50 | 0.703 | 73.28 | 95.05 | 320 | 0.834 | 21.21 | 47.05 | 223 | 0.298 | 38.07 | 44.99 | 4927 | 0.405 33.40 | | 65.45 | 1316 | 0.446”
Citations
Cites
Gradient-based learning applied to document recognition
Lecun, Y., Bottou, L., Bengio, Y., & Haffner, P. (1998) · Proceedings of the IEEE · doi:10.1109/5.726791 · Cited by 58,805 · cited 1×
“ese models use one or multiple convolutional layers [33]: each of these layers performs convolution on the input data (e.”
MethodEfficient Estimation of Word Representations in Vector Space
Mikolov, T., Chen, K., Corrado, G., & Dean, J. (2013) · arXiv · doi:10.48550/arxiv.1301.3781 · Cited by 26,568
Neural networks and physical systems with emergent collective computational abilities.
Hopfield, J. J. (1982) · Proceedings of the National Academy of Sciences · doi:10.1073/pnas.79.8.2554 · Cited by 19,270
Introduction to Information Retrieval
Manning, C. D., Raghavan, P., & Schütze, H. (2008) · doi:10.1017/cbo9780511809071 · Cited by 11,288
Tensor Decompositions and Applications
Kolda, T. G., & Bader, B. W. (2009) · SIAM Review · doi:10.1137/07070111x · Cited by 10,624 · cited 1×
“Models in this family interpret LP as a task of tensor decomposition [28].”
BackgroundFreebase: a collaboratively created graph database for structuring human knowledge
Bollacker, K., Evans, C., Paritosh, P., Sturge, T., & Taylor, J. (2008) · Proceedings of the 2008 ACM SIGMOD international conference on Management of data · doi:10.1145/1376616.1376746 · Cited by 4,852 · cited 1×
“Examples of notable KGs are FreeBase [7], WikiData [62], DBPedia [4], Yago [54] and – in industry – Google KG [52], Microso Satori [48] and Facebook Graph Search [53].”
BackgroundDynamic Routing Between Capsules
Sabour, S., Frosst, N., & Hinton, G. E. (2017) · arXiv · doi:10.48550/arxiv.1710.09829 · Cited by 4,167
Knowledge Graph Embedding by Translating on Hyperplanes
Wang, Z., Zhang, J., Feng, J., & Chen, Z. (2014) · Proceedings of the AAAI Conference on Artificial Intelligence · doi:10.1609/aaai.v28i1.8870 · Cited by 3,915
Vrandečić, D., & Krötzsch, M. (2014) · Communications of the ACM · doi:10.1145/2629489 · Cited by 3,367 · cited 1×
“Examples of notable KGs are FreeBase [7], WikiData [62], DBPedia [4], Yago [54] and – in industry – Google KG [52], Microso Satori [48] and Facebook Graph Search [53].”
BackgroundProceedings of the International Joint Conference on Artificial Intelligence 2007
Bundy, A. (2007) · International Joint Conference on Artificial Intelligence · Cited by 2,761
Research works printed but not linked: 32
- Costabello Luca, 2019, Rory McGrath, Nicholas McCarthy, and Pedro Tabacof.
- Dettmers Tim, 2018, Proceedings of the 32nd AAAI Conference on Artificial Intelligence.
- Ebisu Takuma, 2018, Proceedings of the 2018 AAAI Conference on Artificial Intelligence.
- Efron Bradley, 1994, Tibshirani
- Research Facebook, 2019, Retrieved
- Fatemi Bahare, 2019, Retrieved
- Gesese Genet Asefa, 2019, Proceedings of the 2019 Workshop on Deep Learning for Knowledge Graphs.
- Guo Lingbing, 2019, Proceedings of the 2019 International Conference on Machine Learning.
- Guo Shu, 2018, Proceedings of the 2018 AAAI Conference on Artificial Intelligence.
- Gutiérrez-Basulto Víctor, 2018, Proceedings of the 2018 International Conference on Principles of Knowledge Representation and Reasoning.
- Kazemi Seyed Mehran, 2018, Proceedings of the 2018 International Conference on Neural Information Processing Systems.
- Kostadinov Simeon, Recurrent Neural Networks with Python Quick Start Guide: Sequential Learning and Language Modeling with TensorFlow
- Lacroix Timothée, 2018, Proceedings of the 2018 International Conference on Machine Learning.
- Lao Ni, Proceedings of the 2011 Conference on Empirical Methods in Natural Language Processing.
- Liu Hanxiao, 2017, Proceedings of the 2017 International Conference on Machine Learning.
- Mahdisoltani Farzaneh, Proceedings of the 7th Biennial Conference on Innovative Data Systems Research.
- Meilicke Christian, 2020, Manuel Fink, and Heiner Stuckenschmidt.
- Mikolov Tomas, 2013, Proceedings of the 2013 International Conference on Learning Representations.
- Mohamed Sameh K., 2019, Proceedings of the 2019 Workshop on Deep Learning for Knowledge Graphs.
- Nguyen Dai Quoc, Proceedings of the 2019 Conference of the North American Chapter of the Association for Computational Linguistics: Human Language Technologies.
- Nickel Maximilian, 2011, Proceedings of the 2011 International Conference on Machine Learning.
- Nickel Maximilian, Proceedings of the 2016 AAAI Conference on Artificial Intelligence.
- Rossi Andrea, 2020, Proceedings of the EDBT/ICDT 2020 Joint Conference.
- Sun Zhiqing, 2019, Proceedings of the International Conference on Learning Representations.
- Tran Hung Nghiep, 2019, Proceedings of the EDBT/ICDT 2019 Joint Conference.
- Trouillon Théo, 2016, Proceedings of the 2016 International Conference on Machine Learning.
- University Mannheim, 2019, Data and Web Science Group. [n.d.]. AnyBURL. Retrieved
- Vashishth Shikhar, Proceedings of the 2020 AAAI Conference on Artificial Intelligence.
- Voorhees Ellen M., 1999, Proceedings of the Text REtrieval Conference.
- Wang Zhen, 2014, Proceedings of the 2014 AAAI Conference on Artificial Intelligence.
- Wen Jianfeng, 2016, Proceedings of the 2016 International Joint Conference on Artificial Intelligence.
- Yang Bishan, 2015, Proceedings of the 2015 International Conference on Learning Representations.
Cited by
Sorted by citations
Knowledge Graphs: Opportunities and Challenges
Peng, C., Xia, F., Naseriparsa, M., & Osborne, F. (2023) · Artificial Intelligence Review · doi:10.1007/s10462-023-10465-9 · Cited by 717
“The three main types of triplet fact-based knowledge graph embedding approaches are tensor factorization-based, translation-based, and neural network-based methods (Rossi et al. 2021).”
BackgroundUtilizing graph machine learning within drug discovery and development
Gaudelet, T., Day, B., Jamasb, A. R., Soman, J., Regep, C., Liu, G., Hayter, J. B. R., Vickers, R., Roberts, C., Tang, J., et al. (2021) · Briefings in Bioinformatics · doi:10.1093/bib/bbab159 · Cited by 313
LLMs for knowledge graph construction and reasoning: recent capabilities and future opportunities
Zhu, Y., Wang, X., Chen, J., Qiao, S., Ou, Y., Yao, Y., Deng, S., Chen, H., & Zhang, N. (2024) · World Wide Web · doi:10.1007/s11280-024-01297-w · Cited by 294
“On the other hand, KG reasoning, often referred to as Link Prediction (LP), plays an essential role in making sense of these constructed KGs (Zhang et al., 2018; Rossi et al., 2021).”
Multi-Modal Knowledge Graph Construction and Application: A Survey
Zhu, X., Li, Z., Wang, X., Jiang, X., Sun, P., Wang, X., Xiao, Y., & Yuan, N. J. (2022) · IEEE Transactions on Knowledge and Data Engineering · doi:10.1109/tkde.2022.3224228 · Cited by 353
“Then in the prediction stage, the most matching h in (?, r, t) is found by ranking all candidate head entities h∗ according to a score function like argmaxh∗ φ(h ∗, r, t), where the score function is diverse in different embedding models [154].”
BackgroundA benchmarking study of embedding-based entity alignment for knowledge graphs
Sun, Z., Zhang, Q., Hu, W. P., Wang, C., Chen, M., Akrami, F., & Li, C. (2020) · Proceedings of the VLDB Endowment · doi:10.14778/3407790.3407828 · Cited by 304
Metadata
- Authors
- Rossi, A., Barbosa, D., Firmani, D., Matinata, A., & Merialdo, P.
- Affiliations
- Roma Tre University (IT)
- University of Alberta (CA)
- Roma Tre University, Rome, Italy
- Venue
- ACM Transactions on Knowledge Discovery from Data
- Published
- 2021-01-04
- Volume
- 15
- Issue
- 2
- Pages
- 1-49
- ISSN
- 1556-4681 (ISSN-L)
- 1556-472X
- OpenAlex
- W3120491054
- Cited by
- 601
- References
- 46
- Citations by year
- 2026: 48 · 2025: 107 · 2024: 122 · 2023: 139 · 2022: 117 · 2021: 55
- FWCI
- 37.66
- Type
- journal article
- Language
- en
- Open access
- green
- arxiv.org
- Locations
- ACM Transactions on Knowledge Discovery from Data (publishedVersion)
- arXiv (Cornell University) (submittedVersion)
- IRIS Research product catalog (Sapienza University of Rome) (submittedVersion, other-oa)
- Iris (Roma Tre University) (submittedVersion)
- arXiv (Cornell University)
- Topics
- Physical Sciences › Computer Science › Artificial Intelligence › Advanced Graph Neural Networks
- Physical Sciences › Computer Science › Artificial Intelligence › Topic Modeling
- Physical Sciences › Computer Science › Information Systems › Recommender Systems and Techniques
- Keywords
- knowledge graph embedding, link prediction, knowledge graph incompleteness, method comparison, evaluation benchmark
About these checks
Registry, retraction, Cites and statistics results are computed, not judged, with one exception: a printed reference that no index lists is read once by a model before it counts as a citation error. Claims are extracted by a model and kept only when their quote appears verbatim in the text; each cited source is then checked, with a model’s help, for whether it says what the claim relies on. Those verdicts can be wrong — read the claim’s quote and the cited source before relying on one.
A language model drew the claims from the paper on 2026-10-23, under version 3 of the claim definition (model deepseek-v4.1-flash, prompt extract-v3).
A second model labelled each claim on 2026-10-23 (model jev-1.13-20260917, definition revision gold-guideline-v0.2).
Cited sources are checked with a language model’s help (gpt-6-sol).
Statistics and arithmetic are recomputed, not judged.
Confidence bands are shown only for fields calibrated on our annotated test set. None is calibrated yet, so no band is shown.
What counts as a claim ›How we measure confidence ›How we check this ›
Are you an author, or do you see a problem with this page? Request a review
