

The DOI matches its Crossref record; 42 of the 42 references it cites were found in a registry or an index.
Oxidative stress and altered lipid homeostasis in the programming of offspring fatty liver by maternal obesity
Open accessAbstract
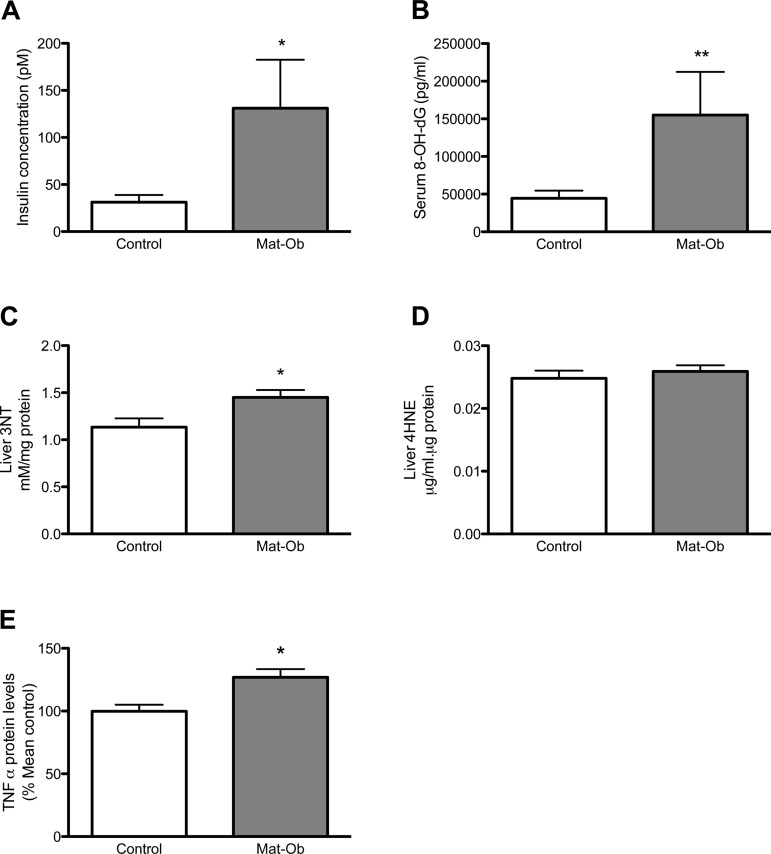
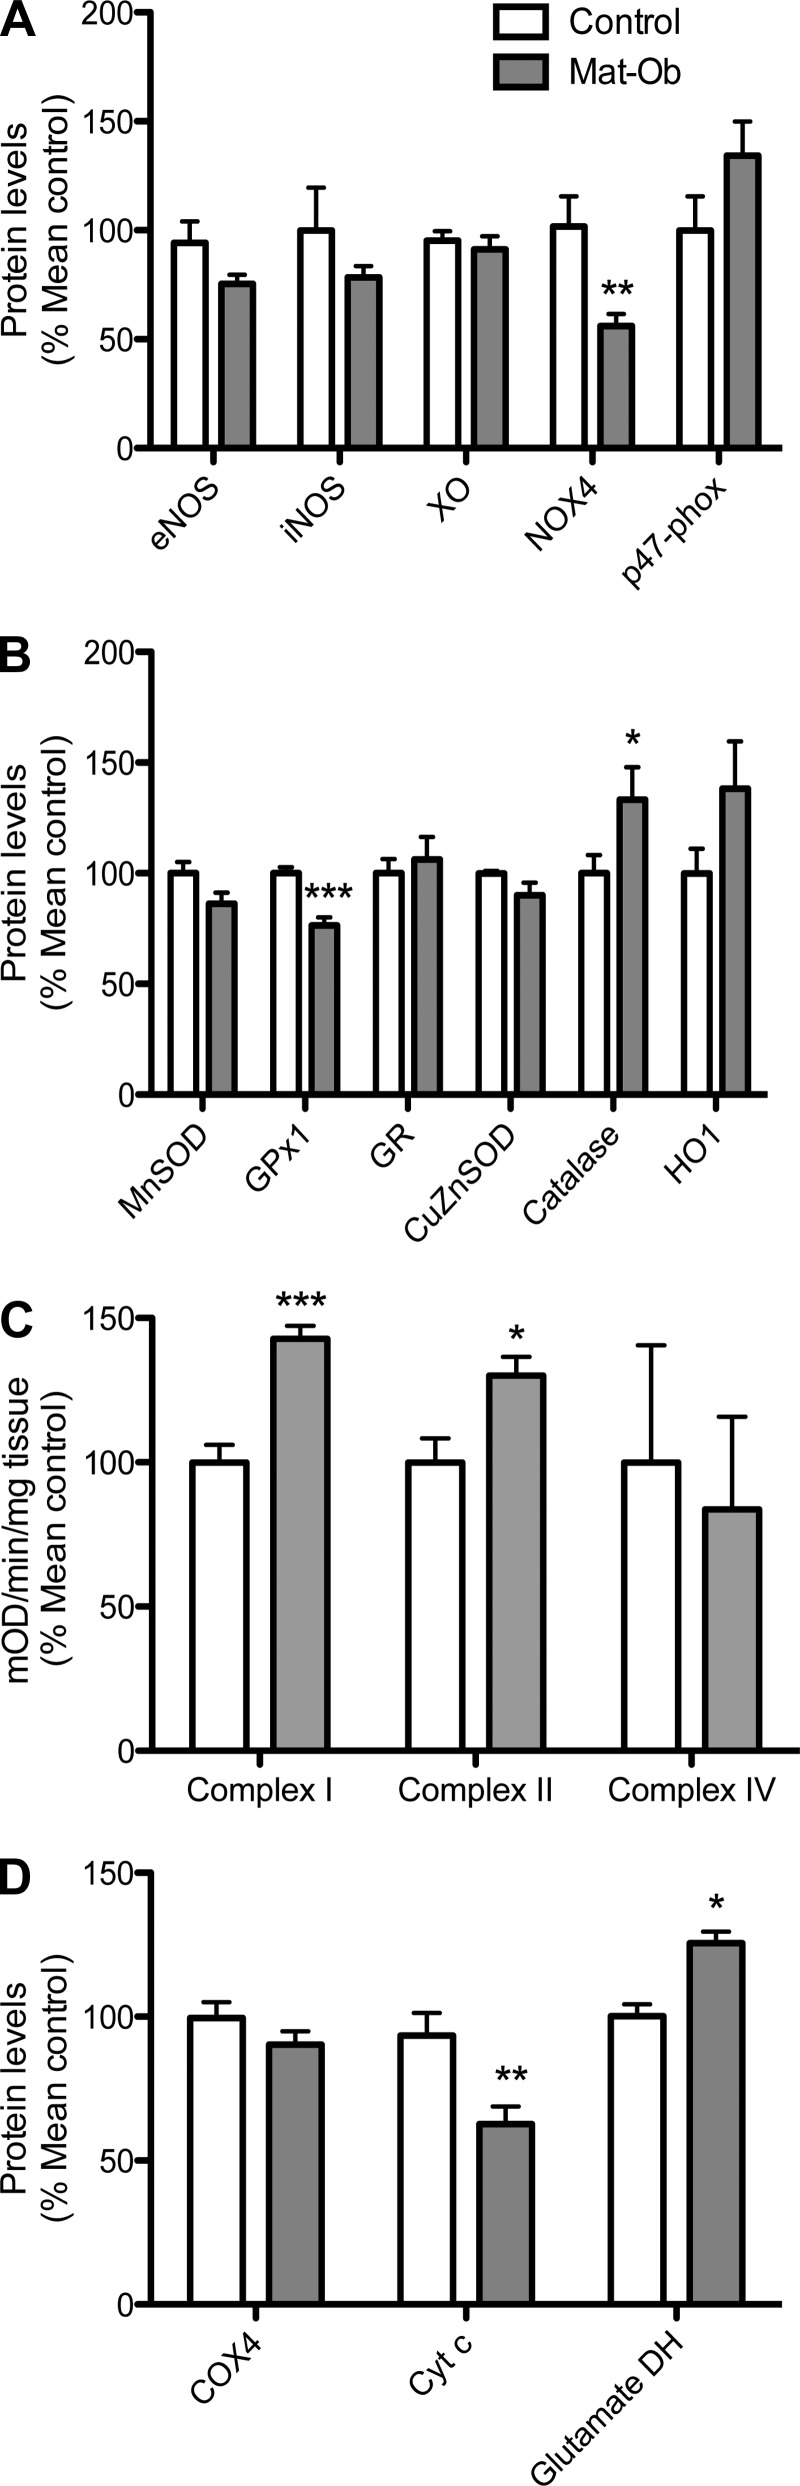
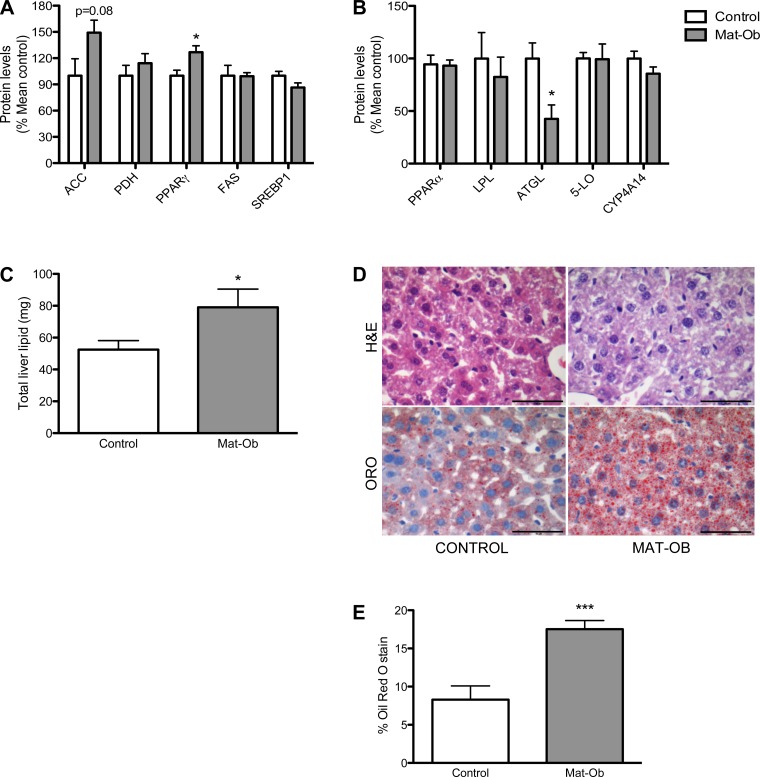
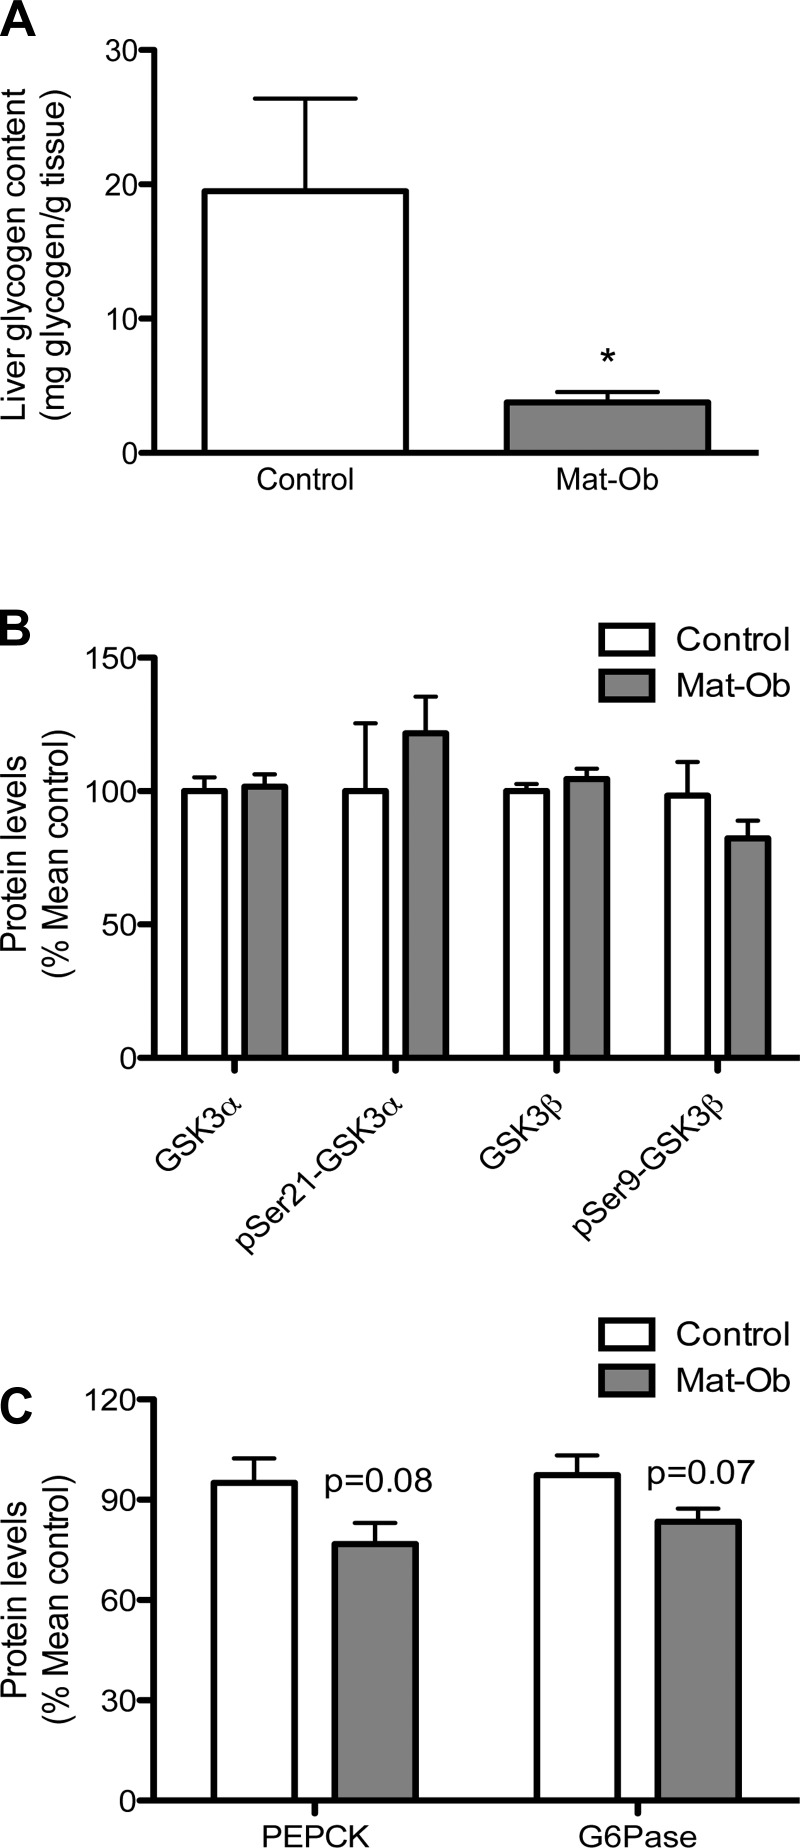
Changes in the maternal nutritional environment during fetal development can influence offspring's metabolic risk in later life. Animal models have demonstrated that offspring of diet-induced obese dams develop metabolic complications, including nonalcoholic fatty liver disease. In this study we investigated the mechanisms in young offspring that lead to the development of nonalcoholic fatty liver disease (NAFLD). Female offspring of C57BL/6J dams fed either a control or obesogenic diet were studied at 8 wk of age. We investigated the roles of oxidative stress and lipid metabolism in contributing to fatty liver in offspring. There were no differences in body weight or adiposity at 8 wk of age; however, offspring of obese dams were hyperinsulinemic. Oxidative damage markers were significantly increased in their livers, with reduced levels of the antioxidant enzyme glutathione peroxidase-1. Mitochondrial complex I and II activities were elevated, while levels of mitochondrial cytochrome c were significantly reduced and glutamate dehydrogenase was significantly increased, suggesting mitochondrial dysfunction. Offspring of obese dams also had significantly greater hepatic lipid content, associated with increased levels of PPARγ and reduced triglyceride lipase. Liver glycogen and protein content were concomitantly reduced in offspring of obese dams. In conclusion, offspring of diet-induced obese dams have disrupted liver metabolism and develop NAFLD prior to any differences in body weight or body composition. Oxidative stress may play a mechanistic role in the progression of fatty liver in these offspring.
Overview
The claims and statistics of this paper haven’t been checked yet.
Run the check — free, no account needed. It reads the open-access text and checks the sources it cites.
Integrity signals
Registry
Cites
Statistics
Figures
Verification
Claims the paper makes
The claims and statistics of this paper haven’t been checked yet.
Run the check — free, no account needed. It reads the open-access text and checks the sources it cites.
Claims other papers make about this one
Each is checked against this paper’s own text: does it say what the citing paper says it does?
The source backs part of the claim, not all of it — or backs it for a different population, condition or comparison.
In the citing paper
“It is evident that the distribution of adipose tissue depends on sex and environmental factors, such as exposure to maternal obesity in utero, which can modify its programming as it does for all other tissues [80,81].”
From Maternal Overnutrition and Fetal Programming: Long-Term Metabolic, Cognitive, and Epigenetic Consequences (2026) · cites this paper as [80]
Experimental — accuracy not yet measuredThe source backs part of the claim, not all of it — or backs it for a different population, condition or comparison.
In the citing paper
“The results of this study highlight how maternal obesity led to profound changes in the offspring’s liver histology and physiology; histological analysis shows an increase in hepatic lipid content compared to control subjects. Plasma analysis showed a decrease in HDL cholesterol, an increase in fasting insulin, TNF-α and DNA oxidative damage markers and hepatic protein oxidation.”
From Maternal Overnutrition and Fetal Programming: Long-Term Metabolic, Cognitive, and Epigenetic Consequences (2026) · cites this paper as [80]
Experimental — accuracy not yet measuredThe source backs part of the claim, not all of it — or backs it for a different population, condition or comparison.
In the citing paper
“Also, variations in protein expression involved in oxidative stress homeostasis were found, including reduced expression of NADPH oxidase and glutathione peroxidase, an increase in catalase and a decrease in protein levels involved in lipogenesis and lipolysis; in particular, an increase in PPARγ expression was discovered.”
From Maternal Overnutrition and Fetal Programming: Long-Term Metabolic, Cognitive, and Epigenetic Consequences (2026) · cites this paper as [80]
Experimental — accuracy not yet measuredThe cited source says what the claim attributes to it.
In the citing paper
“Regarding mitochondrial damage, there was an increase in the activity of complexes I and II and a significant reduction in cytochrome C expression [80,81].”
From Maternal Overnutrition and Fetal Programming: Long-Term Metabolic, Cognitive, and Epigenetic Consequences (2026) · cites this paper as [80]
The cited source says what the claim attributes to it.
In the citing paper
“a number of studies showed that maternal obesity induced greater adiposity and obesity [95,96,97,98] as well as hepatic steatosis [95,96,99] in the offspring.”
From Recent Experimental Studies of Maternal Obesity, Diabetes during Pregnancy and the Developmental Origins of Cardiovascular Disease (2022) · cites this paper as [99]
The check wasn’t confident either way, so it gives no verdict — never disputed.
In the citing paper
“at birth, fat mass accounts for approximately 15% of neonatal body weight, and sexually dimorphic differences in body composition are already present.”
From Maternal Overnutrition and Fetal Programming: Long-Term Metabolic, Cognitive, and Epigenetic Consequences (2026) · cites this paper as [80]
Experimental — accuracy not yet measuredThe check wasn’t confident either way, so it gives no verdict — never disputed.
In the citing paper
“Adipose tissue develops prenatally, with marked expansion during the third trimester of pregnancy; at birth, fat mass accounts for approximately 15% of neonatal body weight, and sexually dimorphic differences in body composition are already present.”
From Maternal Overnutrition and Fetal Programming: Long-Term Metabolic, Cognitive, and Epigenetic Consequences (2026) · cites this paper as [80]
Experimental — accuracy not yet measured
Self-check
Percentages, sums and reported differences re-computed from the paper’s own numbers.
The self-check needs the paper’s full text.
Citations
Cites
A SIMPLE METHOD FOR THE ISOLATION AND PURIFICATION OF TOTAL LIPIDES FROM ANIMAL TISSUES
Folch, J., Lees, M., & Stanley, G. H. S. (1957) · Journal of Biological Chemistry · doi:10.1016/s0021-9258(18)64849-5 · Cited by 65,189
Increased oxidative stress in obesity and its impact on metabolic syndrome
Furukawa, S., Fujita, T., Shimabukuro, M., Iwaki, M., Yamada, Y., Nakajima, Y., Nakayama, O., Makishima, M., Matsuda, M., & Shimomura, I. (2004) · Journal of Clinical Investigation · doi:10.1172/jci21625 · Cited by 5,508
Steatohepatitis: A tale of two “hits”?
Day, C. P., & James, O. F. W. (1998) · Gastroenterology · doi:10.1016/s0016-5085(98)70599-2 · Cited by 4,285
Hotamisligil, G. S., Arner, P., Caro, J. F., Atkinson, R. L., & Spiegelman, B. M. (1995) · Journal of Clinical Investigation · doi:10.1172/jci117936 · Cited by 3,543
Nonalcoholic Fatty Liver Disease
Marchesini, G., Brizi, M., Bianchi, G., Tomassetti, S., Bugianesi, E., Lenzi, M., McCullough, A. J., Natale, S., Forlani, G., & Melchionda, N. (2001) · Diabetes · doi:10.2337/diabetes.50.8.1844 · Cited by 2,581
Boney, C. M., Verma, A., Tucker, R., & Vohr, B. R. (2005) · Pediatrics · doi:10.1542/peds.2004-1808 · Cited by 2,303
Defective lipolysis and altered energy metabolism in mice lacking adipose triglyceride lipase
Haemmerle, G., Lass, A., Zimmermann, R., Gorkiewicz, G., Meyer, C., Rozman, J., Heldmaier, G., Maier, R., Theussl, C., Eder, S., et al. (2006) · Science · doi:10.1126/science.1123965 · Cited by 1,375
Vidal‐Puig, A., Considine, R. V., Jimenez‐Liñan, M., Werman, A., Pories, W. J., Caro, J. F., & Flier, J. S. (1997) · Journal of Clinical Investigation · doi:10.1172/jci119424 · Cited by 785
The Epidemiology of Nonalcoholic Fatty Liver Disease: A Global Perspective
Lazo, M., & Clark, J. M. (2008) · Seminars in Liver Disease · doi:10.1055/s-0028-1091978 · Cited by 744
Recent insights into hepatic lipid metabolism in non-alcoholic fatty liver disease (NAFLD)
Musso, G., Gambino, R. J., & Cassader, M. (2008) · Progress in Lipid Research · doi:10.1016/j.plipres.2008.08.001 · Cited by 691
Research works printed but not linked: 2
- Dandona P, 2001, J Clin Endocrinol Metab, 86, 355
- McCurdy CE, 2009, J Clin Invest, 119, 323
Cited by
Sorted by citations
Silkworm Sericin: Properties and Biomedical Applications
Kunz, R. I., Brancalhão, R. M. C., Ribeiro, L. D. F. C., & Natali, M. R. M. (2016) · BioMed Research International · doi:10.1155/2016/8175701 · Cited by 480
Developmental origins of metabolic diseases
Hoffman, D. J., Powell, T. L., Barrett, E. S., & Hardy, D. B. (2020) · Physiological Reviews · doi:10.1152/physrev.00002.2020 · Cited by 504
Agarwal, P., Morriseau, T. S., Kereliuk, S. M., Doucette, C. A., Wicklow, B. A., & Dolinsky, V. W. (2018) · Critical Reviews in Clinical Laboratory Sciences · doi:10.1080/10408363.2017.1422109 · Cited by 202
A review of fundamental principles for animal models of DOHaD research: an Australian perspective
Dickinson, H., Moss, T. J. M., Gatford, K. L., Moritz, K. M., Akison, L. K., Fullston, T., Hryciw, D. H., Maloney, C., Morris, M. J., Wooldridge, A. L., et al. (2016) · Journal of Developmental Origins of Health and Disease · doi:10.1017/s2040174416000477 · Cited by 109
Lomas‐Soria, C., Reyes‐Castro, L. A., Rodríguez-González, G. L., Ibáñez, C. A., Bautista, C. J., Cox, L. A., Nathanielsz, P. W., & Zambrano, E. (2018) · The Journal of Physiology · doi:10.1113/jp276372 · Cited by 94
Metadata
- Authors
- Alfaradhi, M. Z., Fernandez-Twinn, D. S., Martin-Gronert, M. S., Musial, B., Fowden, A., & Ozanne, S. E.
- Affiliations
- University of Cambridge (GB)
- University of Cambridge Metabolic Research Laboratories, Wellcome Trust-MRC Institute of Metabolic Science, Addenbrooke's Hospital, Cambridge, United Kingdom; and
- Department of Physiology, Development and Neuroscience, Centre for Trophoblast Research, University of Cambridge, Cambridge, United Kingdom
- Corresponding author
- Alfaradhi, Maria Z.
- Venue
- American Journal of Physiology-Regulatory, Integrative and Comparative Physiology
- Publisher
- American Physiological Society
- Published
- 2014-07-01
- Volume
- 307
- Issue
- 1
- Pages
- R26-R34
- ISSN
- 0363-6119 (ISSN-L)
- 1522-1490
- PMC
- PMC4080277
- OpenAlex
- W2128764301
- Cited by
- 136
- References
- 42
- Citations by year
- 2026: 4 · 2025: 7 · 2024: 10 · 2023: 13 · 2022: 13 · 2021: 14 · 2020: 13 · 2019: 7 · 2018: 11 · 2017: 10 · 2016: 16 · 2015: 15 · 2014: 3
- FWCI
- 13.80
- Type
- journal article
- Language
- en
- Open access
- hybrid
- doi.org
- Licence
- cc-by
- Locations
- American Journal of Physiology-Regulatory, Integrative and Comparative Physiology (publishedVersion, cc-by)
- Europe PMC (PubMed Central) (publishedVersion, cc-by)
- PubMed Central (publishedVersion, cc-by)
- PubMed (publishedVersion)
- Funders
- British Heart Foundation (FS/09/029/27902)
- Biotechnology and Biological Sciences Research Council (BB/F015364/1)
- Topics
- Health Sciences › Medicine › Pediatrics, Perinatology and Child Health › Birth, Development, and Health
- Health Sciences › Medicine › Hepatology › Liver Disease Diagnosis and Treatment
- Health Sciences › Medicine › Endocrinology, Diabetes and Metabolism › Diet, Metabolism, and Disease
- Keywords
- non-alcoholic fatty liver disease, maternal obesity, developmental programming, oxidative stress, lipid homeostasis, hyperinsulinemia, glutathione peroxidase 1, mitochondrial dysfunction, PPARγ, hepatic lipase, liver glycogen, obesogenic diet
- MeSH terms
- Glutathione Peroxidase GPX1, Age Factors, Animals, Animal Nutritional Physiological Phenomena, Body Weight, Fatty Liver, Female, Glutamate Dehydrogenase, Glutathione Peroxidase, Glycogen, Homeostasis, Insulin, Lipase, Liver, Mice, Inbred C57BL, Obesity, Phenotype, Pregnancy, Prenatal Exposure Delayed Effects, Risk Factors, Signal Transduction, Oxidative Stress, Prenatal Nutritional Physiological Phenomena, Electron Transport Complex II, Electron Transport Complex I, Cytochromes c, PPAR gamma, Adiposity, Lipid Metabolism, Mice, Non-alcoholic Fatty Liver Disease
About these checks
Registry, retraction, Cites and statistics results are computed, not judged, with one exception: a printed reference that no index lists is read once by a model before it counts as a citation error. Claims are extracted by a model and kept only when their quote appears verbatim in the text; each cited source is then checked, with a model’s help, for whether it says what the claim relies on. Those verdicts can be wrong — read the claim’s quote and the cited source before relying on one.
Statistics and arithmetic are recomputed, not judged.
Confidence bands are shown only for fields calibrated on our annotated test set. None is calibrated yet, so no band is shown.
What counts as a claim ›How we measure confidence ›How we check this ›
Are you an author, or do you see a problem with this page? Request a review
