

The DOI matches its Crossref record; 49 of the 49 references it cites were found in a registry or an index.
miR-155 Regulated Inflammation Response by the SOCS1-STAT3-PDCD4 Axis in Atherogenesis
Open accessAbstract
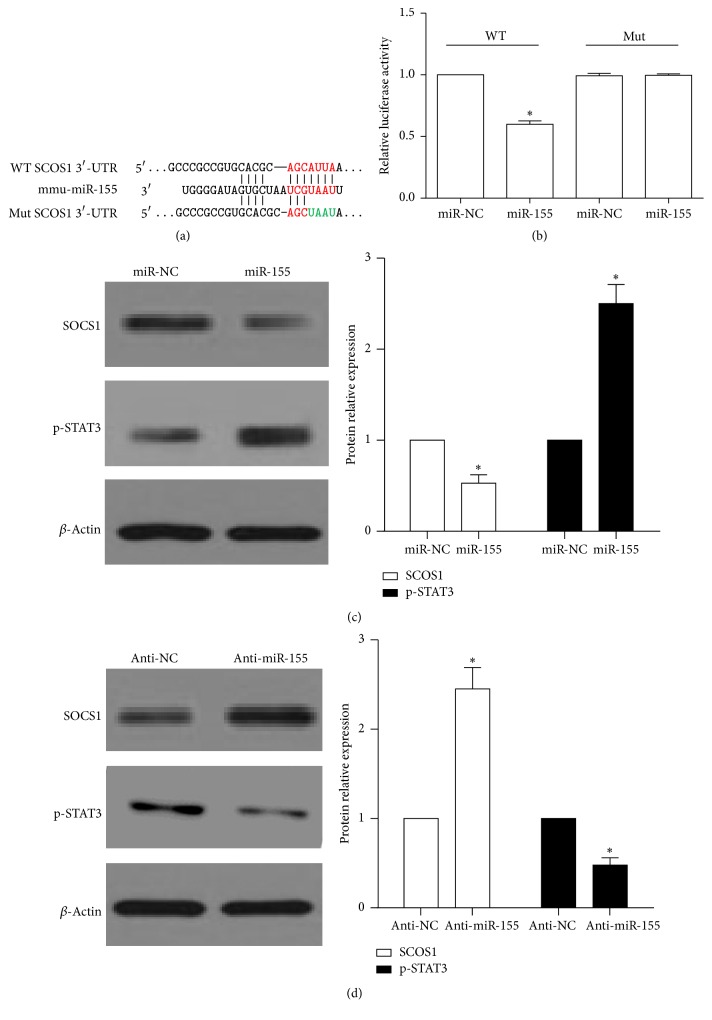
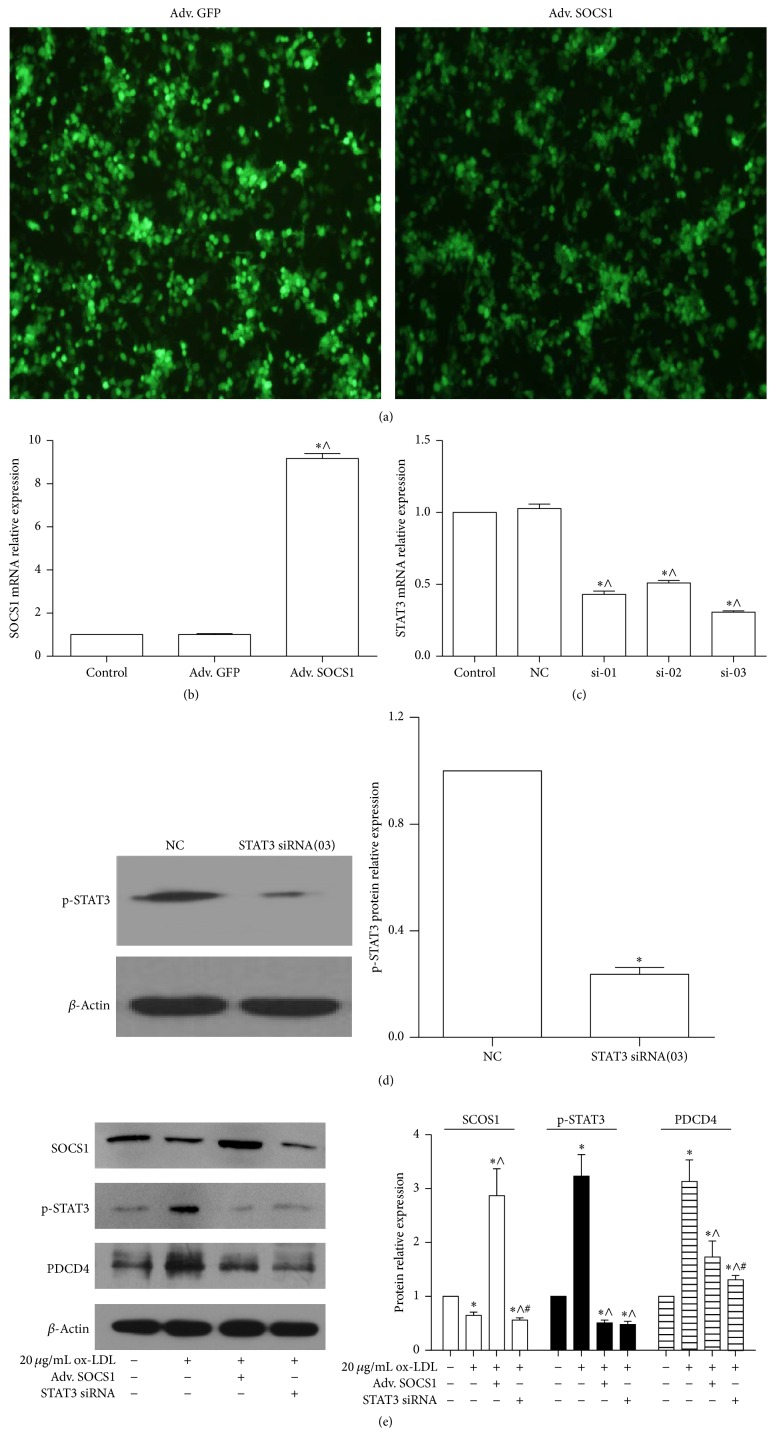
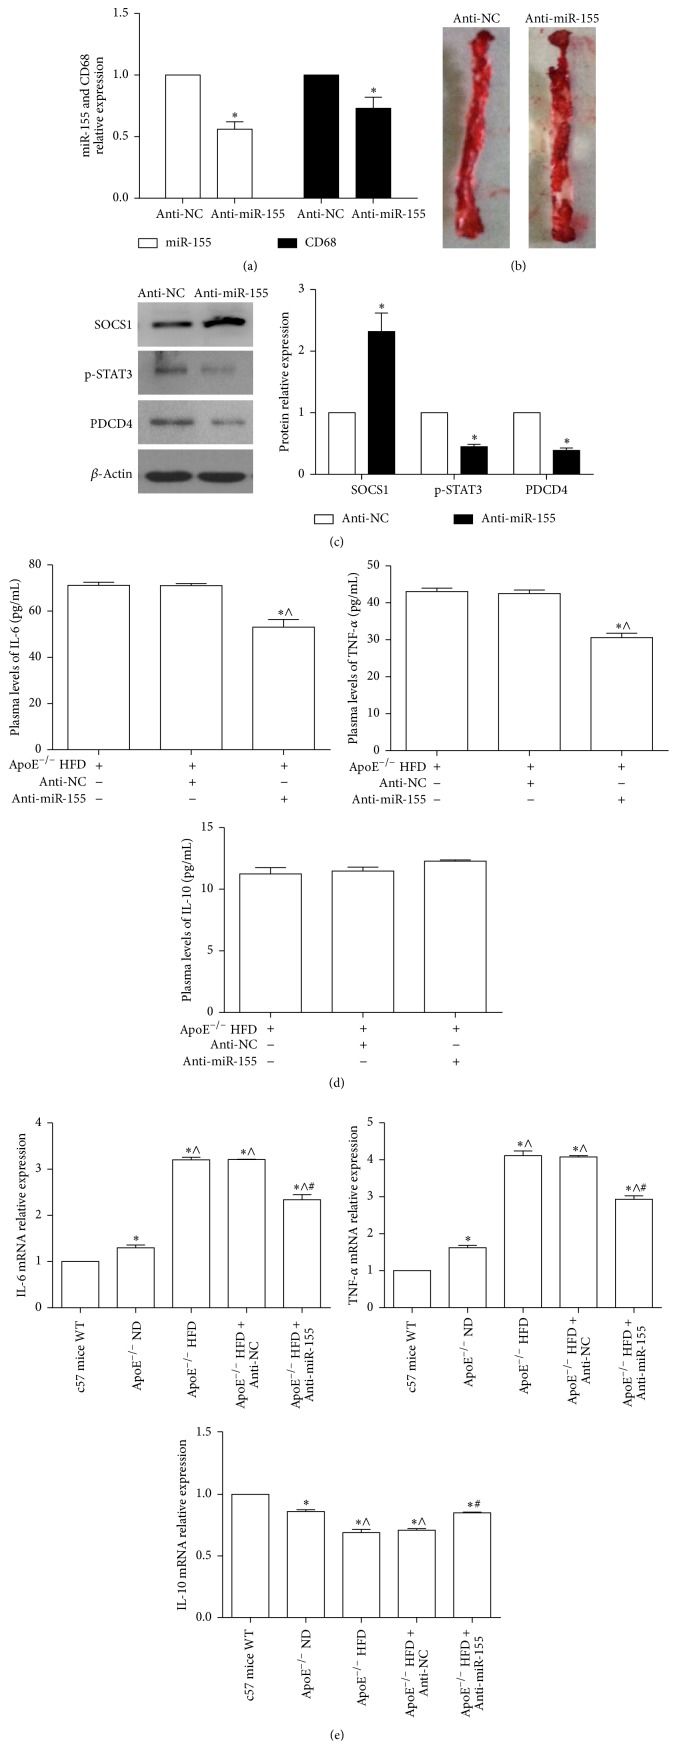
Inflammation response plays a critical role in all phases of atherosclerosis (AS). Increased evidence has demonstrated that miR-155 mediates inflammatory mediators in macrophages to promote plaque formation and rupture. However, the precise mechanism of miR-155 remains unclear in AS. Here, we also found that miR-155 and PDCD4 were elevated in the aortic tissue of atherosclerotic mice and ox-LDL treated RAW264.7 cells. Further studies showed that miR-155 not only directly inhibited SOCS1 expression, but also increased the expression of p-STAT and PDCD4, as well as the production of proinflammation mediators IL-6 and TNF-α. Downregulation of miR-155 and PDCD4 and upregulation of SOCS1 obviously decreased the IL-6 and TNF-α expression. In addition, inhibition of miR-155 levels in atherosclerotic mice could notably reduce the IL-6 and TNF-α level in plasma and aortic tissue, accompanied with increased p-STAT3 and PDCD4 and decreased SOCS1. Thus, miR-155 might mediate the inflammation in AS via the SOCS1-STAT3-PDCD4 axis. These results provide a rationale for intervention of intracellular miR-155 as possible antiatherosclerotic targets.
Overview
The claims and statistics of this paper haven’t been checked yet.
Run the check — free, no account needed. It reads the open-access text and checks the sources it cites.
Integrity signals
Registry
Cites
Statistics
Figures
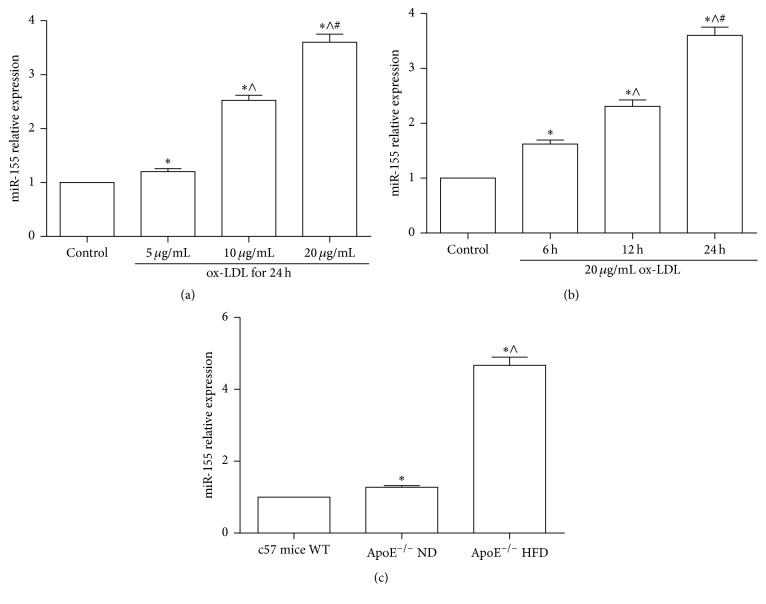
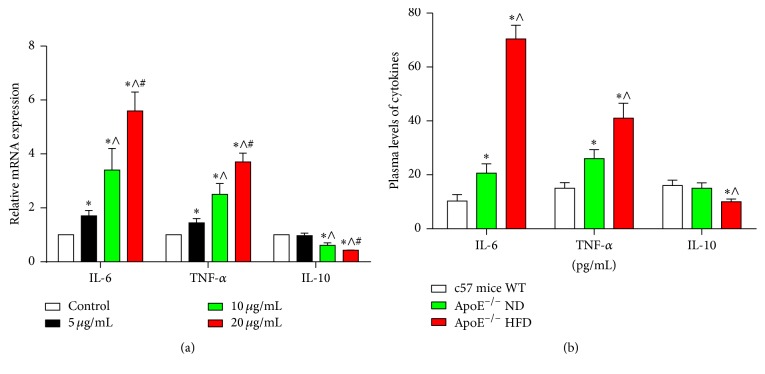
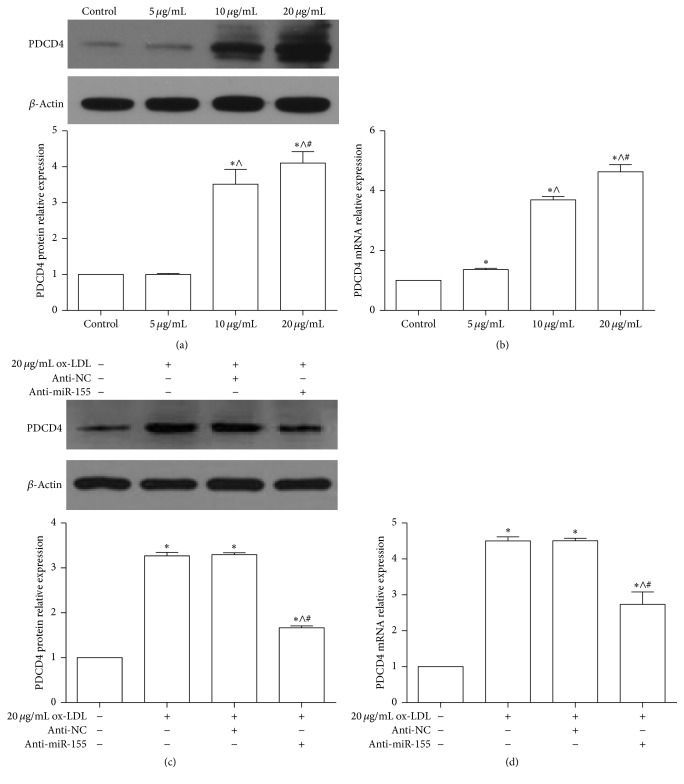
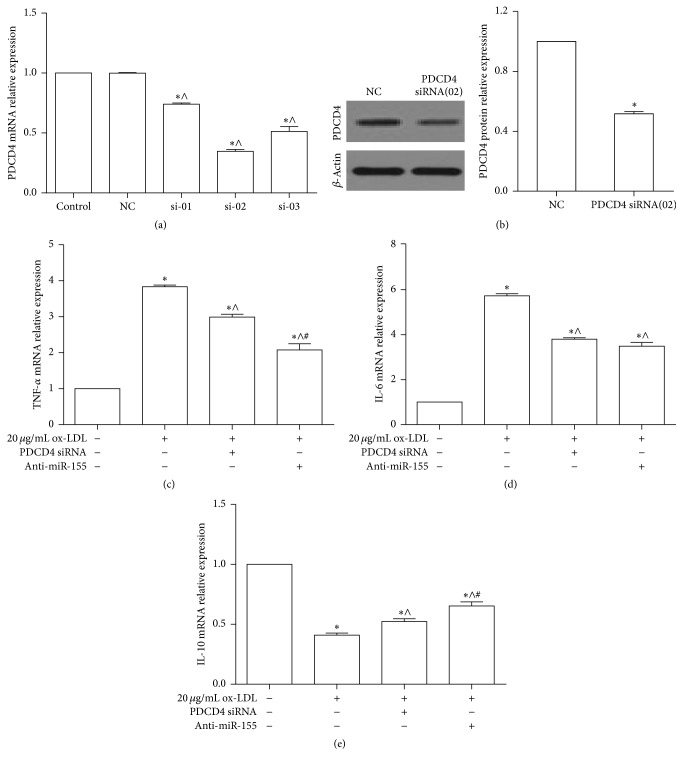
Verification
Claims the paper makes
The claims and statistics of this paper haven’t been checked yet.
Run the check — free, no account needed. It reads the open-access text and checks the sources it cites.
Claims other papers make about this one
Each is checked against this paper’s own text: does it say what the citing paper says it does?
The cited source says what the claim attributes to it.
In the citing paper
“Recently, it was shown that PDCD4 is also an important factor for inflammatory diseases such as asthma [86] and atherosclerosis [87,88].”
From Control Mechanisms of the Tumor Suppressor PDCD4: Expression and Functions (2019) · cites this paper as [88]
Self-check
Percentages, sums and reported differences re-computed from the paper’s own numbers.
The self-check needs the paper’s full text.
Citations
Cites
Cytokines in Atherosclerosis: Pathogenic and Regulatory Pathways
Tedgui, A., & Mallat, Z. (2006) · Physiological Reviews · doi:10.1152/physrev.00024.2005 · Cited by 1,751
Herrington, W. G., Lacey, B., Sherliker, P., Armitage, J., & Lewington, S. (2016) · Circulation Research · doi:10.1161/circresaha.115.307611 · Cited by 1,528
Accumulation of miR-155 and BIC RNA in human B cell lymphomas
Eis, P. S., Tam, W., Sun, L., Chadburn, A., Li, Z., Gomez, M. F., Lund, E., & Dahlberg, J. E. (2005) · Proceedings of the National Academy of Sciences · doi:10.1073/pnas.0500613102 · Cited by 1,322
Pervasive roles of microRNAs in cardiovascular biology
Small, E. M., & Olson, E. N. (2011) · Nature · doi:10.1038/nature09783 · Cited by 1,180
Sheedy, F. J., Palsson-McDermott, E., Hennessy, E. J., Martin, C., O'Leary, J. J., Ruan, Q., Johnson, D. S., Chen, Y., & O'Neill, L. A. J. (2010) · Nature Immunology · doi:10.1038/ni.1828 · Cited by 1,005
Inflammation in Atherosclerosis: Transition From Theory to Practice
Libby, P., Okamoto, Y., Rocha, V. Z., & Folco, E. (2010) · Circulation Journal · doi:10.1253/circj.cj-09-0706 · Cited by 799
Targeting the STAT3 signaling pathway in cancer: Role of synthetic and natural inhibitors
Siveen, K. S., Sikka, S., Surana, R., Dai, X., Zhang, J., Kumar, A. P., Tan, B. K. H., Sethi, G., & Bishayee, A. (2014) · Biochimica et Biophysica Acta (BBA) - Reviews on Cancer · doi:10.1016/j.bbcan.2013.12.005 · Cited by 645
SOCS regulation of the JAK/STAT signalling pathway
Croker, B. A., Kiu, H., & Nicholson, S. E. (2008) · Seminars in Cell and Developmental Biology · doi:10.1016/j.semcdb.2008.07.010 · Cited by 633
Ouimet, M., Ediriweera, H. N., Gundra, U. M., Sheedy, F. J., Ramkhelawon, B., Hutchison, S. B., Rinehold, K., van Solingen, C., Fullerton, M. D., Cecchini, K., et al. (2015) · Journal of Clinical Investigation · doi:10.1172/jci81676 · Cited by 394
Regulation of the MIR155 host gene in physiological and pathological processes
Elton, T. S., Selemon, H., Elton, S. M., & Parinandi, N. L. (2013) · Gene · doi:10.1016/j.gene.2012.12.009 · Cited by 393
Research works printed but not linked: 2
- 10.3892/or-00000838 · DOI
- 2011, Science Signaling, 4
Cited by
Sorted by citations
Macrophage polarization and allergic asthma
Saradna, A., Do, D. C., Kumar, S. A., Fu, Q.-L., & Gao, P. (2017) · Translational research · doi:10.1016/j.trsl.2017.09.002 · Cited by 441
Jain, N., Moeller, J., & Vogel, V. (2019) · Annual Review of Biomedical Engineering · doi:10.1146/annurev-bioeng-062117-121224 · Cited by 237
MicroRNAs in the Pathobiology and Therapy of Atherosclerosis
Laffont, B., & Rayner, K. J. (2017) · Canadian Journal of Cardiology · doi:10.1016/j.cjca.2017.01.001 · Cited by 153
Control Mechanisms of the Tumor Suppressor PDCD4: Expression and Functions
Matsuhashi, S., Manirujjaman, M., Hamajima, H., & Ozaki, I. (2019) · International Journal of Molecular Sciences · doi:10.3390/ijms20092304 · Cited by 143
Yang, L., Sun, J., Liu, Q., Zhu, R., Yang, Q., Hua, J., Zheng, L., Li, K., Wang, S., & Li, A. (2019) · Advanced Science · doi:10.1002/advs.201802012 · Cited by 101
Self-citationTargeting miRNA by CRISPR/Cas in cancer: advantages and challenges
Hussen, B. M., Rasul, M. F., Abdullah, S. R., Hidayat, H. J., Faraj, G. S. H., Ali, F. A., Salihi, A. B., Baniahmad, A., Ghafouri‐Fard, S., Rahman, M., et al. (2023) · Military Medical Research · doi:10.1186/s40779-023-00468-6 · Cited by 106
MicroRNA-155 Implication in M1 Polarization and the Impact in Inflammatory Diseases
Paşca, S., Jurj, A. M., Petrushev, B., Tomuleasa, C., & Matei, D. (2020) · Frontiers in Immunology · doi:10.3389/fimmu.2020.00625 · Cited by 85
miR-155 in the Resolution of Atherosclerosis
Bruen, R., Fitzsimons, S., & Belton, O. (2019) · Frontiers in Pharmacology · doi:10.3389/fphar.2019.00463 · Cited by 84
Woeller, C. F., Roztocil, E., Hammond, C. L., & Feldon, S. E. (2019) · Investigative Ophthalmology & Visual Science · doi:10.1167/iovs.19-27865 · Cited by 71
Doghish, A. S., Abulsoud, A. I., Elshaer, S. S., Abdelmaksoud, N. M., Zaki, M. B., El‐Mahdy, H. A., Ismail, A., Fathi, D., & Elsakka, E. G. E. (2023) · Pathology - Research and Practice · doi:10.1016/j.prp.2023.154363 · Cited by 65
miR-26a inhibits atherosclerosis progression by targeting TRPC3
Feng, M., Xu, D., & Wang, L. (2018) · Cell & Bioscience · doi:10.1186/s13578-018-0203-9 · Cited by 62
JAK2/STAT3 as a new potential target to manage neurodegenerative diseases: An interactive review
Panda, S. P., Kesharwani, A., Datta, S., Prasanth, D., Panda, S. K., & Guru, A. (2024) · European Journal of Pharmacology · doi:10.1016/j.ejphar.2024.176490 · Cited by 61
Promising landscape for regulating macrophage polarization: epigenetic viewpoint
Zhou, D., Yang, K., Chen, L., Zhang, W., Xu, Z., Zuo, J., Jiang, H., & Luan, J. (2017) · Oncotarget · doi:10.18632/oncotarget.17027 · Cited by 64
Pandey, R., Bakay, M. A., & Hakonarson, H. H. (2023) · Frontiers in Immunology · doi:10.3389/fimmu.2023.1271102 · Cited by 59
Su, G., Sun, G., Liu, H., Shu, L., & Liang, Z. (2018) · Heart and Vessels · doi:10.1007/s00380-018-1169-6 · Cited by 59
Varzideh, F., Kansakar, U., Donkor, K., Wilson, S. M., Jankauskas, S. S., Mone, P., Wang, X., Lombardi, A., & Santulli, G. (2022) · Frontiers in Cardiovascular Medicine · doi:10.3389/fcvm.2022.863238 · Cited by 58
Deciphering Non-coding RNAs in Cardiovascular Health and Disease
Das, A., Samidurai, A., & Salloum, F. N. (2018) · Frontiers in Cardiovascular Medicine · doi:10.3389/fcvm.2018.00073 · Cited by 56
MicroRNAs in the cornea: Role and implications for treatment of corneal neovascularization
Mukwaya, A., Jensen, L. D., Peebo, B. B., & Lagali, N. (2019) · The Ocular Surface · doi:10.1016/j.jtos.2019.04.002 · Cited by 56
Wang, S., Ling, Y., Yao, Y., Zheng, G., & Chen, W. (2020) · Virology Journal · doi:10.1186/s12985-020-01451-6 · Cited by 56
Programmed cell death factor 4 (PDCD4), a novel therapy target for metabolic diseases besides cancer
Lu, K., Chen, Q., Li, M., He, L., Riaz, F., Zhang, T., & Li, D. (2020) · Free Radical Biology and Medicine · doi:10.1016/j.freeradbiomed.2020.06.016 · Cited by 53
Lee, Y. Z., Cheng, S.-H., Chang, M.-Y., Lin, Y., Wu, C.-C., & Tsai, Y.-C. (2023) · International Journal of Molecular Sciences · doi:10.3390/ijms24076794 · Cited by 59
Molecular Mechanisms of Immune Regulation: A Review
Arneth, B. M. (2025) · Cells · doi:10.3390/cells14040283 · Cited by 54
The potential role of miRNA in regulating macrophage polarization
Khayati, S., Dehnavi, S., Sadeghi, M., Afshari, J. T., Esmaeili, S., & Mohammadi, M. (2023) · Heliyon · doi:10.1016/j.heliyon.2023.e21615 · Cited by 60
Inhibition of miR‑155‑5p attenuates the valvular damage induced by rheumatic heart disease
Chen, A., Wen, J., Lu, C., Lin, Z., Xian, S., Huang, F., Wu, Y., & Zeng, Z. (2019) · International Journal of Molecular Medicine · doi:10.3892/ijmm.2019.4420 · Cited by 52
Recent progress in immune evasion mechanisms of triple-negative breast cancer
Yang, Y., & Wang, W. (2025) · Journal of Translational Medicine · doi:10.1186/s12967-025-07370-w · Cited by 56
Fitzsimons, S., Oggero, S., Bruen, R., McCarthy, C., Strowitzki, M. J., Mahon, N., Ryan, N., Brennan, E. P., Barry, M. C., Perretti, M., et al. (2020) · Frontiers in Immunology · doi:10.3389/fimmu.2020.576516 · Cited by 51
MicroRNA-155 Promotes Heat Stress-Induced Inflammation via Targeting Liver X Receptor α in Microglia
Li, P., Wang, G., Zhang, X., He, G., Luo, X. G., Yang, J., Luo, Z., Shen, T., & Yang, X. (2019) · Frontiers in Cellular Neuroscience · doi:10.3389/fncel.2019.00012 · Cited by 47
Peng, H., Hsiao, J., Chou, S.-T., Hsu, Y.-M., Wu, G.-H., Shieh, Y., & Shiah, S. (2020) · Neoplasia · doi:10.1016/j.neo.2020.08.005 · Cited by 45
Priéto, I., Kavanagh, M. E., Jiménez-Castilla, L., Pardines, M., Lázaro, I., del Real, I. H., Flores‐Muñoz, M., Egido, J., López‐Franco, Ó., & Gómez‐Guerrero, C. (2023) · Molecular Therapy — Nucleic Acids · doi:10.1016/j.omtn.2023.102041 · Cited by 42
Overexpression of MicroRNA‐16 Alleviates Atherosclerosis by Inhibition of Inflammatory Pathways
Wang, M., Li, J., Cai, J., Cheng, L., Wang, X., Xu, P., Li, G., & Liang, X. (2020) · BioMed Research International · doi:10.1155/2020/8504238 · Cited by 44
The Role of miR-155 in Nutrition: Modulating Cancer-Associated Inflammation
Zănoagă, O., Braicu, C., Chiroi, P. A., Nutu, A. M., Hajjar, N. A., Mărgărit, S., Korban, S. S., & Berindan‐Neagoe, I. (2021) · Nutrients · doi:10.3390/nu13072245 · Cited by 42
Yin, T., Li, Y., Ren, Y., Fuad, A. R. M., Hu, F., Du, R., Wang, Y., Wang, Y., & Wang, Y. (2021) · Journal of Nanobiotechnology · doi:10.1186/s12951-021-00863-y · Cited by 40
MicroRNAs in tumor immunity: functional regulation in tumor-associated macrophages
Chen, C., Liu, J., & Luo, Y. (2019) · Journal of Zhejiang University SCIENCE B · doi:10.1631/jzus.b1900452 · Cited by 41
Guo, Q., Zhang, H., Zhang, B., Zhang, E., & Wu, Y. (2019) · Medical Science Monitor · doi:10.12659/msm.919721 · Cited by 40
Altered expression of microRNAs may predict therapeutic response in rheumatoid arthritis patients
Rezaeepoor, M., Pourjafar, M., Tahamoli‐Roudsari, A., Basiri, Z., Hajilooi, M., & Solgi, G. (2020) · International Immunopharmacology · doi:10.1016/j.intimp.2020.106404 · Cited by 40
DGCR5 attenuates neuropathic pain through sponging miR‐330‐3p and regulating PDCD4 in CCI rat models
Peng, C., Zhang, C., Su, Z., & Lin, D. (2018) · Journal of Cellular Physiology · doi:10.1002/jcp.27487 · Cited by 39
Gupta, V., Hammond, C. L., Roztocil, E., Gonzalez, M. O., Feldon, S. E., & Woeller, C. F. (2021) · Survey of Ophthalmology · doi:10.1016/j.survophthal.2021.08.010 · Cited by 39
Inflammation‐regulatory microRNAs: Valuable targets for intracranial atherosclerosis
Li, J., Li, K., & Chen, X. (2019) · Journal of Neuroscience Research · doi:10.1002/jnr.24487 · Cited by 36
Zheng, J., Duan, H., You, S., Liang, B., Chen, Y., & Huang, H. (2022) · Frontiers in Immunology · doi:10.3389/fimmu.2022.952954 · Cited by 37
SOCS molecules: the growing players in macrophage polarization and function
Zhou, D., Chen, L., Yang, K., Jiang, H., Xu, W., & Luan, J. (2017) · Oncotarget · doi:10.18632/oncotarget.19940 · Cited by 36
miR‐142‐5p and miR‐130a‐3p regulate pulmonary macrophage polarization and asthma airway remodeling
Shi, J., Chen, M., Ouyang, L., Wang, Q., Guo, Y., Huang, L., & Jiang, S. (2020) · Immunology and Cell Biology · doi:10.1111/imcb.12369 · Cited by 35
Li, J., & Zheng, S. J. (2020) · Viruses · doi:10.3390/v12050543 · Cited by 35
Xin, Y., Yuan, Q., Liu, C., Zhang, C., & Yuan, D. (2020) · Scientific Reports · doi:10.1038/s41598-020-75358-1 · Cited by 34
Yu, J., Mei, J., Zuo, D., Zhang, M., Yu, S., Li, F., Wang, J., Bi, D., Ma, S., Wang, J., et al. (2024) · International Immunopharmacology · doi:10.1016/j.intimp.2024.113013 · Cited by 32
Role of microRNA in severe asthma
Maneechotesuwan, K. (2018) · Respiratory Investigation · doi:10.1016/j.resinv.2018.10.005 · Cited by 31
Decoding microRNA drivers in atherosclerosis
Vartak, T., Kumaresan, S., & Brennan, E. P. (2022) · Bioscience Reports · doi:10.1042/bsr20212355 · Cited by 29
Bernal, S., Lopez‐Sanz, L., Jiménez-Castilla, L., Priéto, I., Melgar, A., Manna, S. L., Martı́n-Ventura, J. L., Blanco‐Colio, L. M., Egido, J., & Gómez‐Guerrero, C. (2020) · British Journal of Pharmacology · doi:10.1111/bph.15330 · Cited by 30
Pathogenesis of miR-155 on nonmodifiable and modifiable risk factors in Alzheimer’s disease
Liu, J.-J., Long, Y.-F., Xu, P., Guo, H.-D., & Cui, G.-H. (2023) · Alzheimer s Research & Therapy · doi:10.1186/s13195-023-01264-z · Cited by 26
Hussain, Q. M., Al-Hussainy, A. F., Sanghvi, G. V., Roopashree, R., Kashyap, A., Anand, D. A., Panigrahi, R., Shavazi, N., Taher, S. G., Alwan, M., et al. (2025) · European journal of medical research · doi:10.1186/s40001-025-02618-z · Cited by 29
Nariman‐Saleh‐Fam, Z., Saadatian, Z., Daraei, A., Mansoori, Y., Bastami, M., & Tavakkoly‐Bazzaz, J. (2019) · Biomarkers in Medicine · doi:10.2217/bmm-2018-0127 · Cited by 24
Immunological dysregulation in preeclampsia: Pathogenesis and clinical implications
Qin, Z., & Long, Y. (2025) · International Immunopharmacology · doi:10.1016/j.intimp.2025.115314 · Cited by 25
MicroRNAs in Preeclampsia: Bridging Diagnosis and Treatment
Gerede, A., Stavros, S., Danavasi, M., Potiris, A., Moustakli, E., Machairiotis, N., Zikopoulos, A., Nikolettos, K., Drakakis, P., Nikolettos, N., et al. (2025) · Journal of Clinical Medicine · doi:10.3390/jcm14062003 · Cited by 21
Rachmawati, E., Sargowo, D., Rohman, M. S., Widodo, N., & Kalsum, U. (2021) · Non-coding RNA Research · doi:10.1016/j.ncrna.2021.02.003 · Cited by 21
Cao, Y., Wang, D., Li, S., Zhao, J., Xu, L., Liu, H., Lu, T., & Mou, Z. (2019) · Fish & Shellfish Immunology · doi:10.1016/j.fsi.2019.05.048 · Cited by 21
Chen, L., Hu, L., Zhu, X. Y., Wang, Y., Li, Q., Ma, J., & Li, H. (2020) · Cell Cycle · doi:10.1080/15384101.2020.1807094 · Cited by 19
Zhou, G., Duan, Y., Lu, C., & Wang, W. (2021) · International Immunopharmacology · doi:10.1016/j.intimp.2021.107633 · Cited by 19
Jiang, D., Wu, S., Xu, L., Xie, G., Li, D., & Peng, H. (2022) · Parasites & Vectors · doi:10.1186/s13071-021-05003-x · Cited by 21
The emerging power and promise of non-coding RNAs in chronic pain
Zhang, C., Gao, R., Zhou, R., Chen, H., Liu, C., Zhu, T., & Chen, C. (2022) · Frontiers in Molecular Neuroscience · doi:10.3389/fnmol.2022.1037929 · Cited by 19
MiR-155-5p plays as a “janus” in the expression of inflammatory cytokines induced by T-2 toxin
Guo, P., Qiao, F., Huang, D., Wu, Q., Chen, T., Badawy, S., Cheng, G., Hao, H., Xie, S., & Wang, X. (2020) · Food and Chemical Toxicology · doi:10.1016/j.fct.2020.111258 · Cited by 18
Sun, Z., Zhan, H., Wang, C., & Guo, P. (2022) · Psychopharmacology · doi:10.1007/s00213-022-06107-7 · Cited by 18
MicroRNA-155 and exosomal microRNA-155: Small pieces in the cardiovascular diseases puzzle
Eshraghi, R., Rafiei, M., Jazi, Z. H., Shafie, D., Raisi, A., & Mirzaei, H. (2024) · Pathology - Research and Practice · doi:10.1016/j.prp.2024.155274 · Cited by 20
Effects of allergic stimulation and glucocorticoids on miR-155 in CD4+ T-cells.
Daniel, E., Roff, A. N., Hsu, M.-H., Panganiban, R. P., Lambert, K. A., & Ishmael, F. T. (2018) · Europe PMC (PubMed Central) · Cited by 18
Ye, J., Wu, Y., Guo, R., Zeng, W., Duan, Y., Yang, Z., & Yang, L. (2019) · Mediators of Inflammation · doi:10.1155/2019/4530534 · Cited by 18
Self-citationWang, Y. K., Wang, J., Hua, F., Shen, Y. L., Han, L., You, J. Y., Wei, W., Zhang, C. Y., Liu, X. D., & Zhang, Q. (2022) · Oxidative Medicine and Cellular Longevity · doi:10.1155/2022/3951686 · Cited by 17
Zhou, Q., Yang, L., Verne, M. L., Zhang, B. B., Fields, J. Z., & Verne, G. N. (2023) · Gastroenterology · doi:10.1053/j.gastro.2022.12.041 · Cited by 17
Self-citationIanni, M., Corraliza-Gómez, M., Costa-Coelho, T., Ferreira-Manso, M., Inteiro-Oliveira, S., Alemãn-Serrano, N., Sebastião, A. M., Garcia, G., Diógenes, M. J., & Brites, D. M. T. O. (2024) · International Journal of Molecular Sciences · doi:10.3390/ijms25179475 · Cited by 18
Exosomal miR ‐155‐5p promote the occurrence of carotid atherosclerosis
Yang, W., Li, Q., Wang, F., Zhang, X., Zhang, X., Wang, M., Dong, X., Zhao, Y., & Tang, L. (2024) · Journal of Cellular and Molecular Medicine · doi:10.1111/jcmm.70187 · Cited by 17
Yang, K., Zeng, L., Ge, A., Pan, X., Bao, T., Long, Z., Tong, Q., Yuan, M., Zhu, X., Ge, J., et al. (2020) · Journal of Cellular and Molecular Medicine · doi:10.1111/jcmm.15979 · Cited by 16
Johansson, K., Weidner, J., & Rådinger, M. (2018) · Cancer Letters · doi:10.1016/j.canlet.2018.03.036 · Cited by 17
Inflammation related miRNAs as an important player between obesity and cancers
Gholami, M., Larijani, B. A., Zahedi, Z., Mahmoudian, F., Bahrami, S., Omran, S. P., Saadatian, Z., Hasani‐Ranjbar, S., Taslimi, R., Bastami, M., et al. (2019) · Journal of Diabetes & Metabolic Disorders · doi:10.1007/s40200-019-00459-2 · Cited by 16
MicroRNAs and Long Noncoding RNAs in Coronary Artery Disease
Zaręba, Ł., Fitas, A., Wolska, M., Junger, E., Eyileten, C., Wicik, Z., Rosa, S. D., Siller-Matula, J. M., & Postula, M. A. (2020) · Cardiology Clinics · doi:10.1016/j.ccl.2020.07.005 · Cited by 14
Immune Cells Release MicroRNA-155 Enriched Extracellular Vesicles That Promote HIV-1 Infection
Boucher, J., Rousseau, A., Boucher, C., Subra, C., Bazié, W. W., Hubert, A., Bourgeault, E., Benmoussa, A., Goyer, B., Tessier, P. A., et al. (2023) · Cells · doi:10.3390/cells12030466 · Cited by 13
He, B., Hu, M., Liang, Z., Ma, Q., Zi, Y.-H., Dong, Z., Li, Q., Luo, Y., Qian, G., Guo, L., et al. (2019) · Journal of Immunology Research · doi:10.1155/2019/4521231 · Cited by 14
Fitzpatrick, G., Nader, D., Watkin, R. L., McCoy, C. E., Curley, G. F., & Kerrigan, S. W. (2022) · Frontiers in Cellular and Infection Microbiology · doi:10.3389/fcimb.2022.854126 · Cited by 14
Wu, Y., Ye, J., Guo, R., Liang, X., & Yang, L. (2018) · Journal of Immunology Research · doi:10.1155/2018/6249085 · Cited by 14
Self-citationVartak, T., Giardini, E., Kelly, D. J., Moran, B., Kennedy, C., Barry, M. C., Godson, C., & Brennan, E. P. (2024) · Atherosclerosis · doi:10.1016/j.atherosclerosis.2024.117573 · Cited by 13
Pandey, N., & Singh, S. K. (2023) · Microbes and Infection · doi:10.1016/j.micinf.2023.105173 · Cited by 12
Zhuang, C., Kang, M., Oh, J., & Lee, M. (2024) · Regenerative Biomaterials · doi:10.1093/rb/rbae092 · Cited by 12
Zare, N., Javanmard, S. H., Mehrzad, V., Eskandari, N., & Andalib, A. (2019) · Cell journal · doi:10.22074/cellj.2020.6550 · Cited by 11
Matsuzaka, Y., & Yashiro, R. (2022) · International Journal of Molecular Sciences · doi:10.3390/ijms23105658 · Cited by 14
Interrelationship between miRNA and splicing factors in pancreatic ductal adenocarcinoma
Supadmanaba, I. G. P., Mantini, G., Randazzo, O., Capula, M., Muller, I. B., Cascioferro, S., Diana, P., Peters, G. J., & Giovannetti, E. (2021) · Epigenetics · doi:10.1080/15592294.2021.1916697 · Cited by 10
Li, X., Gong, Y., Lin, X., Lin, Q., Luo, J., Yu, T., Xu, J., Chen, L., Xu, L., & Hu, Y. (2022) · The Journal of Microbiology · doi:10.1007/s12275-022-1663-5 · Cited by 10
MicroRNA155 in non-small cell lung cancer: a potential therapeutic target
Wei, X., Xiong, X., Chen, Z., Chen, B., Zhang, C.-T., & Zhang, W. (2025) · Frontiers in Oncology · doi:10.3389/fonc.2025.1517995 · Cited by 9
Gratpain, V., Loriot, A. E., Bottemanne, P., D’Auria, L., Terrasi, R., Payen, V. L., Pesch, V. V., Muccioli, G. G., & Rieux, A. D. (2024) · Heliyon · doi:10.1016/j.heliyon.2024.e27025 · Cited by 9
Deficiency of programmed cell death 4 affects the balance of T cell subsets in hyperlipidemic mice
Jiang, Y. Z., Gao, Q., Wang, L.-Y., Ma, T., Zhu, F., Wang, Q., Gao, F., Guo, C., & Zhang, L. (2019) · Molecular Immunology · doi:10.1016/j.molimm.2019.06.020 · Cited by 9
Self-citationNogo-B inhibition restricts ulcerative colitis via inhibiting p68/miR-155 signaling pathway
Zheng, J., Wang, S., Zhang, T., Li, H., Zhu, M., Wei, X., Ge, Y., Yang, X., Zhang, S., Xu, H., et al. (2023) · International Immunopharmacology · doi:10.1016/j.intimp.2023.110378 · Cited by 8
Liu, D., Han, P., Gao, C., Gao, W., Yao, X., & Liu, S. (2020) · Frontiers in Pharmacology · doi:10.3389/fphar.2020.00270 · Cited by 8
Retractedda Costa, J. C., de Souza, S. S., & Val, A. L. (2022) · Microbial Pathogenesis · doi:10.1016/j.micpath.2022.105804 · Cited by 8
Yin, X., Xu, C., Xu, Q., & Lang, D. (2020) · Molecular Medicine Reports · doi:10.3892/mmr.2020.11404 · Cited by 7
Zhou, X., Zhang, J., Liu, J., Guo, J., Wei, Y. Q., Li, J., He, P., Lan, T., Peng, L., & Li, H. (2020) · International Journal for Parasitology · doi:10.1016/j.ijpara.2020.07.013 · Cited by 7
Roles of extracellular vesicles derived from immune cells in atherosclerosis
Qiao, K., Cui, X., Gao, J., Yu, F., Liu, H., Dai, Y., Liu, J., Yang, Y., Xian, X., Hu, J.-M., et al. (2023) · Extracellular Vesicle · doi:10.1016/j.vesic.2023.100028 · Cited by 4
Tanaka, Y., Yamagishi, M., Motomura, Y., Kamatani, T., Oguchi, Y., Suzuki, N., Kiniwa, T., Kabata, H., Irie, M., Tsunoda, T., et al. (2023) · Communications Biology · doi:10.1038/s42003-023-05297-w · Cited by 6
Kang, M., Zhuang, C., Oh, J., & Lee, M. (2024) · Biomaterials Research · doi:10.34133/bmr.0107 · Cited by 6
Tumor-Released Products Promote Bone Marrow-Derived Macrophage Survival and Proliferation
Motta, J. M., Rumjanek, V. M., Mantovani, A., & Locati, M. (2021) · Biomedicines · doi:10.3390/biomedicines9101387 · Cited by 6
Li, Y., Tian, L., Yang, Z., Liu, Y., Li, D., & Tang, Z. (2025) · European journal of medical research · doi:10.1186/s40001-025-02683-4 · Cited by 5
MiR-21 suppresses ox-LDL-induced HUVECs apoptosis by targeting PDCD4.
Xu, X., Chen, Y., Zhao, X., Liang, X., Wang, X., Zhang, Y., Yuan, M., Ni, Y., Liu, H., & Li, G. (2017) · PubMed · Cited by 5
miRetrieve—an R package and web application for miRNA text mining
Friedrich, J., Hammes, H., & Krenning, G. (2021) · NAR Genomics and Bioinformatics · doi:10.1093/nargab/lqab117 · Cited by 5
miR-191-5p suppresses PRRSV replication by targeting porcine EGFR to enhance interferon signaling
Pan, Y., Zhang, L., Ma, W., Ibrahim, Y. M., Zhang, W., Wang, M., Wang, X., Xu, Y., Gao, C., Chen, H., et al. (2024) · Frontiers in Microbiology · doi:10.3389/fmicb.2024.1473504 · Cited by 4
Kavanagh, M. E., del Real, I. H., Priéto, I., Alvarez-Moreno, R., Egido, J., López‐Franco, Ó., Lázaro, I., & Gómez‐Guerrero, C. (2026) · Cardiovascular Diabetology · doi:10.1186/s12933-026-03121-3 · Cited by 4
Salamanna, F., Giavaresi, G., Martino, A. C. D., Gaudio, A., Nucera, F., Faldini, C., & Fini, M. (2025) · Frontiers in Medicine · doi:10.3389/fmed.2025.1720672 · Cited by 3
Metadata
- Authors
- Ye, J., Guo, R., Shi, Y., Qi, F., Guo, C., & Yang, L.
- Affiliations
- Army Medical University (CN)
- Kunming General Hospital of Chengdu Military Command (CN)
- Department of Cardiology, Kunming General Hospital of Chengdu Military Area, Yunnan 650032, China
- Corresponding author
- Yang, Lixia
- Venue
- Mediators of Inflammation
- Publisher
- Wiley
- Published
- 2016
- Volume
- 2016
- Pages
- 1-14
- ISSN
- 0962-9351 (ISSN-L)
- 1466-1861
- PMC
- PMC5098093
- OpenAlex
- W2533066341
- Cited by
- 127
- References
- 49
- Citations by year
- 2026: 11 · 2025: 11 · 2024: 14 · 2023: 19 · 2022: 11 · 2021: 9 · 2020: 21 · 2019: 18 · 2018: 8 · 2017: 5
- FWCI
- 4.31
- Type
- journal article
- Language
- en
- Open access
- gold
- doi.org
- Locations
- Mediators of Inflammation (publishedVersion, cc-by)
- PubMed Central (publishedVersion, cc-by)
- PubMed (publishedVersion)
- DOAJ (DOAJ: Directory of Open Access Journals) (submittedVersion, cc-by-sa)
- Topics
- Life Sciences › Biochemistry, Genetics and Molecular Biology › Cancer Research › MicroRNA in disease regulation
- Life Sciences › Immunology and Microbiology › Immunology › Atherosclerosis and Cardiovascular Diseases
- Life Sciences › Immunology and Microbiology › Immunology › Cytokine Signaling Pathways and Interactions
- Keywords
- miR-155, atherosclerosis, atherogenesis, inflammation, SOCS1, STAT3, PDCD4, macrophages, interleukin-6, TNF-α, oxidized LDL, microRNA
- MeSH terms
- RAW 264.7 Cells, Suppressor of Cytokine Signaling 1 Protein, Animals, Aorta, Apolipoproteins E, Inflammation, Male, Tumor Necrosis Factor-alpha, Signal Transduction, RNA-Binding Proteins, RNA, Small Interfering, MicroRNAs, Atherosclerosis, STAT3 Transcription Factor, Apoptosis Regulatory Proteins, Mice
About these checks
Registry, retraction, Cites and statistics results are computed, not judged, with one exception: a printed reference that no index lists is read once by a model before it counts as a citation error. Claims are extracted by a model and kept only when their quote appears verbatim in the text; each cited source is then checked, with a model’s help, for whether it says what the claim relies on. Those verdicts can be wrong — read the claim’s quote and the cited source before relying on one.
Statistics and arithmetic are recomputed, not judged.
Confidence bands are shown only for fields calibrated on our annotated test set. None is calibrated yet, so no band is shown.
What counts as a claim ›How we measure confidence ›How we check this ›
Are you an author, or do you see a problem with this page? Request a review
