

The DOI matches its Crossref record; 3 of the 3 references it cites were found in a registry or an index.
Exploring Co-occurring POLE Exonuclease and Non-exonuclease Domain Mutations and Their Impact on Tumor Mutagenicity
Open accessPublished version of a preprint
Abstract
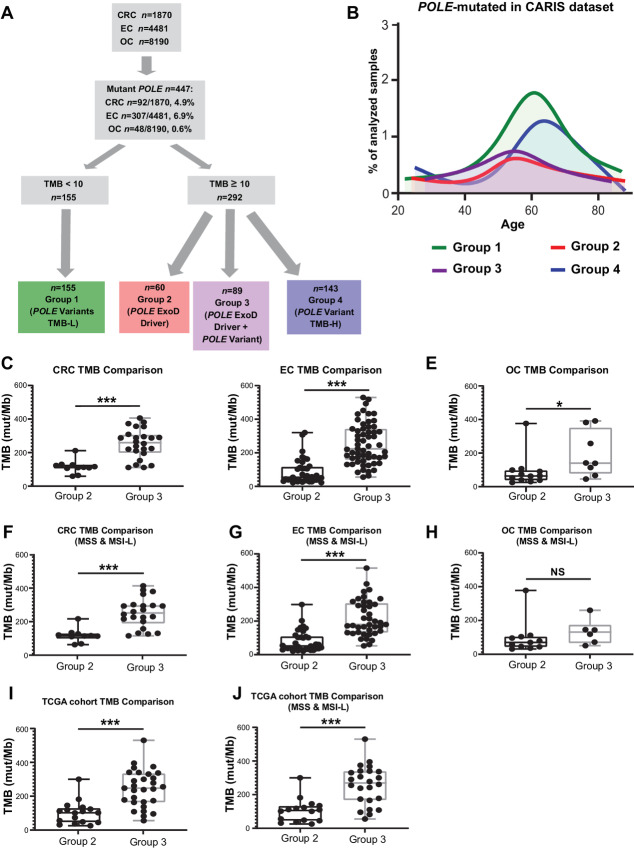
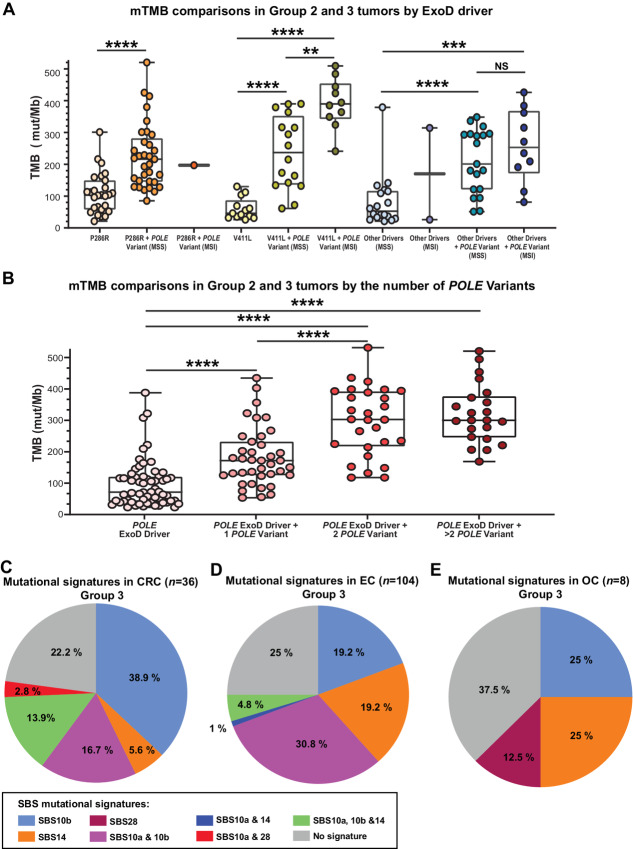
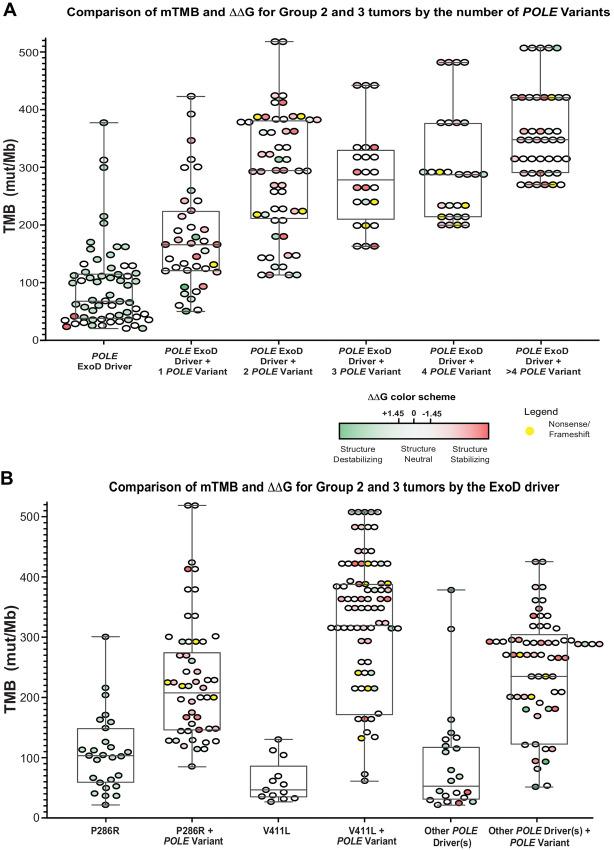
POLE driver mutations in the exonuclease domain (ExoD driver) are prevalent in several cancers, including colorectal cancer and endometrial cancer, leading to dramatically ultra-high tumor mutation burden (TMB). To understand whether POLE mutations that are not classified as drivers (POLE Variant) contribute to mutagenesis, we assessed TMB in 447 POLE-mutated colorectal cancers, endometrial cancers, and ovarian cancers classified as TMB-high ≥10 mutations/Mb (mut/Mb) or TMB-low <10 mut/Mb. TMB was significantly highest in tumors with “POLE ExoD driver plus POLE Variant” (colorectal cancer and endometrial cancer, P < 0.001; ovarian cancer, P < 0.05). TMB increased with additional POLE variants (P < 0.001), but plateaued at 2, suggesting an association between the presence of these variants and TMB. Integrated analysis of AlphaFold2 POLE models and quantitative stability estimates predicted the impact of multiple POLE variants on POLE functionality. The prevalence of immunogenic neoepitopes was notably higher in the “POLE ExoD driver plus POLE Variant” tumors. Overall, this study reveals a novel correlation between POLE variants in POLE ExoD-driven tumors, and ultra-high TMB. Currently, only select pathogenic ExoD mutations with a reliable association with ultra-high TMB inform clinical practice. Thus, these findings are hypothesis-generating, require functional validation, and could potentially inform tumor classification, treatment responses, and clinical outcomes. Significance: Somatic POLE ExoD driver mutations cause proofreading deficiency that induces high TMB. This study suggests a novel modifier role for POLE variants in POLE ExoD-driven tumors, associated with ultra-high TMB. These data, in addition to future functional studies, may inform tumor classification, therapeutic response, and patient outcomes.
Overview
The claims and statistics of this paper haven’t been checked yet.
Run the check — free, no account needed. It reads the open-access text and checks the sources it cites.
Integrity signals
Registry
Cites
Statistics
Figures
Verification
Claims the paper makes
The claims and statistics of this paper haven’t been checked yet.
Run the check — free, no account needed. It reads the open-access text and checks the sources it cites.
Self-check
Percentages, sums and reported differences re-computed from the paper’s own numbers.
The self-check needs the paper’s full text.
Citations
Cites
Highly accurate protein structure prediction with AlphaFold
Jumper, J., Evans, R., Pritzel, A., Green, T., Figurnov, M., Ronneberger, O., Tunyasuvunakool, K., Bates, R., Žídek, A., Potapenko, A., et al. (2021) · Nature · doi:10.1038/s41586-021-03819-2 · Cited by 43,764
Highly accurate protein structure prediction for the human proteome
Tunyasuvunakool, K., Adler, J., Wu, Z., Green, T., Zielinski, M., Žídek, A., Bridgland, A., Cowie, A., Meyer, C., Laydon, A., et al. (2021) · Nature · doi:10.1038/s41586-021-03828-1 · Cited by 3,025
The Rosetta All-Atom Energy Function for Macromolecular Modeling and Design
Alford, R. F., Leaver-Fay, A., Jeliazkov, J. R., O’Meara, M. J., DiMaio, F. P., Park, H., Shapovalov, M. V., Renfrew, P. D., Mulligan, V. K., Kappel, K., et al. (2017) · Journal of Chemical Theory and Computation · doi:10.1021/acs.jctc.7b00125 · Cited by 1,532
Self-citation
Research works printed but not linked: 60
- Nicolas, 2016, POLD1: central mediator of DNA replication and repair, and implication in cancer and other pathologies, Gene, 590, 128, 10.1016/j.gene.2016.06.031 · DOI
- Vande Perre, 2019, Germline mutation p.N363K in POLE is associated with an increased risk of colorectal cancer and giant cell glioblastoma, Fam Cancer, 18, 173, 10.1007/s10689-018-0102-6 · DOI
- Mur, 2020, Role of POLE and POLD1 in familial cancer, Genet Med, 22, 2089, 10.1038/s41436-020-0922-2 · DOI
- Palles, 2013, Germline mutations affecting the proofreading domains of POLE and POLD1 predispose to colorectal adenomas and carcinomas, Nat Genet, 45, 136, 10.1038/ng.2503 · DOI
- Valle, 2014, New insights into POLE and POLD1 germline mutations in familial colorectal cancer and polyposis, Hum Mol Genet, 23, 3506, 10.1093/hmg/ddu058 · DOI
- Djursby, 2020, New pathogenic germline variants in very early onset and familial colorectal cancer patients, Front Genet, 11, 566266, 10.3389/fgene.2020.566266 · DOI
- 2013, Germline DNA polymerase mutations increase cancer susceptibility, Cancer Discov, 3, 136, 10.1158/2159-8290.CD-RW2013-006 · DOI
- Ahn, 2016, The somatic POLE P286R mutation defines a unique subclass of colorectal cancer featuring hypermutation, representing a potential genomic biomarker for immunotherapy, Oncotarget, 7, 68638, 10.18632/oncotarget.11862 · DOI
- León-Castillo, 2020, Interpretation of somatic POLE mutations in endometrial carcinoma, J Pathol, 250, 323, 10.1002/path.5372 · DOI
- Campbell, 2017, Comprehensive analysis of hypermutation in human cancer, Cell, 171, 1042, 10.1016/j.cell.2017.09.048 · DOI
- Rousseau, 2022, PD-1 blockade in solid tumors with defects in polymerase epsilon, Cancer Discov, 12, 1435, 10.1158/2159-8290.CD-21-0521 · DOI
- Garmezy, 2022, Clinical and molecular characterization of pole mutations as predictive biomarkers of response to immune checkpoint inhibitors in advanced cancers, JCO Precis Oncol, 6, e2100267, 10.1200/PO.21.00267 · DOI
- Das, 2022, Genomic predictors of response to PD-1 inhibition in children with germline DNA replication repair deficiency, Nat Med, 28, 125, 10.1038/s41591-021-01581-6 · DOI
- Chung, 2021, DNA polymerase and mismatch repair exert distinct microsatellite instability signatures in normal and malignant human cells, Cancer Discov, 11, 1176, 10.1158/2159-8290.CD-20-0790 · DOI
- Rahn, 2019, POLE score: a comprehensive profiling of programmed death 1 ligand 1 expression in pancreatic ductal adenocarcinoma, Oncotarget, 10, 1572, 10.18632/oncotarget.26705 · DOI
- Haruma, 2018, Clinical impact of endometrial cancer stratified by genetic mutational profiles, POLE mutation, and microsatellite instability, PLoS One, 13, e0195655, 10.1371/journal.pone.0195655 · DOI
- Merino, 2020, Establishing guidelines to harmonize tumor mutational burden (TMB): in silico assessment of variation in TMB quantification across diagnostic platforms: phase I of the Friends of Cancer Research TMB Harmonization Project, J Immunother Cancer, 8, e000147, 10.1136/jitc-2019-000147 · DOI
- Marabelle, 2020, Association of tumour mutational burden with outcomes in patients with advanced solid tumours treated with pembrolizumab: prospective biomarker analysis of the multicohort, open-label, phase 2 KEYNOTE-158 study, Lancet Oncol, 21, 1353, 10.1016/S1470-2045(20)30445-9 · DOI · Paper page
- Bartley, 2022, Mismatch repair and microsatellite instability testing for immune checkpoint inhibitor therapy: guideline from the College of American Pathologists in collaboration with the association for molecular pathology and fight colorectal cancer, Arch Pathol Lab Med, 146, 1194, 10.5858/arpa.2021-0632-CP · DOI
- Fortuno, 2021, Specifications of the ACMG/AMP variant interpretation guidelines for germline TP53 variants, Hum Mutat, 42, 223, 10.1002/humu.24152 · DOI
- Skidmore, 2016, GenVisR: Genomic Visualizations in R, Bioinformatics, 32, 3012, 10.1093/bioinformatics/btw325 · DOI
- Cerami, 2012, The cBio cancer genomics portal: an open platform for exploring multidimensional cancer genomics data, Cancer Discov, 2, 401, 10.1158/2159-8290.CD-12-0095 · DOI · Paper page
- Gao, 2013, Integrative analysis of complex cancer genomics and clinical profiles using the cBioPortal, Sci Signal, 6, pl1, 10.1126/scisignal.2004088 · DOI · Paper page
- Díaz-Gay, 2018, Mutational signatures in cancer (MuSiCa): a web application to implement mutational signatures analysis in cancer samples, BMC Bioinformatics, 19, 224, 10.1186/s12859-018-2234-y · DOI
- Demidova, 2023, Candidate variants in DNA replication and repair genes in early-onset renal cell carcinoma patients referred for germline testing, BMC Genomics, 24
- Hogg, 2014, Structural basis for processive DNA synthesis by yeast DNA polymerase ɛ, Nat Struct Mol Biol, 21, 49, 10.1038/nsmb.2712 · DOI
- Yuan, 2020, Structure of the polymerase ε holoenzyme and atomic model of the leading strand replisome, Nat Commun, 11, 3156, 10.1038/s41467-020-16910-5 · DOI
- Khatib, 2011, Algorithm discovery by protein folding game players, Proc Natl Acad Sci U S A, 108, 18949, 10.1073/pnas.1115898108 · DOI
- Maguire, 2021, Perturbing the energy landscape for improved packing during computational protein design, Proteins, 89, 436, 10.1002/prot.26030 · DOI · Paper page
- Krivov, 2009, Improved prediction of protein side-chain conformations with SCWRL4, Proteins, 77, 778, 10.1002/prot.22488 · DOI
- Shapovalov, 2011, A smoothed backbone-dependent rotamer library for proteins derived from adaptive kernel density estimates and regressions, Structure, 19, 844, 10.1016/j.str.2011.03.019 · DOI · Paper page
- Pettersen, 2004, UCSF Chimera–a visualization system for exploratory research and analysis, J Comput Chem, 25, 1605, 10.1002/jcc.20084 · DOI
- Leaver-Fay, 2013, Scientific benchmarks for guiding macromolecular energy function improvement, Methods Enzymol, 523, 109, 10.1016/B978-0-12-394292-0.00006-0 · DOI
- Shah, 2022, Co-occurring mutations in the POLE exonuclease and non-exonuclease domains define a unique subset of highly mutagenic tumors, bioRxiv
- Alexandrov, 2020, The repertoire of mutational signatures in human cancer, Nature, 578, 94, 10.1038/s41586-020-1943-3 · DOI · Paper page
- Hodel, 2020, POLE mutation spectra are shaped by the mutant allele identity, its abundance, and mismatch repair status, Mol Cell, 78, 1166, 10.1016/j.molcel.2020.05.012 · DOI
- Park, 2022, Mouse model and human patient data reveal critical roles for Pten and p53 in suppressing POLE mutant tumor development, NAR Cancer, 4, zcac004, 10.1093/narcan/zcac004 · DOI
- Robinson, 2021, Increased somatic mutation burdens in normal human cells due to defective DNA polymerases, Nat Genet, 53, 1434, 10.1038/s41588-021-00930-y · DOI · Paper page
- Kim, 2023, DeepNeo: a webserver for predicting immunogenic neoantigens, Nucleic Acids Res, 51, W134, 10.1093/nar/gkad275 · DOI
- Wu, 2023, Neodb: a comprehensive neoantigen database and discovery platform for cancer immunotherapy, Database, 2023, baad041, 10.1093/database/baad041 · DOI
- Parra-Herran, 2017, Molecular-based classification algorithm for endometrial carcinoma categorizes ovarian endometrioid carcinoma into prognostically significant groups, Mod Pathol, 30, 1748, 10.1038/modpathol.2017.81 · DOI
- van 't Erve, 2021, KRAS A146 mutations are associated with distinct clinical behavior in patients with colorectal liver metastases, JCO Precis Oncol, 5, PO.21.00223
- Kim, 2020, PTEN protein loss and loss-of-function mutations in gastric cancers: the relationship with microsatellite instability, EBV, HER2, and PD-L1 expression, Cancers, 12, 1724, 10.3390/cancers12071724 · DOI
- Post, 2020, Multi-model functionalization of disease-associated PTEN missense mutations identifies multiple molecular mechanisms underlying protein dysfunction, Nat Commun, 11, 2073, 10.1038/s41467-020-15943-0 · DOI
- Xu, 2014, Combined PTEN mutation and protein expression associate with overall and disease-free survival of glioblastoma patients, Transl Oncol, 7, 196, 10.1016/j.tranon.2014.02.004 · DOI
- Serebriiskii, 2022, Comprehensive characterization of PTEN mutational profile in a series of 34,129 colorectal cancers, Nat Commun, 13, 1618, 10.1038/s41467-022-29227-2 · DOI · Paper page
- Rudd, 2011, A unique spectrum of somatic PIK3CA (p110alpha) mutations within primary endometrial carcinomas, Clin Cancer Res, 17, 1331, 10.1158/1078-0432.CCR-10-0540 · DOI
- Dahl, 2022, Probing the mechanisms of two exonuclease domain mutators of DNA polymerase ϵ, Nucleic Acids Res, 50, 962, 10.1093/nar/gkab1255 · DOI
- Park, 2019, POLE proofreading defects: Contributions to mutagenesis and cancer, DNA Repair, 76, 50, 10.1016/j.dnarep.2019.02.007 · DOI
- Príncipe, 2021, LRP1B: a giant lost in cancer translation, Pharmaceuticals, 14, 836, 10.3390/ph14090836 · DOI
- Lu, 2021, Pan-cancer analysis of SETD2 mutation and its association with the efficacy of immunotherapy, NPJ Precis Oncol, 5, 51, 10.1038/s41698-021-00193-0 · DOI
- Okamura, 2020, ARID1A alterations function as a biomarker for longer progression-free survival after anti-PD-1/PD-L1 immunotherapy, J Immunother Cancer, 8, e000438, 10.1136/jitc-2019-000438 · DOI
- Chen, 2023, Pan-cancer analysis of histone methyltransferase KMT2D with potential implications for prognosis and immunotherapy in human cancer, Comb Chem High Throughput Screen, 26, 83, 10.2174/1386207325666220221092318 · DOI
- Scott, 2004, Germline missense changes in the APC gene and their relationship to disease, Hered Cancer Clin Pract, 2, 81, 10.1186/1897-4287-2-2-81 · DOI
- Zhang, 2017, Multiple roles of APC and its therapeutic implications in colorectal cancer, J Natl Cancer Inst, 109, djw332, 10.1093/jnci/djw332 · DOI
- Lüchtenborg, 2004, APC mutations in sporadic colorectal carcinomas from The Netherlands Cohort Study, Carcinogenesis, 25, 1219, 10.1093/carcin/bgh117 · DOI
- De Mattos-Arruda, 2020, Neoantigen prediction and computational perspectives towards clinical benefit: recommendations from the ESMO Precision Medicine Working Group, Ann Oncol, 31, 978, 10.1016/j.annonc.2020.05.008 · DOI
- Parkash, 2019, Structural consequence of the most frequently recurring cancer-associated substitution in DNA polymerase ε, Nat Commun, 10, 373, 10.1038/s41467-018-08114-9 · DOI
- Cao, 2019, DeepDDG: predicting the stability change of protein point mutations using neural networks, J Chem Inf Model, 59, 1508, 10.1021/acs.jcim.8b00697 · DOI
- Xing, 2019, A recurrent cancer-associated substitution in DNA polymerase ε produces a hyperactive enzyme, Nat Commun, 10, 374, 10.1038/s41467-018-08145-2 · DOI
Metadata
- Authors
- Shah, S. M., Demidova, E. V., Ringenbach, S., Faezov, B., Andrake, M., Gandhi, A., Mur, P., Viana-Errasti, J., Xiu, J., Swensen, J., Valle, L., Dunbrack, R. L., Hall, M. J., & Arora, S.
- Affiliations
- Fox Chase Cancer Center (US)
- University College Dublin (IE)
- Institut d'Investigació Biomédica de Bellvitge (ES)
- Caris Life Sciences (United States) (US)
- Corresponding author
- Arora, Sanjeevani
- ORCID
- Venue
- Cancer Research Communications
- Published
- 2024-01-26
- Volume
- 4
- Issue
- 1
- Pages
- 213-225
- ISSN
- 2767-9764 (ISSN-L)
- PMC
- PMC10812383
- OpenAlex
- W4390733351
- Cited by
- 16
- References
- 3
- Citations by year
- 2026: 5 · 2025: 10 · 2024: 1
- FWCI
- 3.21
- Type
- journal article
- Language
- en
- Update notices
- correction (2024-05-31)
- Open access
- gold
- doi.org
- Locations
- Cancer Research Communications (publishedVersion, cc-by)
- PubMed Central (publishedVersion, cc-by)
- PubMed (publishedVersion)
- TUScholarShare (Temple University) (submittedVersion, cc-by)
- Dipòsit Digital de la Universitat de Barcelona (Universitat de Barcelona) (submittedVersion, cc-by)
- Funders
- HHS | National Institutes of Health (P30 CA006927, R35 GM122517, UH2CA271230-01, CEP Award (Yale Head and Neck Cancer NIH SPORE))
- American Cancer Society
- U.S. Department of Defense (W81XWH-18-1-0148)
- Spanish Ministry of Science and Innovation (PID2020-112595RB-I00 and predoctoral fellowship to JV-E)
- MEC | Instituto de Salud Carlos III (CIBERONC CB16/12/00234)
- Generalitat de Catalunya (AGAUR 2017SGR1282,CERCA Program)
- Topics
- Life Sciences › Biochemistry, Genetics and Molecular Biology › Cancer Research › Cancer Genomics and Diagnostics
- Health Sciences › Medicine › Pathology and Forensic Medicine › Genetic factors in colorectal cancer
- Health Sciences › Medicine › Oncology › Cancer Immunotherapy and Biomarkers
- Keywords
- POLE mutation, exonuclease domain, tumor mutational burden, mutagenesis, colorectal cancer, endometrial cancer, ovarian cancer, neoantigens, protein stability
About these checks
Registry, retraction, Cites and statistics results are computed, not judged, with one exception: a printed reference that no index lists is read once by a model before it counts as a citation error. Claims are extracted by a model and kept only when their quote appears verbatim in the text; each cited source is then checked, with a model’s help, for whether it says what the claim relies on. Those verdicts can be wrong — read the claim’s quote and the cited source before relying on one.
Statistics and arithmetic are recomputed, not judged.
Confidence bands are shown only for fields calibrated on our annotated test set. None is calibrated yet, so no band is shown.
What counts as a claim ›How we measure confidence ›How we check this ›
Are you an author, or do you see a problem with this page? Request a review
