Cited by 117Atherosclerosis and Cardiovascular DiseasesPhagocytosis and Immune RegulationCholesterol and Lipid Metabolism

The DOI matches its Crossref record; 40 of the 40 references it cites were found in a registry or an index.

Interferon Regulatory Factor 5 Controls Necrotic Core Formation in Atherosclerotic Lesions by Impairing Efferocytosis

Open access

Abstract

Background: Myeloid cells are central to atherosclerotic lesion development and vulnerable plaque formation. Impaired ability of arterial phagocytes to uptake apoptotic cells (efferocytosis) promotes lesion growth and establishment of a necrotic core. The transcription factor interferon regulatory factor (IRF)-5 is an important modulator of myeloid function and programming. We sought to investigate whether IRF5 affects the formation and phenotype of atherosclerotic lesions. Methods: We investigated the role of IRF5 in atherosclerosis in 2 complementary models. First, atherosclerotic lesion development in hyperlipidemic apolipoprotein E-deficient (ApoE -/- ) mice and ApoE -/- mice with a genetic deletion of IRF5 (ApoE -/- Irf5 -/- ) was compared and then lesion development was assessed in a model of shear stress-modulated vulnerable plaque formation. Results: Both lesion and necrotic core size were significantly reduced in ApoE -/- Irf5 -/- mice compared with IRF5-competent ApoE -/- mice. Necrotic core size was also reduced in the model of shear stress-modulated vulnerable plaque formation. A significant loss of CD11c + macrophages was evident in ApoE -/- Irf5 -/- mice in the aorta, draining lymph nodes, and bone marrow cell cultures, indicating that IRF5 maintains CD11c + macrophages in atherosclerosis. Moreover, we revealed that the CD11c gene is a direct target of IRF5 in macrophages. In the absence of IRF5, CD11c - macrophages displayed a significant increase in expression of the efferocytosis-regulating integrin-β3 and its ligand milk fat globule-epidermal growth factor 8 protein and enhanced efferocytosis in vitro and in situ. Conclusions: IRF5 is detrimental in atherosclerosis by promoting the maintenance of proinflammatory CD11c + macrophages within lesions and controlling the expansion of the necrotic core by impairing efferocytosis.

Overview

The claims and statistics of this paper haven’t been checked yet.

Run the check — free, no account needed. It reads the open-access text and checks the sources it cites.

A few free checks a day · papers already verified open instantly · results are public

Integrity signals

Registry

Crossref · 10.1161/circulationaha.117.027844

Cites

40 of 40 references verified0 citation errors · 0 not checkable

Statistics

Figures

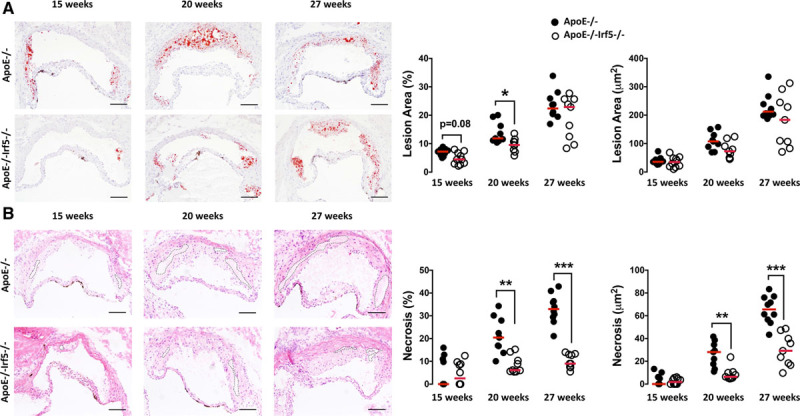
Figure 1. IRF5 deficiency decreases lesion and necrotic core size in the aortic root of ApoE-/- mice. Representative images of aortic root sections from ApoE-/- and ApoE-/-Irf5-/- mice 15, 20, or 27 weeks of age stained with Oil Red O and hematoxylin for lesion area (A). Graphs show cross-sectional aortic root lesion area (x103 μm2 and %) (B) hematoxylin and eosin for necrotic core delineation. Graphs show aortic root lesional necrotic core area (defined as anuclear, afibrotic, and eosin-negative areas) (x103 μm2 and %). Dotted lines show necrotic core area. Each circle represents the mean area per individual mouse. Horizontal line denotes group median (n=9 to 10). Bars=100μm. ApoE indicates apolipoprotein E-deficient; and IRF, interferon regulatory factor. *P<0.05; **P<0.01; ***P<0.001.
Figure 1. IRF5 deficiency decreases lesion and necrotic core size in the aortic root of ApoE-/- mice. Representative images of aortic root sections from ApoE-/- and ApoE-/-Irf5-/- mice 15, 20, or 27 weeks of age stained with Oil Red O and hematoxylin for lesion area (A). Graphs show cross-sectional aortic root lesion area (x103 μm2 and %) (B) hematoxylin and eosin for necrotic core delineation. Graphs show aortic root lesional necrotic core area (defined as anuclear, afibrotic, and eosin-negative areas) (x103 μm2 and %). Dotted lines show necrotic core area. Each circle represents the mean area per individual mouse. Horizontal line denotes group median (n=9 to 10). Bars=100μm. ApoE indicates apolipoprotein E-deficient; and IRF, interferon regulatory factor. *P<0.05; **P<0.01; ***P<0.001.CC BY · PubMed Central
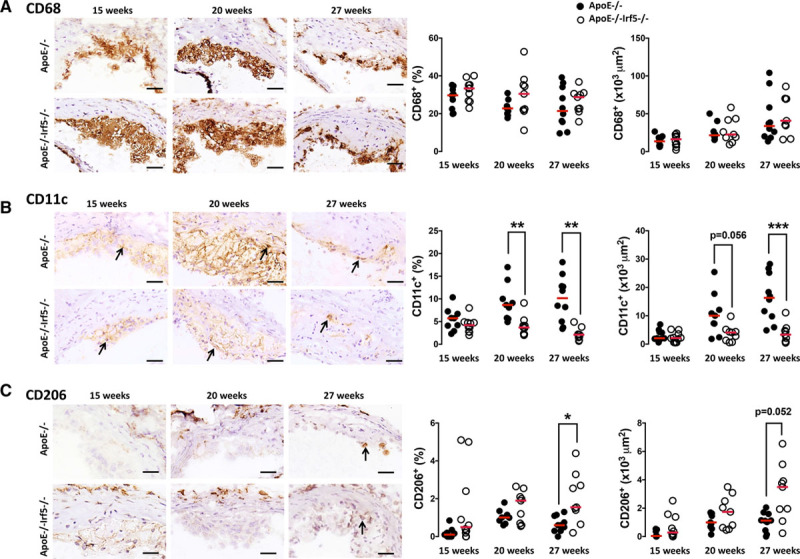
Figure 2. IRF5 deficiency reduces CD11c expression in the aortic root. A, Representative photomicrographs of aortic root sections from 15-, 20-, and 27-week-old ApoE-/- and ApoE-/-Irf5-/- mice stained with an antibody against CD68 (brown staining) and hematoxylin. Graphs show aortic root lesion area staining positive (x103 μm2 and %) for CD68. B, Representative photomicrographs of aortic root sections from 15-, 20-, and 27-week-old ApoE-/- and ApoE-/-Irf5-/- mice stained with an antibody against CD11c (brown staining) and hematoxylin. Arrows highlight CD11c+ positive cells. Graphs show aortic root lesion area staining positive (x103 μm2 and %) for CD11c. C, Representative photomicrographs of aortic root sections from 15-, 20-, and 27-week-old ApoE-/- and ApoE-/-Irf5-/- mice stained with an antibody against CD206 (brown staining) and hematoxylin. Graphs show aortic root lesion area staining positive (x103 μm2 and %) for CD206 (n=9 to 10). Bars=100μm. Each circle represents the mean positive area per individual mouse. Horizontal line denotes group median. ApoE indicates apolipoprotein E-deficient; and IRF, interferon regulatory factor. *P<0.05; **P<0.01; ***P<0.001.
Figure 2. IRF5 deficiency reduces CD11c expression in the aortic root. A, Representative photomicrographs of aortic root sections from 15-, 20-, and 27-week-old ApoE-/- and ApoE-/-Irf5-/- mice stained with an antibody against CD68 (brown staining) and hematoxylin. Graphs show aortic root lesion area staining positive (x103 μm2 and %) for CD68. B, Representative photomicrographs of aortic root sections from 15-, 20-, and 27-week-old ApoE-/- and ApoE-/-Irf5-/- mice stained with an antibody against CD11c (brown staining) and hematoxylin. Arrows highlight CD11c+ positive cells. Graphs show aortic root lesion area staining positive (x103 μm2 and %) for CD11c. C, Representative photomicrographs of aortic root sections from 15-, 20-, and 27-week-old ApoE-/- and ApoE-/-Irf5-/- mice stained with an antibody against CD206 (brown staining) and hematoxylin. Graphs show aortic root lesion area staining positive (x103 μm2 and %) for CD206 (n=9 to 10). Bars=100μm. Each circle represents the mean positive area per individual mouse. Horizontal line denotes group median. ApoE indicates apolipoprotein E-deficient; and IRF, interferon regulatory factor. *P<0.05; **P<0.01; ***P<0.001.CC BY · PubMed Central
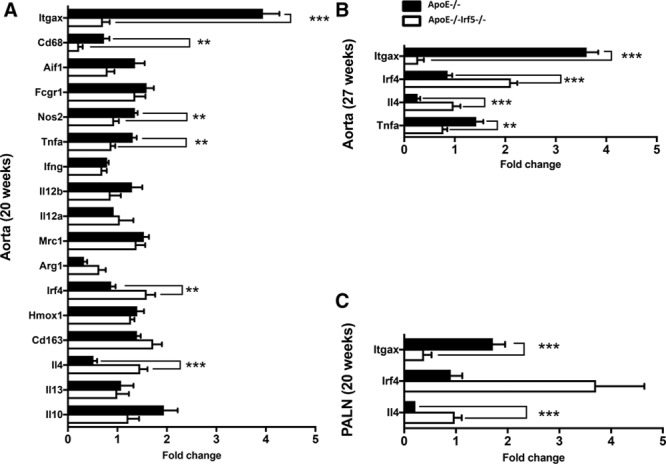
Figure 3. Decreased gene expression of inflammatory and myeloid cell markers in ApoE-/-Irf5-/- mice. The aortic arches and PALNs of ApoE-/- and ApoE-/-Irf5-/- mice were collected and RNA extracted. Gene expression of inflammatory and myeloid cell markers was then assessed by reverse transcription polymerase chain reaction. A and B, Graphs show gene expression of selected genes in the aortic arch of ApoE-/- (black bars) and ApoE-/-Irf5-/- mice (white bars) at 20 (A) and 27 (B) weeks of age. C, Graph shows gene expression of selected genes in the PALN of ApoE-/- (black bars) and ApoE-/-Irf5-/- mice (white bars) at 20 weeks of age. Data are presented as fold change (n=8). Bars=mean+SEM. ApoE indicates apolipoprotein E-deficient; IRF, interferon regulatory factor; and PALN, para-aortic lymph nodes. **P<0.01; ***P<0.001.
Figure 3. Decreased gene expression of inflammatory and myeloid cell markers in ApoE-/-Irf5-/- mice. The aortic arches and PALNs of ApoE-/- and ApoE-/-Irf5-/- mice were collected and RNA extracted. Gene expression of inflammatory and myeloid cell markers was then assessed by reverse transcription polymerase chain reaction. A and B, Graphs show gene expression of selected genes in the aortic arch of ApoE-/- (black bars) and ApoE-/-Irf5-/- mice (white bars) at 20 (A) and 27 (B) weeks of age. C, Graph shows gene expression of selected genes in the PALN of ApoE-/- (black bars) and ApoE-/-Irf5-/- mice (white bars) at 20 weeks of age. Data are presented as fold change (n=8). Bars=mean+SEM. ApoE indicates apolipoprotein E-deficient; IRF, interferon regulatory factor; and PALN, para-aortic lymph nodes. **P<0.01; ***P<0.001.CC BY · PubMed Central
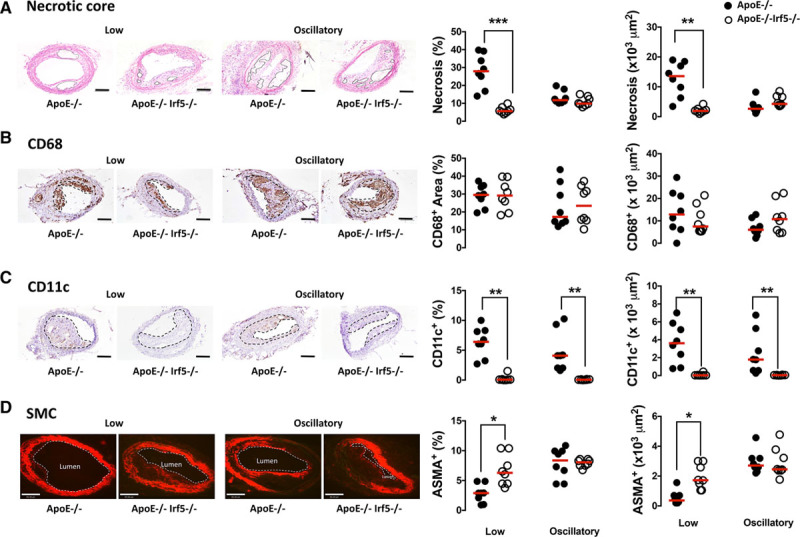
Figure 4. IRF5 deficiency decreases necrotic core formation and CD11c expression in shear stress-modulated lesions. ApoE-/- (black circles) and ApoE-/-Irf5-/- mice (white circles) were placed on a high-fat diet at 17 to 18 weeks of age. After 2 weeks, a perivascular shear stress-altering cast was surgically placed around the common carotid artery and left in place for 9 weeks. A, Representative photomicrographs of carotid artery sections stained with hematoxylin and eosin. Graphs show lesional necrotic core area (defined as anuclear, afibrotic, and eosin-negative areas) (x1000 μm2 and %). Solid lines show necrotic core area. B, Representative photomicrographs of carotid sections stained with an antibody against CD68 (brown staining) and hematoxylin. Graphs show lesion area staining positive (x1000 μm2 and %) for CD68. Dotted lines denote lesion area. C, Representative photomicrographs of carotid sections stained with an antibody against CD11c (brown staining) and hematoxylin. Graphs show lesion area staining positive (x1000 μm2 and %) for CD11c. Dotted lines denote lesion area. D, Representative photomicrographs of carotid sections with an antibody against smooth muscle cell α-actin (ASMA) (Cy3-red). Graphs show aortic root lesion area staining positive (x1000 μm2 and %) for ASMA. Dotted lines denote lumen. Bars=100μm in A through C and 80 μm in D (n=8). Each circle represents the mean positive area per individual mouse. Horizontal line denotes group median. ApoE indicates apolipoprotein E-deficient; IRF, interferon regulatory factor; and SMC, smooth muscle cell. *P<0.05; **P<0.01; ***P<0.001.
Figure 4. IRF5 deficiency decreases necrotic core formation and CD11c expression in shear stress-modulated lesions. ApoE-/- (black circles) and ApoE-/-Irf5-/- mice (white circles) were placed on a high-fat diet at 17 to 18 weeks of age. After 2 weeks, a perivascular shear stress-altering cast was surgically placed around the common carotid artery and left in place for 9 weeks. A, Representative photomicrographs of carotid artery sections stained with hematoxylin and eosin. Graphs show lesional necrotic core area (defined as anuclear, afibrotic, and eosin-negative areas) (x1000 μm2 and %). Solid lines show necrotic core area. B, Representative photomicrographs of carotid sections stained with an antibody against CD68 (brown staining) and hematoxylin. Graphs show lesion area staining positive (x1000 μm2 and %) for CD68. Dotted lines denote lesion area. C, Representative photomicrographs of carotid sections stained with an antibody against CD11c (brown staining) and hematoxylin. Graphs show lesion area staining positive (x1000 μm2 and %) for CD11c. Dotted lines denote lesion area. D, Representative photomicrographs of carotid sections with an antibody against smooth muscle cell α-actin (ASMA) (Cy3-red). Graphs show aortic root lesion area staining positive (x1000 μm2 and %) for ASMA. Dotted lines denote lumen. Bars=100μm in A through C and 80 μm in D (n=8). Each circle represents the mean positive area per individual mouse. Horizontal line denotes group median. ApoE indicates apolipoprotein E-deficient; IRF, interferon regulatory factor; and SMC, smooth muscle cell. *P<0.05; **P<0.01; ***P<0.001.CC BY · PubMed Central
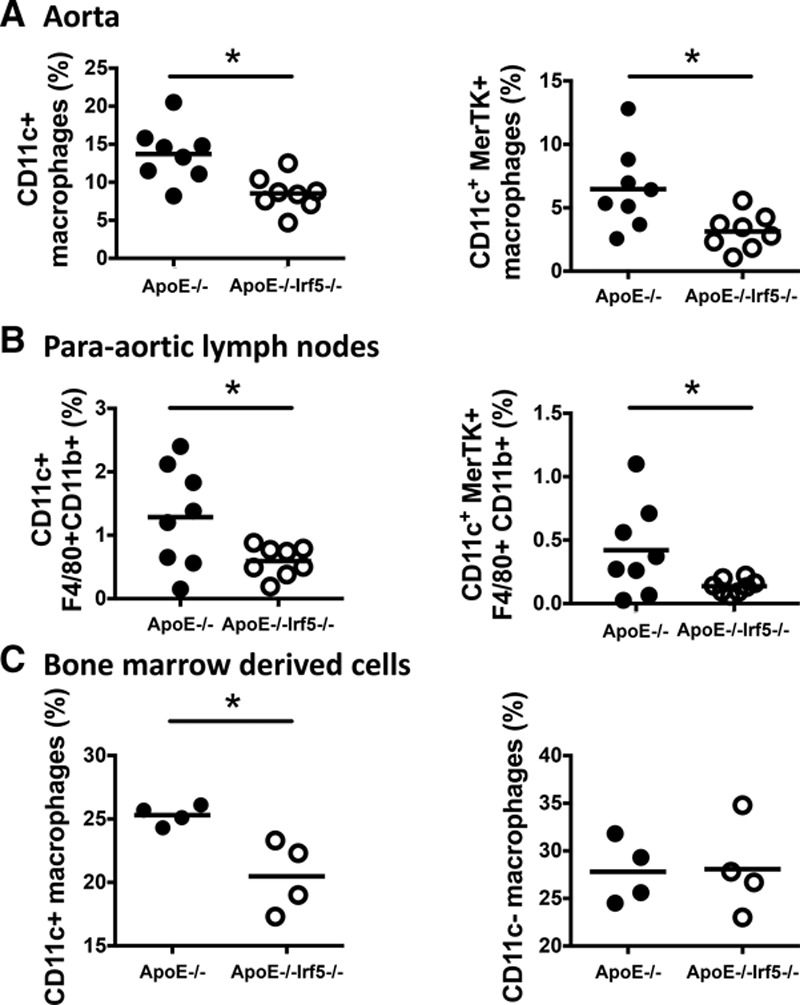
Figure 5. IRF5 affects myeloid cell phenotype in the aorta, para-aortic lymph nodes, and in vitro bone marrow cultures. Aortas, PALNs, and bones were harvested from 20- to 24-week-old ApoE-/- and ApoE-/-Irf5-/- mice. Single-cell suspensions were then stained with antibodies against myeloid cell markers and analyzed by flow cytometry. Dead cells and debris were excluded from the analysis, and cells were gated on CD45+ cells. A, Graphs show the numbers of aortic CD11c+ macrophages (gated as CD45+CD11b+F4/80+cells or as CD45+CD11b+F4/80+MerTK+), expressed as a percentage of CD45+ cells (n=8). B, Graphs show the numbers of CD11c+ macrophages in the PALNs, expressed as a percentage of CD45+ cells (n=8). C, Graphs show the numbers of CD11c+- and CD11c- expressing macrophages in GM-CSF-derived macrophage cultures in vitro, expressed as a percentage of CD45+ cells (n=4). Each circle represents an individual mouse. Horizontal line denotes group mean. ApoE indicates apolipoprotein E-deficient; IRF, interferon regulatory factor; MerTK, tyrosine-protein kinase Mer; and PALN, para-aortic lymph nodes. *P<0.05.
Figure 5. IRF5 affects myeloid cell phenotype in the aorta, para-aortic lymph nodes, and in vitro bone marrow cultures. Aortas, PALNs, and bones were harvested from 20- to 24-week-old ApoE-/- and ApoE-/-Irf5-/- mice. Single-cell suspensions were then stained with antibodies against myeloid cell markers and analyzed by flow cytometry. Dead cells and debris were excluded from the analysis, and cells were gated on CD45+ cells. A, Graphs show the numbers of aortic CD11c+ macrophages (gated as CD45+CD11b+F4/80+cells or as CD45+CD11b+F4/80+MerTK+), expressed as a percentage of CD45+ cells (n=8). B, Graphs show the numbers of CD11c+ macrophages in the PALNs, expressed as a percentage of CD45+ cells (n=8). C, Graphs show the numbers of CD11c+- and CD11c- expressing macrophages in GM-CSF-derived macrophage cultures in vitro, expressed as a percentage of CD45+ cells (n=4). Each circle represents an individual mouse. Horizontal line denotes group mean. ApoE indicates apolipoprotein E-deficient; IRF, interferon regulatory factor; MerTK, tyrosine-protein kinase Mer; and PALN, para-aortic lymph nodes. *P<0.05.CC BY · PubMed Central
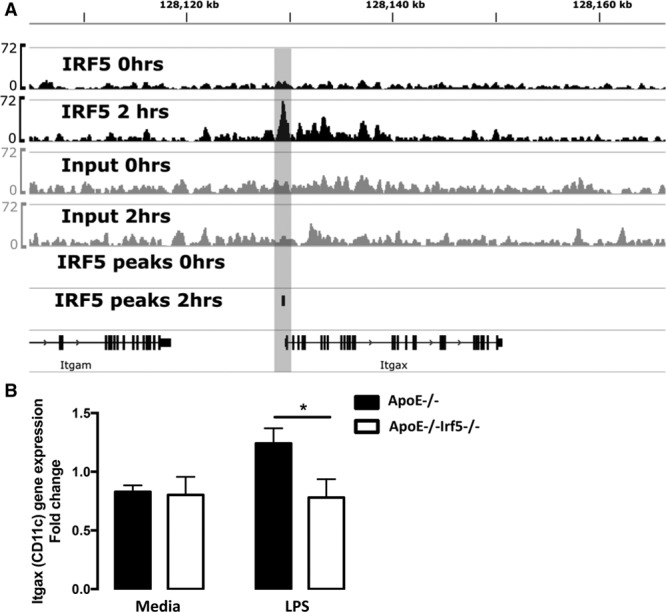
Figure 6. IRF5 regulates CD11c expression. A, Chromatin immunoprecipitation and next-generation sequencing (ChIP-seq) of IRF5 binding sites from unstimulated and LPS-stimulated GM-CSF bone marrow-derived cells revealed specific binding of the transcription factor to the promoter region of ITGAX in GM-CSF-cultured bone marrow-derived macrophages. Notably, the binding of IRF5 to the ITGAX gene loci is dependent on LPS stimulation, with recruitment of IRF5, as detected by peak calling with MACS2, occurring in stimulated macrophages but not in untreated cells. B, Graph shows the fold change of CD11c gene expression in unstimulated or LPS-stimulated GM-CSF bone marrow-derived cells from ApoE-/- (black bars) or ApoE-/-Irf5-/- (white bars) mice. CD11c gene expression is downregulated in GM-CSF-matured bone marrow-derived macrophages from IRF5-deficient mice upon LPS stimulation (n=6 to 10). Data are presented as mean±SEM. ApoE indicates apolipoprotein E-deficient; GM-CSF, granulocyte-macrophage colony-stimulating factor; IRF, interferon regulatory factor; Itgb3, integrin-β3; and LPS, lipopolysaccharide. *P<0.05.
Figure 6. IRF5 regulates CD11c expression. A, Chromatin immunoprecipitation and next-generation sequencing (ChIP-seq) of IRF5 binding sites from unstimulated and LPS-stimulated GM-CSF bone marrow-derived cells revealed specific binding of the transcription factor to the promoter region of ITGAX in GM-CSF-cultured bone marrow-derived macrophages. Notably, the binding of IRF5 to the ITGAX gene loci is dependent on LPS stimulation, with recruitment of IRF5, as detected by peak calling with MACS2, occurring in stimulated macrophages but not in untreated cells. B, Graph shows the fold change of CD11c gene expression in unstimulated or LPS-stimulated GM-CSF bone marrow-derived cells from ApoE-/- (black bars) or ApoE-/-Irf5-/- (white bars) mice. CD11c gene expression is downregulated in GM-CSF-matured bone marrow-derived macrophages from IRF5-deficient mice upon LPS stimulation (n=6 to 10). Data are presented as mean±SEM. ApoE indicates apolipoprotein E-deficient; GM-CSF, granulocyte-macrophage colony-stimulating factor; IRF, interferon regulatory factor; Itgb3, integrin-β3; and LPS, lipopolysaccharide. *P<0.05.CC BY · PubMed Central
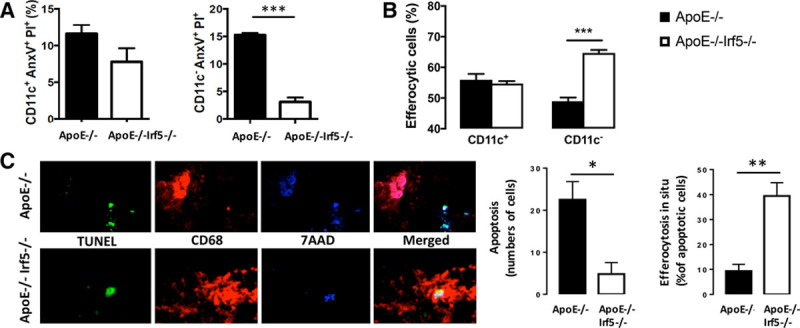
Figure 7. IRF5 deficiency reduces cellular apoptosis and increases efferocytosis. Bone marrow cells from ApoE-/- (black bars) and ApoE-/-Irf5-/- (white bars) mice 16 to 20 weeks of age were cultured in GM-CSF for 7 days, and their ability to undergo apoptosis and to perform efferocytosis was assessed. A, Graph shows percentage of CD11c+ and CD11c- cells staining positive for propidium iodide and Annexin V after LPS stimulation and ultraviolet light exposure (n=8). B, Graph shows percentage of apoptotic Jurkat cell uptake by CD11c+ and CD11c- macrophages (n=8). C, Representative images of perivascular flow-modifying cast-induced carotid lesions in ApoE-/- and ApoE-/-Irf5-/- mice stained with an antibody against CD68 (red) and TUNEL stained (green) and DNA (blue). Graphs show number of apoptotic cells (left) and percentage (right) of apoptotic cells undergoing efferocytosis in situ (n=4 to 5). Data are presented as mean±SEM. Black bars, ApoE-/-.. White bars, ApoE-/-Irf5-/-. ApoE indicates apolipoprotein E-deficient; and IRF, interferon regulatory factor. *P<0.05; **P<0.01; ***P<0.001.
Figure 7. IRF5 deficiency reduces cellular apoptosis and increases efferocytosis. Bone marrow cells from ApoE-/- (black bars) and ApoE-/-Irf5-/- (white bars) mice 16 to 20 weeks of age were cultured in GM-CSF for 7 days, and their ability to undergo apoptosis and to perform efferocytosis was assessed. A, Graph shows percentage of CD11c+ and CD11c- cells staining positive for propidium iodide and Annexin V after LPS stimulation and ultraviolet light exposure (n=8). B, Graph shows percentage of apoptotic Jurkat cell uptake by CD11c+ and CD11c- macrophages (n=8). C, Representative images of perivascular flow-modifying cast-induced carotid lesions in ApoE-/- and ApoE-/-Irf5-/- mice stained with an antibody against CD68 (red) and TUNEL stained (green) and DNA (blue). Graphs show number of apoptotic cells (left) and percentage (right) of apoptotic cells undergoing efferocytosis in situ (n=4 to 5). Data are presented as mean±SEM. Black bars, ApoE-/-.. White bars, ApoE-/-Irf5-/-. ApoE indicates apolipoprotein E-deficient; and IRF, interferon regulatory factor. *P<0.05; **P<0.01; ***P<0.001.CC BY · PubMed Central
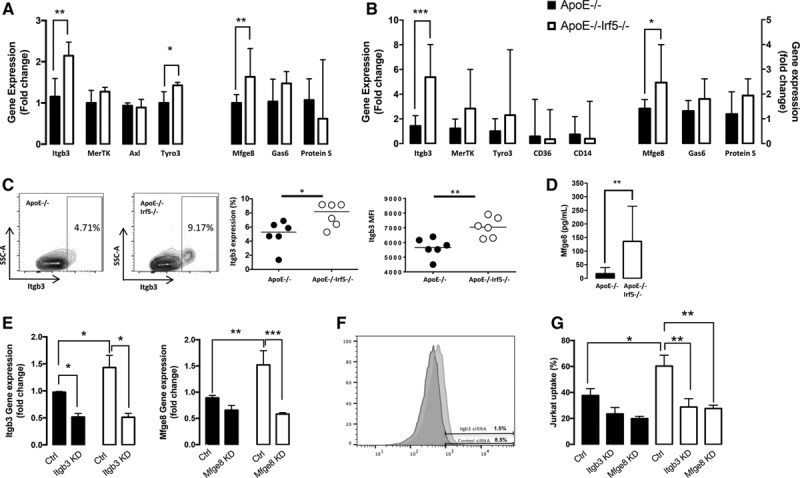
Figure 8. IRF5 deficiency increases efferocytosis by CD11c- cells by an upregulation of Itgb3 and Mfge8. A, Gene expression (shown as fold change) of efferocytosis regulating receptors (Itgb3, MerTK, Axl, and Tyro3) and efferocytosis-regulating bridging molecules (Mfge8, Gas6, and Protein S) in GM-CSF-matured macrophage cell cultures from ApoE-/- (black bars) and ApoE-/-Irf5-/- (white bars) mice 16 to 20 weeks of age (n=6 to 8). Data presented as median and IQR. B, Gene expression (shown as fold change) of efferocytosis-regulating receptors (Itgb3, MerTK, Tyro3, CD36, and CD14) and receptor ligands (Mfge8, Gas6, and Protein S) in the aorta of 20-week-old ApoE-/- and ApoE-/-Irf5-/- mice (n=5 to 8). Data presented as median and IQR. C, CD11c- GM-CSF-matured macrophages from ApoE-/- and ApoE-/-Irf5-/- mice were stained with an antibody against Itgb3. Representative plots show Itgb3 expression on CD11c- cells and graphs show numbers (left) of CD11c− cells expressing Itgb3 and the median fluorescent intensity (MFI) of Itgb3 staining (right) (n=6). Horizontal bars denote group median. D, Bone marrow-derived cells from ApoE-/- and ApoE-/-Irf5-/- mice were cultured in GM-CSF for 7 days, and Mfge8 released into the supernatant was assessed by ELISA (n=8). Data are presented as median and IQR. E, Gene expression level (fold change) of Itgb3 (left) and Mfge8 (right) in GM-CSF-matured macrophages from ApoE-/- (black bars) and ApoE-/-Irf5-/- (white bars) mice after transfection with siRNA against Itgb3, Mfge8, or a control siRNA. Graphs show mean and SEM (n=3). F, Histogram overlay of Itgb3 protein expression, as assessed by flow cytometry, on GM-CSF-matured macrophages after transfection with siRNA against Itgb3 (red) or control (blue). G, Percentage of apoptotic Jurkat cell uptake by GM-CSF-cultured macrophages from ApoE-/- (black bars) and ApoE-/-Irf5-/- (white bars) mice after transfection with siRNA against Itgb3, Mfge8, or a control siRNA. Graphs show mean and SEM (n=4). ApoE indicates apolipoprotein E-deficient; Ctrl, control; GM-CSF, granulocyte-macrophage colony-stimulating factor; IRF, interferon regulatory factor; Itgb3, integrin-β3; MerTK, tyrosine-protein kinase Mer; and Mfge8, milk fat globule-epidermal growth factor 8 protein. *P<0.05; **P<0.01; ***P<0.001.
Figure 8. IRF5 deficiency increases efferocytosis by CD11c- cells by an upregulation of Itgb3 and Mfge8. A, Gene expression (shown as fold change) of efferocytosis regulating receptors (Itgb3, MerTK, Axl, and Tyro3) and efferocytosis-regulating bridging molecules (Mfge8, Gas6, and Protein S) in GM-CSF-matured macrophage cell cultures from ApoE-/- (black bars) and ApoE-/-Irf5-/- (white bars) mice 16 to 20 weeks of age (n=6 to 8). Data presented as median and IQR. B, Gene expression (shown as fold change) of efferocytosis-regulating receptors (Itgb3, MerTK, Tyro3, CD36, and CD14) and receptor ligands (Mfge8, Gas6, and Protein S) in the aorta of 20-week-old ApoE-/- and ApoE-/-Irf5-/- mice (n=5 to 8). Data presented as median and IQR. C, CD11c- GM-CSF-matured macrophages from ApoE-/- and ApoE-/-Irf5-/- mice were stained with an antibody against Itgb3. Representative plots show Itgb3 expression on CD11c- cells and graphs show numbers (left) of CD11c− cells expressing Itgb3 and the median fluorescent intensity (MFI) of Itgb3 staining (right) (n=6). Horizontal bars denote group median. D, Bone marrow-derived cells from ApoE-/- and ApoE-/-Irf5-/- mice were cultured in GM-CSF for 7 days, and Mfge8 released into the supernatant was assessed by ELISA (n=8). Data are presented as median and IQR. E, Gene expression level (fold change) of Itgb3 (left) and Mfge8 (right) in GM-CSF-matured macrophages from ApoE-/- (black bars) and ApoE-/-Irf5-/- (white bars) mice after transfection with siRNA against Itgb3, Mfge8, or a control siRNA. Graphs show mean and SEM (n=3). F, Histogram overlay of Itgb3 protein expression, as assessed by flow cytometry, on GM-CSF-matured macrophages after transfection with siRNA against Itgb3 (red) or control (blue). G, Percentage of apoptotic Jurkat cell uptake by GM-CSF-cultured macrophages from ApoE-/- (black bars) and ApoE-/-Irf5-/- (white bars) mice after transfection with siRNA against Itgb3, Mfge8, or a control siRNA. Graphs show mean and SEM (n=4). ApoE indicates apolipoprotein E-deficient; Ctrl, control; GM-CSF, granulocyte-macrophage colony-stimulating factor; IRF, interferon regulatory factor; Itgb3, integrin-β3; MerTK, tyrosine-protein kinase Mer; and Mfge8, milk fat globule-epidermal growth factor 8 protein. *P<0.05; **P<0.01; ***P<0.001.CC BY · PubMed Central

Verification

Claims the paper makes

The claims and statistics of this paper haven’t been checked yet.

Run the check — free, no account needed. It reads the open-access text and checks the sources it cites.

A few free checks a day · papers already verified open instantly · results are public

Claims other papers make about this one

Each is checked against this paper’s own text: does it say what the citing paper says it does?

Self-check

Percentages, sums and reported differences re-computed from the paper’s own numbers.

The self-check needs the paper’s full text.

Citations

Cites

Show all 40 references

Cited by

Sorted by citations

See all 117

Metadata

Authors
Seneviratne, A. N., Edsfeldt, A., Cole, J. E., Kassiteridi, C., Swart, M., Park, I., Green, P., Khoyratty, T., Saliba, D., Goddard, M. E., Sansom, S. N., Goncalves, I., Krams, R., Udalova, I. A., & Monaco, C.
Affiliations
  • Queen Mary University of London (GB)
  • From Kennedy Institute of Rheumatology, Nuffield Department of Orthopaedics, Rheumatology and Musculoskeletal Sciences, University of Oxford, United Kingdom (A.N.S., A.E., J.E.C., C.K., M.S., I.P., P.G., T.K., D.S., M.E.G., S.N.S., I.A.U., C.M.); Department of Bioengineering, Imperial College London, United Kingdom (A.N.S., R.K.); Experimental Cardiovascular Research Unit, Clinical Research Centre, Clinical Sciences Malmö, Lund University, Sweden (A.E., I.G.); Department of Cardiology, Skåne...
Corresponding author
Monaco, Claudia
Venue
Circulation
Published
2017-09-19
Volume
136
Issue
12
Pages
1140-1154
ISSN
  • 0009-7322 (ISSN-L)
  • 1524-4539
OpenAlex
W2735394628
Cited by
117
References
40
Citations by year
2026: 11 · 2025: 21 · 2024: 12 · 2023: 8 · 2022: 15 · 2021: 16 · 2020: 14 · 2019: 10 · 2018: 9 · 2017: 1
FWCI
4.21
Type
journal article
Language
en
Open access
Licence
cc-by
Locations
  • Circulation (publishedVersion, cc-by)
  • Europe PMC (PubMed Central) (publishedVersion, cc-by)
  • PubMed Central (publishedVersion, cc-by)
  • PubMed (publishedVersion)
  • Lund University Publications (Lund University) (submittedVersion, cc-by)
  • Queen Mary Research Online (Queen Mary University of London) (submittedVersion, cc-by)
  • Spiral (Imperial College London) (submittedVersion, other-oa)
Funders
  • Kennedy Trust for Rheumatology Research (KENN161701)
  • British Heart Foundation (PG/15/49/31595, RG/11/13/29055)
  • Novo Nordisk Fonden (NNF15SA0018346, NNF15SA0018486)
Topics
  • Life Sciences › Immunology and Microbiology › Immunology › Atherosclerosis and Cardiovascular Diseases
  • Life Sciences › Immunology and Microbiology › Immunology › Phagocytosis and Immune Regulation
  • Life Sciences › Biochemistry, Genetics and Molecular Biology › Biochemistry › Cholesterol and Lipid Metabolism
Keywords
IRF5, atherosclerosis, necrotic core, efferocytosis, CD11c+ macrophages, CD61, MFG-E8, vulnerable plaque, shear stress, ApoE-deficient mice, transcriptional regulation
MeSH terms
Animals, Aorta, Apolipoproteins E, Bone Marrow Cells, Cells, Cultured, Immunohistochemistry, Lymph Nodes, Macrophages, Mice, Inbred C57BL, Necrosis, Phagocytosis, Mice, Knockout, Shear Strength, CD11c Antigen, Integrin beta3, Atherosclerosis, Interferon Regulatory Factors, Mice

About these checks

Registry, retraction, Cites and statistics results are computed, not judged, with one exception: a printed reference that no index lists is read once by a model before it counts as a citation error. Claims are extracted by a model and kept only when their quote appears verbatim in the text; each cited source is then checked, with a model’s help, for whether it says what the claim relies on. Those verdicts can be wrong — read the claim’s quote and the cited source before relying on one.

Statistics and arithmetic are recomputed, not judged.

Confidence bands are shown only for fields calibrated on our annotated test set. None is calibrated yet, so no band is shown.

What counts as a claim ›How we measure confidence ›How we check this ›

Are you an author, or do you see a problem with this page? Request a review