CoChat

Harmonizing and aligning M/EEG datasets with covariance-based techniques to enhance predictive regression modeling

Open access

Published version of a preprint

The DOI matches its Crossref record; 65 of the 65 references it cites were found in a registry or an index.

Abstract

Abstract Neuroscience studies face challenges in gathering large datasets, which limits the use of machine learning (ML) approaches. One possible solution is to incorporate additional data from large public datasets; however, data collected in different contexts often exhibit systematic differences called dataset shifts. Various factors, for example, site, device type, experimental protocol, or social characteristics, can lead to substantial divergence of brain signals that can hinder the success of ML across datasets. In this work, we focus on dataset shifts in recordings of brain activity using MEG and EEG. State-of-the-art predictive approaches on magneto- and electroencephalography (M/EEG) signals classically represent the data by covariance matrices. Model-based dataset alignment methods can leverage the geometry of covariance matrices, leading to three steps: re-centering, re-scaling, and rotation correction. This work explains theoretically how differences in brain activity, anatomy, or device configuration lead to certain shifts in data covariances. Using controlled simulations, the different alignment methods are evaluated. Their practical relevance is evaluated for brain age prediction on one MEG dataset (Cam-CAN, n = 646) and two EEG datasets (TUAB, n = 1385; LEMON, n = 213). Among the same dataset (Cam-CAN), when training and test recordings were from the same subjects but performing different tasks, paired rotation correction was essential (δR2=+0.13 (rest-passive) or +0.17 (rest-smt)). When in addition to different tasks we included unseen subjects, re-centering led to improved performance (δR2=+0.096 for rest-passive, δR2=+0.045 for rest-smt). For generalization to an independent dataset sampled from a different population and recorded with a different device, re-centering was necessary to achieve brain age prediction performance close to within dataset prediction performance. This study demonstrates that the generalization of M/EEG-based regression models across datasets can be substantially enhanced by applying domain adaptation procedures that can statistically harmonize diverse datasets.

Overview

The claims and statistics of this paper haven’t been checked yet.

Free: it reads the open-access text and checks the first 5 claims that cite a source we can check. Create a free account to check every claim.

A few free checks a day · papers already verified open instantly · results are public

Integrity signals

Registry

Crossref · 10.1162/imag_a_00040

Cites

65 of 65 references verified0 citation errors · 0 not checkable

Statistics

Figures

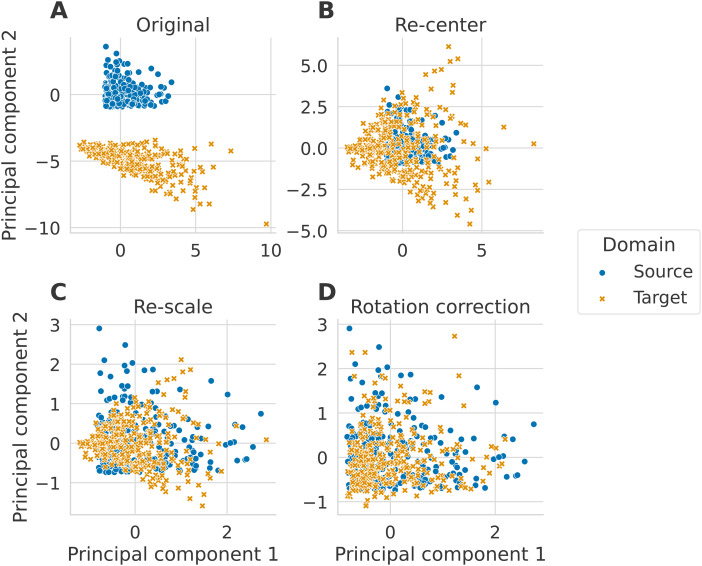
Fig. 1. Alignment steps illustrated on simulated data. The three alignment steps are applied to data simulated following the generative model, as detailed in Section 3.1. We set the size of the matrices to P=2 and generated N=300 matrices in each domain. Each new step is applied on top of the previous one. The plots correspond to the two first principal components of the tangent vectors. (A) The simulated data are plotted on the tangent space before any alignment steps. (B) The original simulated data are centered to a common point, (C), then their distributions are equalized, and (D) finally, a rotation correction is applied.
Fig. 1. Alignment steps illustrated on simulated data. The three alignment steps are applied to data simulated following the generative model, as detailed in Section 3.1. We set the size of the matrices to P=2 and generated N=300 matrices in each domain. Each new step is applied on top of the previous one. The plots correspond to the two first principal components of the tangent vectors. (A) The simulated data are plotted on the tangent space before any alignment steps. (B) The original simulated data are centered to a common point, (C), then their distributions are equalized, and (D) finally, a rotation correction is applied.CC BY · PubMed Central
Fig. 2. Pipeline for regression modeling with M/EEG with different dataset harmonization steps. For every subject, we summarize the M/EEG recording by the covariance matrix after performing artifact cleaning (Section 3.2.1). The covariances computation, alignments steps, projection to the tangent space, and vectorization steps are done separately for seven frequency bands of Table 3. Alignment steps detailed in Section 2.3 are computed from the covariance distribution across all subjects. The re-center and re-scale steps are performed separately for source and target datasets. The Procrustes steps combine information across source and target datasets. Finally, the seven resulting tangent vectors are concatenated to form one vector per subject used for regression.
Fig. 2. Pipeline for regression modeling with M/EEG with different dataset harmonization steps. For every subject, we summarize the M/EEG recording by the covariance matrix after performing artifact cleaning (Section 3.2.1). The covariances computation, alignments steps, projection to the tangent space, and vectorization steps are done separately for seven frequency bands of Table 3. Alignment steps detailed in Section 2.3 are computed from the covariance distribution across all subjects. The re-center and re-scale steps are performed separately for source and target datasets. The Procrustes steps combine information across source and target datasets. Finally, the seven resulting tangent vectors are concatenated to form one vector per subject used for regression.CC BY · PubMed Central
Fig. 3. Alignment method comparison across simulated dataset shift scenarios (R² score). Alignment methods (indicated by color) were evaluated on four different scenarios with an increasing shift. We generated N=300 matrices per domain to have data sets of the magnitude of real EEG datasets that would be considered as medium to large in terms of operational costs and curation effort. Error bars show standard deviations of the metric obtained with 50 random repetitions. The dashed vertical gray lines on (B) and (D) indicate the fixed parameter’s value of the source set. Panel (A) displays the performance achieved when the target covariance matrices were created by multiplying the source mixing matrix with an SPD matrix: A^(T)=B^αA^(S) with B∈SP⁺. All methods that included re-centering the distributions on the same reference point performed well. (B) Displays the performance achieved when the dispersion of covariances differs between source and distributions (σp≠1). Here, the re-scaling step was essential to align the distributions correctly. (C) In this scenario, A^(S)≠A^(T), which led to a translation and a rotation of the target set compared to the source set. Re-centering was not insufficient, and a rotation correction was needed to achieve good performance. Interestingly, while Procrustes paired performed well, the unpaired correction broke as the difference between the mixing matrices increased. (D) In this scenario, different levels of individual noise were added to the mixing matrices of both domains. For low σA^(T) values, all methods except the unpaired rotation correction performed similarly with R² scores decreasing slowly. For higher values, the scores dropped, and correcting the rotation with the paired method performed best.
Fig. 3. Alignment method comparison across simulated dataset shift scenarios (R² score). Alignment methods (indicated by color) were evaluated on four different scenarios with an increasing shift. We generated N=300 matrices per domain to have data sets of the magnitude of real EEG datasets that would be considered as medium to large in terms of operational costs and curation effort. Error bars show standard deviations of the metric obtained with 50 random repetitions. The dashed vertical gray lines on (B) and (D) indicate the fixed parameter’s value of the source set. Panel (A) displays the performance achieved when the target covariance matrices were created by multiplying the source mixing matrix with an SPD matrix: A^(T)=B^αA^(S) with B∈SP⁺. All methods that included re-centering the distributions on the same reference point performed well. (B) Displays the performance achieved when the dispersion of covariances differs between source and distributions (σp≠1). Here, the re-scaling step was essential to align the distributions correctly. (C) In this scenario, A^(S)≠A^(T), which led to a translation and a rotation of the target set compared to the source set. Re-centering was not insufficient, and a rotation correction was needed to achieve good performance. Interestingly, while Procrustes paired performed well, the unpaired correction broke as the difference between the mixing matrices increased. (D) In this scenario, different levels of individual noise were added to the mixing matrices of both domains. For low σA^(T) values, all methods except the unpaired rotation correction performed similarly with R² scores decreasing slowly. For higher values, the scores dropped, and correcting the rotation with the paired method performed best.CC BY · PubMed Central
Fig. 4. Impact of data alignment on age prediction across different tasks on the same subjects from Cam-CAN dataset (R² score). Alignment methods comparison for three different source-target tasks using 2000 repeat-bootstrap to select the subjects. Both domains contained the same subjects, only their task was different. Models are depicted along the y-axis, and standard boxplots represent their associated R² score. The dashed black lines represent chance-level performance. (A) Generalization of age prediction regression model from resting state to the passive task. Re-centering and the paired rotation correction led to an increased R² score with no obvious benefits for additional re-scaling. (B) The regression model was trained on resting-state data, and predictions were made on the recordings of the somatosensory task. Re-centering the data led to slightly improved R² scores. Again, the re-scaling step did not lead to further improvements. Correcting the rotation with the paired method contributed to improving 99% of the splits in comparison to only re-centering. (C) Here, we used the data from the passive task as the source domain and the somatosensory task as the target domain. Re-centering and re-scaling steps did not affect the prediction performance. The paired rotation correction improved the scores in all splits.
Fig. 4. Impact of data alignment on age prediction across different tasks on the same subjects from Cam-CAN dataset (R² score). Alignment methods comparison for three different source-target tasks using 2000 repeat-bootstrap to select the subjects. Both domains contained the same subjects, only their task was different. Models are depicted along the y-axis, and standard boxplots represent their associated R² score. The dashed black lines represent chance-level performance. (A) Generalization of age prediction regression model from resting state to the passive task. Re-centering and the paired rotation correction led to an increased R² score with no obvious benefits for additional re-scaling. (B) The regression model was trained on resting-state data, and predictions were made on the recordings of the somatosensory task. Re-centering the data led to slightly improved R² scores. Again, the re-scaling step did not lead to further improvements. Correcting the rotation with the paired method contributed to improving 99% of the splits in comparison to only re-centering. (C) Here, we used the data from the passive task as the source domain and the somatosensory task as the target domain. Re-centering and re-scaling steps did not affect the prediction performance. The paired rotation correction improved the scores in all splits.CC BY · PubMed Central
Fig. 5. Impact of data alignment on age prediction across different tasks for different subjects from Cam-CAN dataset (R² score). Alignment methods comparison for three different source-target tasks using 100 stratified Monte Carlo cross-validation (shuffle split) iterations to determine which subjects form the source and the target sets. We depict the models along the y-axis and represent the R² scores with standard boxplots. The dashed black lines represent chance-level performance. (A) The model was trained on the rest task, and predictions were made on the passive task recordings. When re-centering source and target distributions, prediction performance substantially improved, whereas re-scaling did change performance. (B) The target set was composed of recordings from the somatosensory task. The improvement of the re-centering step was smaller but still present. Re-scaling, still, did not lead to obvious improvements. (C) In the last Panel, the passive task was the source domain, and the somatosensory task was the target. In this case, aligning was not helpful and led to the same performance as not performing any alignment.
Fig. 5. Impact of data alignment on age prediction across different tasks for different subjects from Cam-CAN dataset (R² score). Alignment methods comparison for three different source-target tasks using 100 stratified Monte Carlo cross-validation (shuffle split) iterations to determine which subjects form the source and the target sets. We depict the models along the y-axis and represent the R² scores with standard boxplots. The dashed black lines represent chance-level performance. (A) The model was trained on the rest task, and predictions were made on the passive task recordings. When re-centering source and target distributions, prediction performance substantially improved, whereas re-scaling did change performance. (B) The target set was composed of recordings from the somatosensory task. The improvement of the re-centering step was smaller but still present. Re-scaling, still, did not lead to obvious improvements. (C) In the last Panel, the passive task was the source domain, and the somatosensory task was the target. In this case, aligning was not helpful and led to the same performance as not performing any alignment.CC BY · PubMed Central
Fig. 6. Impact of data alignment on age prediction across different EEG datasets (R² score). Data from the TUAB dataset were used as the source domain, and from the LEMON data as the target domain. We compare the alignment methods across 2000 bootstrap iterations on the source data (n = 1385). The target set was always the same (n = 213). The methods are represented along the y-axis, and we depict their associated R² scores with standard boxplots. The dashed black lines represent chance-level performance. (A) Results of alignment methods combined with the Riemannian approach of Equation 11 (as for all the results we have previously presented). Without alignment, the prediction made on the LEMON data led to R² scores far lower than what was reported in Engemann et al. (2022) (10-fold cross-validation on LEMON data only: 0.54±0.13 represented by the dashed gray line). When both domains are re-centered to identity, we reached performances similar to when the model is trained on LEMON. Re-scaling did not visibly improve results. (B) Results when the regression model follows the SPoC approach. Not aligning led again to poor R² scores. Unlike the first panel, the z-score method improved the predictions similarly to re-centering. Re-scaling helped to reach performances on par with the Riemannian model trained on LEMON.
Fig. 6. Impact of data alignment on age prediction across different EEG datasets (R² score). Data from the TUAB dataset were used as the source domain, and from the LEMON data as the target domain. We compare the alignment methods across 2000 bootstrap iterations on the source data (n = 1385). The target set was always the same (n = 213). The methods are represented along the y-axis, and we depict their associated R² scores with standard boxplots. The dashed black lines represent chance-level performance. (A) Results of alignment methods combined with the Riemannian approach of Equation 11 (as for all the results we have previously presented). Without alignment, the prediction made on the LEMON data led to R² scores far lower than what was reported in Engemann et al. (2022) (10-fold cross-validation on LEMON data only: 0.54±0.13 represented by the dashed gray line). When both domains are re-centered to identity, we reached performances similar to when the model is trained on LEMON. Re-scaling did not visibly improve results. (B) Results when the regression model follows the SPoC approach. Not aligning led again to poor R² scores. Unlike the first panel, the z-score method improved the predictions similarly to re-centering. Re-scaling helped to reach performances on par with the Riemannian model trained on LEMON.CC BY · PubMed Central
Fig. 7. Impact of alignment of different EEG datasets on their SPoC patterns and source powers. TUAB data were used as the source domain, and LEMON data as the target domain. Alignment refers to re-centering the source and the target distribution by whitening them respectively by their geometric mean. To obtain these figures, data were filtered in the alpha band. We included 19 channels (15 commons and 4 with similar locations on the scalp) in both datasets. (A) Topographic maps of the five first SPoC source patterns without alignment (first row) and target patterns without alignment (second row). The third row corresponds to the aligned source patterns adjusted with the target whitening inverse filter. These are the patterns applied to unaligned target data to obtain the target powers with alignment. The color map is normalized across each row. (B) Scatter plot of the target log powers as a function of the source log powers without and with alignment averaged across subjects. The dashed black line is the identity line. Alignment makes target and source log-powers more comparable.
Fig. 7. Impact of alignment of different EEG datasets on their SPoC patterns and source powers. TUAB data were used as the source domain, and LEMON data as the target domain. Alignment refers to re-centering the source and the target distribution by whitening them respectively by their geometric mean. To obtain these figures, data were filtered in the alpha band. We included 19 channels (15 commons and 4 with similar locations on the scalp) in both datasets. (A) Topographic maps of the five first SPoC source patterns without alignment (first row) and target patterns without alignment (second row). The third row corresponds to the aligned source patterns adjusted with the target whitening inverse filter. These are the patterns applied to unaligned target data to obtain the target powers with alignment. The color map is normalized across each row. (B) Scatter plot of the target log powers as a function of the source log powers without and with alignment averaged across subjects. The dashed black line is the identity line. Alignment makes target and source log-powers more comparable.CC BY · PubMed Central

Verification

Claims the paper makes

The claims and statistics of this paper haven’t been checked yet.

Free: it reads the open-access text and checks the first 5 claims that cite a source we can check. Create a free account to check every claim.

A few free checks a day · papers already verified open instantly · results are public

Self-check

Percentages, sums and reported differences re-computed from the paper’s own numbers.

The self-check needs the paper’s full text.

Citations

Cites

Show all 65 references

Cited by

See all 17

Metadata

Authors
Mellot, A., Collas, A., Rodrigues, P. L. C., Engemann, D., & Gramfort, A.
Affiliations
  • Institut national de recherche en sciences et technologies du numérique (FR)
  • Institut polytechnique de Grenoble (FR)
  • F. Hoffmann-La Roche AG (CH)
Corresponding author
Mellot, Apolline
Venue
Imaging Neuroscience
Publisher
MIT Press
Published
2023-12
Volume
1
Pages
1-26
ISSN
2837-6056 (ISSN-L)
OpenAlex
W4388837728
Cited by
16
References
63
Citations by year
2026: 7 · 2025: 5 · 2024: 3 · 2023: 1
FWCI
2.40
Type
journal article
Language
en
Open access
Locations
  • Imaging Neuroscience (publishedVersion, cc-by)
  • bioRxiv (Cold Spring Harbor Laboratory) (acceptedVersion, cc-by)
  • PubMed Central (publishedVersion, cc-by)
  • PubMed (publishedVersion)
  • HAL (submittedVersion, cc-by)
Funders
Agence Nationale de la Recherche (ANR-20-CHIA-0016, ANR-20-THIA-0013, ANR-20-IADJ-0002)
Topics
  • Life Sciences › Neuroscience › Cognitive Neuroscience › EEG and Brain-Computer Interfaces
  • Physical Sciences › Computer Science › Artificial Intelligence › Domain Adaptation and Few-Shot Learning
  • Life Sciences › Neuroscience › Cognitive Neuroscience › Neural dynamics and brain function
Keywords
distribution shift, MEG, EEG, covariance matrix, domain adaptation, brain age prediction, cross-dataset generalization, Cam-CAN, lemon

About these checks

Registry, retraction, Cites and statistics results are computed, not judged, with one exception: a printed reference that no index lists is read once by a model before it counts as a citation error. Claims are extracted by a model and kept only when their quote appears verbatim in the text; each cited source is then checked, with a model’s help, for whether it says what the claim relies on. Those verdicts can be wrong — read the claim’s quote and the cited source before relying on one.

Statistics and arithmetic are recomputed, not judged.

Confidence bands are shown only for fields calibrated on our annotated test set. None is calibrated yet, so no band is shown.

What counts as a claim ›How we measure confidence ›How we check this ›

Are you an author, or do you see a problem with this page? Request a review

Data sources

Bibliographic data: Semantic Scholar, OpenAlex, Crossref.

Contains information from the Semantic Scholar Academic Graph Datasets, made available under the ODC Attribution License (ODC-BY 1.0).

Semantic Scholar’s data is described in: Kinney, R., et al. (2023). The Semantic Scholar Open Data Platform. arXiv:2301.10140.