

Difference-in-Differences Estimators of Intertemporal Treatment Effects
Open accessThe DOI matches its Crossref record, with a small difference in title or year; 82 of the 82 references it cites were found in a registry or an index; 28 of the 40 sources its claims cite were checked for support.
Abstract
We study treatment-effect estimation using panel data. The treatment may be nonbinary, nonabsorbing, and the outcome may be affected by treatment lags. We make a parallel-trends assumption and propose event-study estimators of the effect of being exposed to a weakly higher treatment dose for ℓ periods. We also propose normalized estimators that estimate a weighted average of the effects of the current treatment and its lags. We also analyze commonly used two-way fixed-effects regressions. Unlike our estimators, they can be biased in the presence of heterogeneous treatment effects. A local-projection version of those regressions is biased even with homogeneous effects.
Overview
CoChat Summary
TL;DR
The paper develops difference-in-differences estimators for panel data where treatment can be nonbinary, nonabsorbing, and have lagged effects, without imposing homogeneous treatment effects. It proposes reduced-form and normalized event-study estimators plus a cost-benefit parameter, shows common TWFE dynamic regressions can be biased or contaminated, and revisits banking deregulation effects.
Key findings
- The proposed \(DID_\ell\) and normalized \(DID^n_\ell\) estimators are conditionally unbiased under no-anticipation and parallel trends conditional on the period-one treatment; \(DID^n_\ell\) estimates a weighted average of the current treatment and its first \(\ell-1\) lags, and a weighted sum of \(DID_\ell\)’s yields a cost-benefit parameter interpretable as an average total effect per unit of treatment.
- In a census of 100 highly cited AER papers from 2015–2019, 26 estimate TWFE regressions, but only four have a binary-and-staggered treatment; among the 20 non-binary/non-staggered papers, 11 estimate only static TWFE and nine estimate dynamic effects using intensity-period FE, local-projection, or distributed-lag regressions.
- The paper shows those three common TWFE dynamic methods may not estimate a convex combination of the paper’s \(\delta_{g,\ell}\) effects, may violate no-sign reversal, and local-projection panel regressions are contaminated by other exposure lengths and can be biased or wrong-signed even with constant effects.
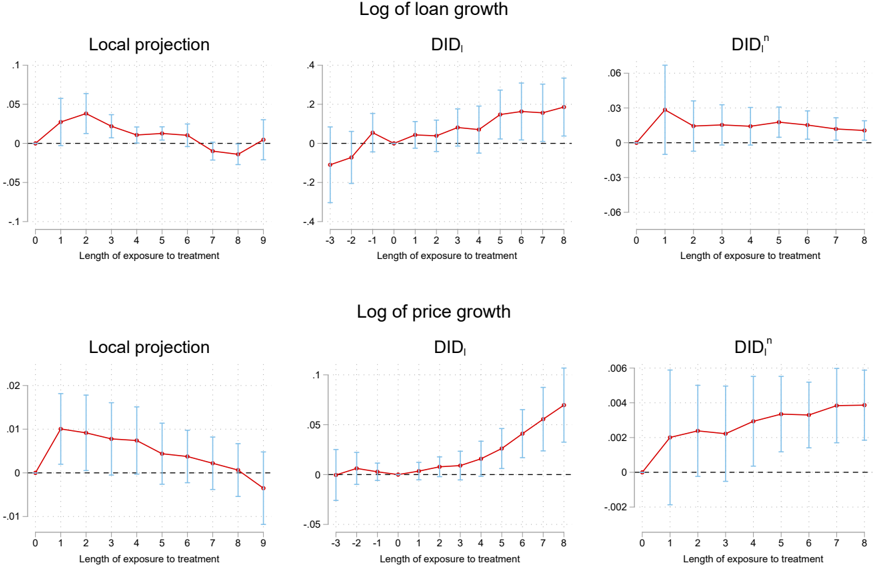
- In the banking-deregulation application, local-projection coefficients are positive and significant through \(\ell=5\), insignificant at \(\ell=6,7,9\), and significantly negative at \(\ell=8\); the paper’s \(DID_1=0.043\) (s.e. \(0.035\)), \(DID_3=0.081\) (s.e. \(0.049\)), \(DID_5=0.148\) (s.e. \(0.064\)), placebos jointly insignificant (\(p=0.400\)), and the test that \(\ell \mapsto DID^n_\ell\) is constant is not rejected (\(p=0.328\)). For house prices, \(DID_1=0.003\) (s.e. \(0.004\)), \(DID_4=0.016\) (s.e. \(0.009\)), \(DID_5=0.026\) (s.e. \(0.010\)), and placebos are jointly insignificant (\(p=0.703\)).
Methods
- Panel of \(G\) groups observed over \(T\) periods, with dynamic potential outcomes allowing current outcomes to depend on current and lagged treatments; identifying assumptions include no anticipation, parallel trends for the status-quo outcome conditional on the period-one treatment, and a no-crossing condition, plus a design restriction requiring groups with the same period-one treatment and variation in first-treatment-change timing.
- Estimators compare switchers to not-yet-switchers with the same period-one treatment; the paper aggregates group-level \(DID_{g,\ell}\)’s into event-study effects, proposes normalized versions, placebo estimators, and asymptotic inference as \(G\to\infty\) under independent groups and regularity conditions, with confidence intervals conservative unless groups are i.i.d.
- Application revisits Favara and Imbs (2015) using 1994–2005 county-level banking deregulation data; treatment is the number of restrictions lifted (0–4); eight states never deregulate, 33 deregulate once, eight twice, and one three times; 38 of 42 deregulating states first do so in 1995–1998; \(DID_1\) and \(DID_8\) apply to 905 and 773 counties, respectively, and only three placebos apply to more than 50% of the 905 counties whose treatment changes at least once.
Limitations
- The paper states that the initial-conditions problem is not accounted for in the baseline notation; Assumption 1 rules out continuous period-one treatment, extremely non-persistent treatment, and no or universal treatment change; Assumption 4 may be implausible for some baseline-treatment values; \(\delta_\ell\)’s interpretation is complicated outside Design 1; \(\delta^n_\ell\) averages different lags and individual lag slopes are not estimable under Assumptions 3–4; cost-benefit analysis requires converting outcomes to monetary equivalents and assumes linear, non-stochastic treatment costs; inference is conservative in the i.n.i.d. setup unless groups are i.i.d.; and the local-projection issues are specific to the panel Regression 2, absent in time-series local projections and in Dube et al. (2023).
- The paper states placebos may fail to detect parallel-trends violations large enough to substantially bias \(DID_\ell\); in the application, only three placebos apply to more than 50% of the 905 counties, parallel trends can only be tested over three years whereas eight years are needed for \(DID_8\), loan-volume placebos are relatively large and imprecisely estimated, and \(DID_9\)–\(DID_{11}\) are not reported because they apply to small subsamples (357, 238, and 1 county).
- Evident from the text: several application estimates are imprecise (e.g., \(DID_1=0.043\) with s.e. \(0.035\); \(DID^n_1\) is much larger but imprecisely estimated); the paper proves weights sum to less than one in binary-and-staggered designs but only finds this in the non-binary/non-staggered application without a formal proof; and the design-conditional parameters may only partially uncover the structural function mapping current, lagged, and future treatments to outcomes.
Model-written summary. Check it against the paper before relying on it.
Integrity signals
Registry
Cites
Statistics
Figures
Verification
Claims the paper makes
19 Valid · 10 Not valid · 7 Not checked · 214 Own results and interpretations
Some cited sources support this claim and some don’t — read each source’s verdict below.
In the paper
“de Chaisemartin and D'Haultfœuille (2018) and de Chaisemartin and D'Haultfœuille (2020) had already noted that in a model assuming away effects of lagged treatments on the outcome, parallel trends across groups with different baseline treatments essentially rules out time-varying effects.”
What the sources say
- Partly supportedcites de Chaisemartin and D'Haultfœuille (2018) sourceExperimental — accuracy not yet measured
Section 2.2 says that the average treatment effect among units treated at baseline must be stable over time for the Wald-DID result. But it presents this as Assumption 4, separate from the common-trends Assumption 3; it does not say that parallel trends across groups with different baseline treatments itself rules out time-varying effects. Section 2.3 instead proposes an estimator that does not require that stability assumption. (LLM, conf=0.78)
- Disputedcites de Chaisemartin and D'Haultfœuille (2020) sourceExperimental — accuracy not yet measured
Split into 2 atoms — 1 confirmed, 0 partially supported, 1 disputed, 0 misattributed, 0 unverifiable. Expand the claim to see per-atom verdicts.
Checked by a reasoning model — may be wrong.
plain- Asserted: passes — The authors put it forward as true.
- Checkable: passes — It can be checked against evidence.
- Load-bearing: passes — The paper’s conclusions depend on it.
- Based: passes — The paper gives a reason why it holds.
- Partly supported
Every source the paper cites for this claim was checked and supports it.
In the paper
“DID 1 also reduces to the DID M estimator of de Chaisemartin and D'Haultfœuille (2020).”
What the sources say
- Supportedcites de Chaisemartin and D'Haultfœuille (2020) source
Section 4 (‘An alternative estimator’) defines DID_M as the authors’ estimator and describes it as a weighted average of the component DID estimators. The citation identifies the estimator to which the citing authors say DID_1 reduces; it does not attribute their reduction result to this source. (LLM, conf=0.90)
plainstates a cause- Asserted: passes — The authors put it forward as true.
- Checkable: passes — It can be checked against evidence.
- Load-bearing: unclear — It is unclear whether the paper’s conclusions depend on it.
- Based: passes — The paper gives a reason why it holds.
- Supported
The cited sources support only part of this claim — read each source’s verdict below.
In the paper
“In non-binary and/or non-staggered designs, when all groups are untreated at period one, DID ℓ is equivalent to the estimator obtained by: 1. redefining the treatment as an indicator equal to one if group g has ever received a non-zero treatment at t , as Deryugina (2017) or Krolikowski (2018), among others, have done in their empirical analysis; 2. computing the estimator of θ es ( ℓ -1) of Calla”
What the sources say
- Partly supportedcites Callaway and Sant'Anna (2021) sourceExperimental — accuracy not yet measured
Split into 2 atoms — 1 confirmed, 1 partially supported, 0 disputed, 0 misattributed, 0 unverifiable. Expand the claim to see per-atom verdicts.
- Not checked — no full text of the sourcecites Deryugina (2017) source
- Supportedcites Krolikowski (2018) source
Split into 2 atoms — 2 confirmed, 0 partially supported, 0 disputed, 0 misattributed, 0 unverifiable. Expand the claim to see per-atom verdicts.
plain- Asserted: passes — The authors put it forward as true.
- Checkable: passes — It can be checked against evidence.
- Load-bearing: unclear — It is unclear whether the paper’s conclusions depend on it.
- Based: passes — The paper gives a reason why it holds.
- Rests on an assumption not shown here.
- Partly supported
Every source the paper cites for this claim was checked and supports it.
In the paper
“In binary and staggered designs, our DID ℓ estimators reduce to the estimators of the event-study parameters θ es ( ℓ -1) of Callaway and Sant'Anna (2021), using not-yet-treated as controls.”
What the sources say
- Supportedcites Callaway and Sant'Anna (2021) source
Section 3.1.1 (page unavailable) defines Callaway and Sant’Anna’s event-study parameter θ_es(e), with event time e measured from treatment adoption. Section 2.3 (page unavailable) explicitly allows not-yet-treated groups as controls. The statement that the citing authors’ DID_l estimators reduce to those estimators is their own comparison, not a result attributed to this source. (LLM, conf=0.86)
plainstates a cause- Asserted: passes — The authors put it forward as true.
- Checkable: passes — It can be checked against evidence.
- Load-bearing: unclear — It is unclear whether the paper’s conclusions depend on it.
- Based: passes — The paper gives a reason why it holds.
- Supported
The cited sources that could be checked couldn’t confirm or dispute this claim.
In the paper
“These findings differ sharply from those obtained by Favara and Imbs (2015).”
What the sources say
- Could not verifycites Favara and Imbs (2015) sourceExperimental — accuracy not yet measured
The cited paper’s Credit Supply and the Price of Housing section reports findings on the response of lending to branching deregulation. The citing sentence does not identify what “these findings” are, so our copy cannot establish whether they differ sharply from Favara and Imbs’s findings. (LLM, conf=0.76)
boosted- Asserted: passes — The authors put it forward as true.
- Checkable: passes — It can be checked against evidence.
- Load-bearing: passes — The paper’s conclusions depend on it.
- Based: passes — The paper gives a reason why it holds.
- Could not verify
140 more claims · 6 with their cited sources checked
Create a free account to see all 250 claims and every source verdict.
- It may state two separate claims as one. 52
- Probably not a substantial claim. 60
- Borderline: one of the tests for a substantial claim is unclear. 1
- The quote only partly states this claim. 2
Claims other papers make about this one
Each is checked against this paper’s own text: does it say what the citing paper says it does?
The cited source says what the claim attributes to it.
In the citing paper
“I estimate Equation ( 1) using the estimator developed by de Chaisemartin and D'Haultfœuille (2026), hereafter dCDH, to accommodate the possibility that websites may re-allow the OAI-SearchBot crawler after having blocked it, causing the treatment status indicator, 𝐷𝐷 𝑖𝑖,𝑡𝑡 , to switch off.”
From Opting Out of Generative AI? Training Data, Search Visibility, and the Traffic Rankings of News Publishers (2026) · cites this paper as de Chaisemartin and D'Haultfœuille (2026)
In the citing paper
“The dCDH estimator, like many modern DID estimators, constructs counterfactual outcomes from untreated units and incorporates covariates within the estimation procedure rather than through a conventional regression specification.”
From Opting Out of Generative AI? Training Data, Search Visibility, and the Traffic Rankings of News Publishers (2026) · cites this paper as de Chaisemartin & D'Haultfœuille (2026)
In the citing paper
“The dCDH estimator, however, accommodates treatment reversals, so the baseline specification retains these websites in the sample.”
From Opting Out of Generative AI? Training Data, Search Visibility, and the Traffic Rankings of News Publishers (2026) · cites this paper as de Chaisemartin C, D'Haultfœuille X (2026)
Self-check
Percentages, sums and reported differences re-computed from the paper’s own numbers.
Each contradiction between two passages listed here was confirmed by an independent check.
Rated minor: it would not touch a result — a value no result rests on, a p-value that stays on the same side of the significance level, or a conflict that is clerical, resolved elsewhere in the paper, or outside its own findings.
In the paper
§ 1.1 Placebo estimators
“One may have L pl = -1, if all groups that switch treatment do so for the first time at period 2.”
§ 1.1 Placebo estimators
“Then, let L pl = max g { min( T g -F g +1 , F g -2) } .”
Citations
Cites
How Much Should We Trust Differences-in-Differences Estimates?
Bertrand, M., Duflo, E., & Mullainathan, S. (2004) · The Quarterly Journal of Economics · doi:10.1162/003355304772839588 · Cited by 10,641
Mostly Harmless Econometrics: An Empiricist's Companion
Angrist, J. D., & Pischke, J.-S. (2009) · doi:10.1515/9781400829828 · Cited by 9,467
Difference-in-Differences with multiple time periods
Callaway, B., & Sant’Anna, P. H. C. (2021) · Journal of Econometrics · doi:10.1016/j.jeconom.2020.12.001 · Cited by 9,126
Difference-in-differences with variation in treatment timing
Goodman-Bacon, A. (2021) · Journal of Econometrics · doi:10.1016/j.jeconom.2021.03.014 · Cited by 8,046
Estimating dynamic treatment effects in event studies with heterogeneous treatment effects
Sun, L., & Abraham, S. (2021) · Journal of Econometrics · doi:10.1016/j.jeconom.2020.09.006 · Cited by 5,518
Mostly Harmless Econometrics: An Empiricist's Companion
Angrist, J. D., & Pischke, J.-S. (2008) · doi:10.2307/j.ctvcm4j72 · Cited by 5,051
Two-Way Fixed Effects Estimators with Heterogeneous Treatment Effects
de Chaisemartin, C., & D’Haultfœuille, X. (2020) · American Economic Review · doi:10.1257/aer.20181169 · Cited by 5,031
Self-citationEstimation and Inference of Impulse Responses by Local Projections
Jordà, Ò. (2005) · American Economic Review · doi:10.1257/0002828053828518 · Cited by 4,677
Identification and estimation of local average treatment effects
Imbens, G. W., & Angrist, J. D. (1994) · Econometrica · doi:10.2307/2951620 · Cited by 4,101
Robins, J. (1986) · Mathematical Modelling · doi:10.1016/0270-0255(86)90088-6 · Cited by 2,451
Cited by
Items 201–300 of 746
Gunadi, C., & Shi, Y. (2023) · BMC Public Health · doi:10.1186/s12889-023-16256-9 · Cited by 10
The intergenerational impact of electoral violence on height and human capital
Gutiérrez‐Romero, R. (2024) · Journal of Economic Behavior & Organization · doi:10.1016/j.jebo.2024.02.025 · Cited by 6
On the effects of anti-profit shifting regulations: A developing country perspective
Teles, S. L., Riedel, N., & Strohmaier, K. (2024) · Journal of Public Economics · doi:10.1016/j.jpubeco.2024.105134 · Cited by 6
The Private Equity Experiment of U.S. Banking IndustryPreprint
Kowalik, M. K., & Torna, G. (2022) · SSRN Electronic Journal · doi:10.2139/ssrn.4011362 · Cited by 6
The Employment Effects of Working Time Reductions: Sector-Level Evidence from European ReformsPreprint
Batut, C., Garnero, A., & Tondini, A. (2022) · SSRN Electronic Journal · doi:10.2139/ssrn.4226373 · Cited by 6
Access to Care and Physician-Practice Growth after the Interstate Medical Licensure CompactPreprint
Deyo, D., Ghosh, S., & Plemmons, A. (2023) · SSRN Electronic Journal · doi:10.2139/ssrn.4629647 · Cited by 9
The Challenges of Deploying an Algorithmic Pricing Tool: Evidence from AirbnbPreprint
Foroughifar, M., & Mehta, N. (2024) · SSRN Electronic Journal · doi:10.2139/ssrn.4891482 · Cited by 6
Does improved tenure security reduce fires? Evidence from the Greece land registry
Diao, L., & Song, H. (2024) · Journal of Environmental Economics and Management · doi:10.1016/j.jeem.2024.103002 · Cited by 7
Good for bad: The heterogeneous effects of export controls on firms' ESG
Liu, Q., Jia, D., Liu, H., & Wang, K. (2025) · China Economic Review · doi:10.1016/j.chieco.2025.102358 · Cited by 8
Wang, W., & Pan, Q. (2025) · Journal of Environmental Economics and Management · doi:10.1016/j.jeem.2025.103119 · Cited by 6
Luo, C., Du, Y., Yu, X., & Yan, Z. (2025) · Agricultural Economics · doi:10.1111/agec.70050 · Cited by 7
When Taylor Swift hits town: Megastar-driven effects on hotel performance
Boto‐García, D., Anguera-Torrell, O., & Escalonilla, M. (2025) · Tourism Economics · doi:10.1177/13548166251362415 · Cited by 5
Wang, Y., Xu, Z., & Liang, J. (2025) · Transportation Research Part A Policy and Practice · doi:10.1016/j.tra.2025.104751 · Cited by 14
Myint, L. (2023) · Health Services and Outcomes Research Methodology · doi:10.1007/s10742-023-00305-2 · Cited by 5
López‐Villavicencio, A., & Zoumenou, J. (2025) · Journal of Macroeconomics · doi:10.1016/j.jmacro.2025.103664 · Cited by 12
The digital world that trade created: Evidence from the information technology agreement
Ma, S., Shen, Y., & Fang, C. (2025) · Economic Analysis and Policy · doi:10.1016/j.eap.2025.06.012 · Cited by 9
Making Activation for Young Welfare Recipients Mandatory
Dahl, E. S., & Hernæs, Ø. (2022) · Labour · doi:10.1111/labr.12238 · Cited by 6
No mental retirement: estimating voluntary adult education activities of older workers
Ruhose, J., Thomsen, S. L., & Weilage, I. (2023) · Education Economics · doi:10.1080/09645292.2023.2229078 · Cited by 6
Marijuana legalization and traffic fatalities revisited
Chen, W., & French, M. T. (2023) · Southern Economic Journal · doi:10.1002/soej.12657 · Cited by 4
Chen, Y., Fan, Z., Gu, X., & Zhou, L. (2022) · Journal of Population Economics · doi:10.1007/s00148-024-01012-z · Cited by 8
Lu, J., & Chen, H. (2024) · Environmental Science and Pollution Research · doi:10.1007/s11356-024-32899-6 · Cited by 5
Perception and protection: The effect of risk exposure on demand for index insurance in Mongolia
Mogge, L., & Kraehnert, K. (2024) · Journal of Environmental Economics and Management · doi:10.1016/j.jeem.2024.103113 · Cited by 6
Wage Determination in the Shadow of the Law: The Case of Works Councilors in Germany
Goerke, L., & Pannenberg, M. (2021) · Economic and Industrial Democracy · doi:10.1177/0143831x221139331 · Cited by 7
Real Estate Transaction Taxes and Credit Supply
Koetter, M., Marek, P., & Mavropoulos, A. (2021) · Journal of Financial Stability · doi:10.1016/j.jfs.2025.101436 · Cited by 7
Talent Flows and the Geography of Knowledge Production: Causal Evidence from Multinational FirmsPreprint
Bahar, D., Choudhury, P., Signorelli, S., & Sappenfield, J. M. S. (2022) · SSRN Electronic Journal · doi:10.2139/ssrn.4005693 · Cited by 12
Freedman, S., Hollingsworth, A. J., Simon, K. I., et al. (2023) · SSRN Electronic Journal · doi:10.2139/ssrn.4631006 · Cited by 5
A Guide to Dynamic Difference-in-Differences Regressions for Political ScientistsPreprint
Li, Z., & Strezhnev, A. (2024) · SocArXiv (OSF Preprints) · doi:10.31235/osf.io/kxw92 · Cited by 6
de Chaisemartin, C., & Li, B. (2025) · SSRN Electronic Journal · doi:10.2139/ssrn.5337463 · Cited by 8
Self-citationBoland, W. C. (2025) · Research in Higher Education · doi:10.1007/s11162-025-09842-w · Cited by 5
Biagini, L. (2025) · Journal of Agricultural Economics · doi:10.1111/1477-9552.12640 · Cited by 7
The impact of animal welfare regulations on pork trade: evidence from European countries
Ferguson, S., Wallenbeck, A., Agenäs, S., & Hansson, H. (2025) · Food Policy · doi:10.1016/j.foodpol.2025.102966 · Cited by 7
Security fosters generosity: Social security protection and charitable giving
Lin, L., He, M., & Sun, W. (2025) · World Development · doi:10.1016/j.worlddev.2025.107194 · Cited by 4
Sun, K., Zhong, X., & Xiong, D. (2025) · Managerial and Decision Economics · doi:10.1002/mde.70060 · Cited by 6
Liu, J., Deng, G., Yan, J., & Ma, S. (2024) · The North American Journal of Economics and Finance · doi:10.1016/j.najef.2024.102313 · Cited by 8
The effect of Ukrainian refugees on the local labour markets: the case of Czechia
Postepska, A., & Voloshyna, A. (2025) · Journal of Population Economics · doi:10.1007/s00148-025-01080-9 · Cited by 16
Did cities increase skills during industrialization? Evidence from rural-urban migration
Andersson, J., & Molinder, J. (2025) · Journal of Urban Economics · doi:10.1016/j.jue.2025.103772 · Cited by 8
Régolo, J., Gendre, C., & Poméon, T. (2025) · Ecological Economics · doi:10.1016/j.ecolecon.2025.108717 · Cited by 12
The Effect of Hospital Postpartum Care Regulations on Breastfeeding and Maternal Time Allocation
Lawler, E. C., & Yewell, K. G. (2023) · American Economic Journal Applied Economics · doi:10.1257/app.20220201 · Cited by 8
Johansson, N., Jakobsson, N., & Svensson, M. (2024) · Social Science & Medicine · doi:10.1016/j.socscimed.2024.116571 · Cited by 12
Kim, H. (2024) · Research in Higher Education · doi:10.1007/s11162-024-09776-9 · Cited by 4
Zhao, F., Zhao, Y., & Li, S. (2024) · Asian-Pacific Economic Literature · doi:10.1111/apel.12405 · Cited by 4
Saldaña, C. (2024) · Educational Evaluation and Policy Analysis · doi:10.3102/01623737241254841 · Cited by 7
Sayantani, S. (2024) · Real Estate Economics · doi:10.1111/1540-6229.12507 · Cited by 5
Offshore finance and corruption in oil licensing
Marcolongo, G., & Zambiasi, D. (2024) · Energy Economics · doi:10.1016/j.eneco.2024.107787 · Cited by 8
Sustainability mission of award: The impact of innovation prize on ESG performance
Yang, H., Wang, C., & Wang, G. (2025) · Journal of Environmental Management · doi:10.1016/j.jenvman.2025.124939 · Cited by 8
Hoffmann, C., Gangadhar, S. S. B., & Müsgens, F. (2025) · Energy Economics · doi:10.1016/j.eneco.2025.108404 · Cited by 4
Hedge fund activism and loan loss provisioning in U.S. banks
Holod, D., Kitsul, Y., & Torna, G. (2025) · Journal of Banking & Finance · doi:10.1016/j.jbankfin.2025.107519 · Cited by 6
Presence of language-learning opportunities and migration
Huber, M., & Uebelmesser, S. (2023) · Labour Economics · doi:10.1016/j.labeco.2023.102409 · Cited by 4
Wright-Kim, J. M. (2022) · AERA Open · doi:10.1177/23328584221126473 · Cited by 4
Can the Federal Reserve Effectively Target Main Street? Evidence from the 1970s Recession
Kandrac, J. (2020) · Finance and Economics Discussion Series · doi:10.17016/feds.2021.061 · Cited by 6
Free Trade and the Formation of Environmental Policy: Evidence from US Legislative Votes
Cherniwchan, J., & Najjar, N. (2025) · American Economic Journal Economic Policy · doi:10.1257/pol.20230733 · Cited by 7
Wage Determination in the Shadow of the Law: The Case of Works Councilors in GermanyPreprint
Goerke, L., & Pannenberg, M. (2021) · SSRN Electronic Journal · doi:10.2139/ssrn.3798944 · Cited by 4
Clear(ed) decision: The effect of central clearing on firms’ financing decisionPreprint
Jager, M., & Zadow, F. (2021) · SSRN Electronic Journal · doi:10.2139/ssrn.3806364 · Cited by 4
The Cost of Knowledge: Academic Journal Pricing and Research DisseminationPreprint
An, Y., Williams, M. A., & Xiao, M. (2024) · SSRN Electronic Journal · doi:10.2139/ssrn.4691124 · Cited by 8
Seeing is believing: The effects of optometrist scope of practice expansion
Bae, K., Timmons, E. J., & Nandy, P. (2024) · Contemporary Economic Policy · doi:10.1111/coep.12645 · Cited by 5
Cheng, P., & Cao, L. (2025) · Digital Economy and Sustainable Development · doi:10.1007/s44265-024-00053-2 · Cited by 3
Herder-related violence, labor allocation, and the gendered response of agricultural households
Bloem, J. R., Damon, A. L., Francis, & Mitchell (2025) · Journal of Development Economics · doi:10.1016/j.jdeveco.2025.103512 · Cited by 10
Does the green patent pre-examination program reduce environmental pollution?
Yuan, L., Tao, J., Sun, J., et al. (2025) · Humanities and Social Sciences Communications · doi:10.1057/s41599-025-05619-9 · Cited by 3
Hao, R., Yu, P., Cai, Z., et al. (2025) · Energy Economics · doi:10.1016/j.eneco.2025.108966 · Cited by 3
New Beginnings: The NO x Budget Trading Program and Infant Health
Tavassoli, N. (2025) · Health Economics · doi:10.1002/hec.70047 · Cited by 3
Du, L., Wei, M., Zheng, Z., & Yang, X. (2025) · Applied Economics · doi:10.1080/00036846.2025.2597472 · Cited by 5
Li, X., Huang, W., & Liu, J. (2025) · Sustainability · doi:10.3390/su172411227 · Cited by 5
Beyond computation: How National Supercomputing Centers facilitate new business entry
Zhao, Y., Tian, J., Zhang, S., & Nagayasu, J. (2026) · Journal of Business Venturing · doi:10.1016/j.jbusvent.2026.106590 · Cited by 5
Price matching in online retail
Bottasso, A., Robbiano, S., & Marocco, P. (2024) · Economic Inquiry · doi:10.1111/ecin.13255 · Cited by 5
How do export credit services shape firm growth?
Hur, J., & Yoon, H. (2024) · World Economy · doi:10.1111/twec.13644 · Cited by 5
Researchers' degrees of flexibility: Revisiting COVID‐19 policy evaluations
Weill, J., Stigler, M., Deschênes, O., & Springborn, M. (2024) · Economic Inquiry · doi:10.1111/ecin.13273 · Cited by 7
Special economic zones and inter-prefecture collaborative innovation: evidence from China
Xu, X., Li, B., & Meng, X. (2025) · Regional Studies · doi:10.1080/00343404.2024.2434658 · Cited by 4
Land expropriation, child schooling, and child housework: Evidence from China
Wang, D., & Wang‐Lu, H. (2025) · Journal of Economic Behavior & Organization · doi:10.1016/j.jebo.2025.107031 · Cited by 4
Hiring mental health professionals: Evidence from a large-scale policy in Brazil
Mrejen, M., & Rocha, R. (2025) · Labour Economics · doi:10.1016/j.labeco.2025.102728 · Cited by 3
The power of wings: How air connections fuel cross-regional collaboration in China?
Chen, J., Shi, J., Wang, Z., Zeng, S., & Zhou, Z. (2025) · China Economic Review · doi:10.1016/j.chieco.2025.102442 · Cited by 7
Educational Expansions and Fertility: Evidence from Norwegian College Reforms
Rogne, A. F., Fauske, A., & Hart, R. K. (2025) · European Journal of Population / Revue européenne de Démographie · doi:10.1007/s10680-025-09737-7 · Cited by 4
The Rise of Broadband and the Retail Landscape: Evidence from Consumer Packaged Goods
Tran, U. (2025) · Journal of Marketing · doi:10.1177/00222429251351859 · Cited by 6
Kang, H. (2025) · Public Performance & Management Review · doi:10.1080/15309576.2025.2541847 · Cited by 3
A Dummy Test of Identification in Models with Bunching
Caetano, C., Caetano, G., Fe, H., & Nielsen, E. R. (2021) · Finance and Economics Discussion Series · doi:10.17016/feds.2021.068 · Cited by 3
Ritter, P. I., & Sanchez, R. A. (2022) · Journal of Population Economics · doi:10.1007/s00148-022-00886-1 · Cited by 2
Martín, A. H.-S., Sprague, A., Raub, A., Bose, B., Bhuwania, P., Kidman, R. C., Nandi, A., Behrman, J. R., & Heymann, J. S. (2023) · Global Public Health · doi:10.1080/17441692.2023.2291703 · Cited by 6
Clarke, D. R., & Gold, D. (2024) · Journal of Urban Economics · doi:10.1016/j.jue.2024.103631 · Cited by 3
The end of court-ordered desegregation and US children’s health: quasi-experimental evidence
Wang, G., White, J. S., & Hamad, R. (2024) · American Journal of Epidemiology · doi:10.1093/aje/kwae082 · Cited by 3
Can international railway express improve green total factor productivity?
Yin, H., Zhang, L., Wan, C., Ting, X., & Ding, L. (2025) · Humanities and Social Sciences Communications · doi:10.1057/s41599-025-04950-5 · Cited by 6
Spillover effects of cross-border bank acquisitions on systemic risk
Sedunov, J., & Taboada, A. G. (2026) · Journal of International Business Studies · doi:10.1057/s41267-026-00861-y · Cited by 3
Need for speed: Fiber and student achievement
Campbell, R. (2024) · Telecommunications Policy · doi:10.1016/j.telpol.2024.102767 · Cited by 2
College Access and Adult Health
Cowan, B., & Tefft, N. (2020) · National Bureau of Economic Research · doi:10.3386/w26685 · Cited by 7
Chilling Effects from Anti-SLAPP LawsPreprint
Schaufele, B. (2022) · SSRN Electronic Journal · doi:10.2139/ssrn.4051970 · Cited by 3
Prisons and HomophobiaPreprint
Ananyev, M., & Poyker, M. (2022) · SSRN Electronic Journal · doi:10.2139/ssrn.4227900 · Cited by 3
Collaboration and Connectivity: Historical Evidence from Patent Records
Berger, T., & Prawitz, E. (2023) · Journal of Urban Economics · doi:10.15626/ns.wp.2023.02 · Cited by 13
Competition and Executive Compensation: Evidence from Pharmaceutical Breakthrough DesignationsPreprint
Garfinkel, J. A., Hammoudeh, M., Irlbeck, S., et al. (2022) · SSRN Electronic Journal · doi:10.2139/ssrn.4281959 · Cited by 3
Dettmann, E., Titze, M., & Weyh, A. (2023) · SSRN Electronic Journal · doi:10.2139/ssrn.4655191 · Cited by 3
Taxes Depress Corporate Borrowing: Evidence from Private FirmsPreprint
Ivanov, I., Pettit, L., & Whited, T. M. (2024) · SSRN Electronic Journal · doi:10.2139/ssrn.4825983 · Cited by 3
Occupational Licensing and Labor Market Mobility: Evidence from the Legal ProfessionPreprint
Chilton, A. S., Goldin, J. S., Rozema, K., & Sanga, S. (2024) · SSRN Electronic Journal · doi:10.2139/ssrn.4934569 · Cited by 11
Could Country-by-Country Reporting Increase Profit Shifting?Preprint
Doeleman, R., Langenmayr, D., & Schindler, D. (2024) · SSRN Electronic Journal · doi:10.2139/ssrn.5045499 · Cited by 3
Inference with Modern Difference-in-Differences MethodsPreprint
Mizushima, Y., & Powell, D. (2025) · SSRN Electronic Journal · doi:10.2139/ssrn.5221387 · Cited by 11
The Impact of Opportunity Zones on Housing Supply ⋆Preprint
Glasner, B., Ozimek, A., & Lettieri, J. (2026) · SSRN Electronic Journal · doi:10.2139/ssrn.6473717 · Cited by 3
Reaching SDG 7: Shedding a Light on the Causal Effect of Mini-Grids on Rural Electrification
Nossek, V., & Berthélemy, J. (2025) · The Journal of Development Studies · doi:10.1080/00220388.2025.2510636 · Cited by 3
Performance-Based Compensation Systems and Principal Job Performance
Mitani, H. (2025) · American Educational Research Journal · doi:10.3102/00028312241303760 · Cited by 3
Lahey, J., & Wanamaker, M. (2025) · Journal of Public Economics · doi:10.1016/j.jpubeco.2025.105329 · Cited by 4
The Effects of Renewable Energy Projects on Employment: Evidence from Brazil
Hernández-Cortés, D., & Mathes, S. M. (2025) · Journal of the Association of Environmental and Resource Economists · doi:10.1086/735825 · Cited by 5
Social Trust During the Pandemic: Evidence from COVID-19 Crisis in South Korea
Kim, S. H. (2025) · Social Indicators Research · doi:10.1007/s11205-025-03624-8 · Cited by 2
Choo, D., Jang, H., & Kim, J. (2025) · Energy Policy · doi:10.1016/j.enpol.2025.114724 · Cited by 4
Knockin’ on H(e)aven’s door. Financial crises and offshore wealth
Marchesi, S., & Marcolongo, G. (2025) · Journal of International Economics · doi:10.1016/j.jinteco.2025.104175 · Cited by 4
Impact of Climate Change on Labor Market Dynamics: Evidence From Kazakhstan
Alpysbayeva, D., Bazarkulova, D., de Beurs, K. M., & Sagyndykova, G. (2025) · Agricultural Economics · doi:10.1111/agec.70073 · Cited by 7
Metadata
- Authors
- de Chaisemartin, C., & D’Haultfœuille, X.
- Affiliations
- Sciences Po Paris, Economics Department
- Centre de Recherche en Économie et Statistique (FR)
- Venue
- Review of Economics and Statistics
- Publisher
- MIT Press
- Published
- 2026-07
- Volume
- 108
- Issue
- 4
- Pages
- 863-880
- ISSN
- 0034-6535 (ISSN-L)
- 1530-9142
- OpenAlex
- W3041109582
- Cited by
- 740
- References
- 81
- Citations by year
- 2026: 147
- FWCI
- 63.78
- Type
- journal article
- Language
- en
- Open access
- green
- doi.org
- Locations
- The Review of Economics and Statistics (publishedVersion)
- SSRN Electronic Journal (publishedVersion)
- National Bureau of Economic Research (publishedVersion)
- SSRN Electronic Journal (acceptedVersion)
- RePEc: Research Papers in Economics (submittedVersion)
- arXiv (Cornell University) (submittedVersion)
- HAL (submittedVersion, cc-by-nc-nd)
- HAL (submittedVersion, cc-by-nc)
- HAL (submittedVersion)
- arXiv (Cornell University)
- Funders
- European Commission
- Agence Nationale de la Recherche (ANR-17-CE26-0015, ANR-17)
- HORIZON EUROPE European Research Council (101043899)
- Topics
- Physical Sciences › Mathematics › Statistics and Probability › Advanced Causal Inference Techniques
- Social Sciences › Economics, Econometrics and Finance › Economics and Econometrics › Spatial and Panel Data Analysis
- Physical Sciences › Mathematics › Statistics and Probability › Statistical Methods and Bayesian Inference
- Keywords
- difference-in-differences, parallel trends assumption, treatment effect heterogeneity, two-way fixed effects, local projections, panel data
About these checks
Registry, retraction, Cites and statistics results are computed, not judged, with one exception: a printed reference that no index lists is read once by a model before it counts as a citation error. Claims are extracted by a model and kept only when their quote appears verbatim in the text; each cited source is then checked, with a model’s help, for whether it says what the claim relies on. Those verdicts can be wrong — read the claim’s quote and the cited source before relying on one.
The claim verdicts this report counts are experimental: their accuracy is not yet measured.
A language model drew the claims from the paper on 2026-09-29, under version 3 of the claim definition (model deepseek-v4.1-flash, prompt extract-v3).
A second model labelled each claim on 2026-09-29 (model jev-1.13-20260917, definition revision gold-guideline-v0.2).
Cited sources are checked with a language model’s help (gpt-6-sol).
Statistics and arithmetic are recomputed, not judged.
Confidence bands are shown only for fields calibrated on our annotated test set. None is calibrated yet, so no band is shown.
What counts as a claim ›How we measure confidence ›How we check this ›
Are you an author, or do you see a problem with this page? Request a review
Data sources
Bibliographic data: Semantic Scholar, OpenAlex, Crossref.
Contains information from the Semantic Scholar Academic Graph Datasets, made available under the ODC Attribution License (ODC-BY 1.0).
Semantic Scholar’s data is described in: Kinney, R., et al. (2023). The Semantic Scholar Open Data Platform. arXiv:2301.10140.
