

The DOI matches its Crossref record; 36 of the 36 references it cites were found in a registry or an index.
A theoretical framework for determining cerebral vascular function and heterogeneity from dynamic susceptibility contrast MRI
Abstract
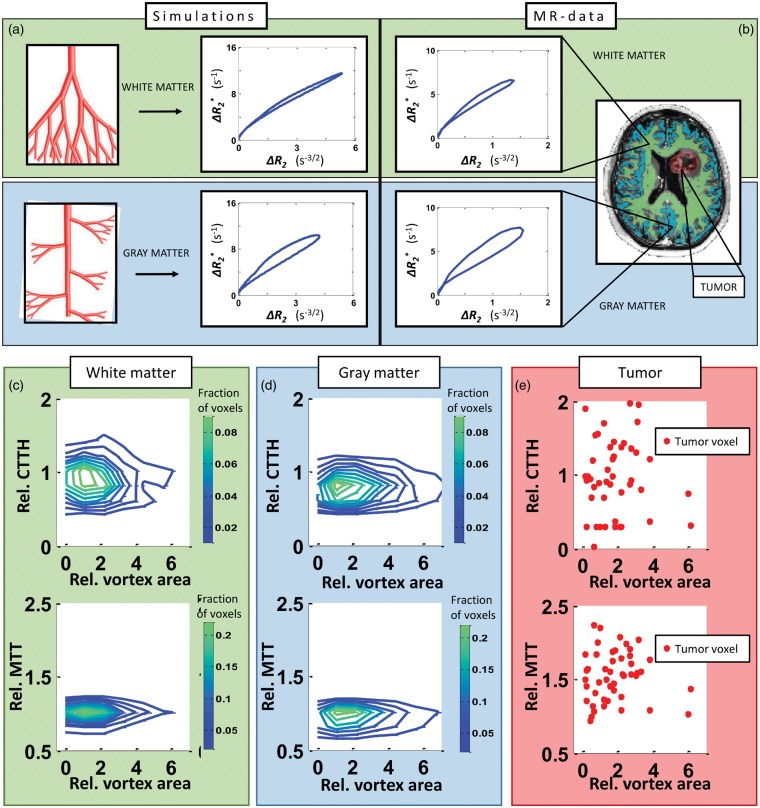
Mapping the complex heterogeneity of vascular tissue in the brain is important for understanding cerebrovascular disease. In this translational study, we build on previous work using vessel architectural imaging (VAI) and present a theoretical framework for determining cerebral vascular function and heterogeneity from dynamic susceptibility contrast magnetic resonance imaging (MRI). Our tissue model covers realistic structural architectures for vessel branching and orientations, as well as a range of hemodynamic scenarios for blood flow, capillary transit times and oxygenation. In a typical image voxel, our findings show that the apparent MRI relaxation rates are independent of the mean vessel orientation and that the vortex area, a VAI-based parameter, is determined by the relative oxygen saturation level and the vessel branching of the tissue. Finally, in both simulated and patient data, we show that the relative distributions of the vortex area parameter as a function of capillary transit times show unique characteristics in normal-appearing white and gray matter tissue, whereas tumour-voxels in comparison display a heterogeneous distribution. Collectively, our study presents a comprehensive framework that may serve as a roadmap for in vivo and per-voxel determination of vascular status and heterogeneity in cerebral tissue.
Overview
The claims and statistics of this paper haven’t been checked yet.
Run the check — free, no account needed. It reads the open-access text and checks the sources it cites.
Integrity signals
Registry
Cites
Statistics
Figures

Verification
Claims the paper makes
The claims and statistics of this paper haven’t been checked yet.
Run the check — free, no account needed. It reads the open-access text and checks the sources it cites.
Claims other papers make about this one
Each is checked against this paper’s own text: does it say what the citing paper says it does?
In the citing paper
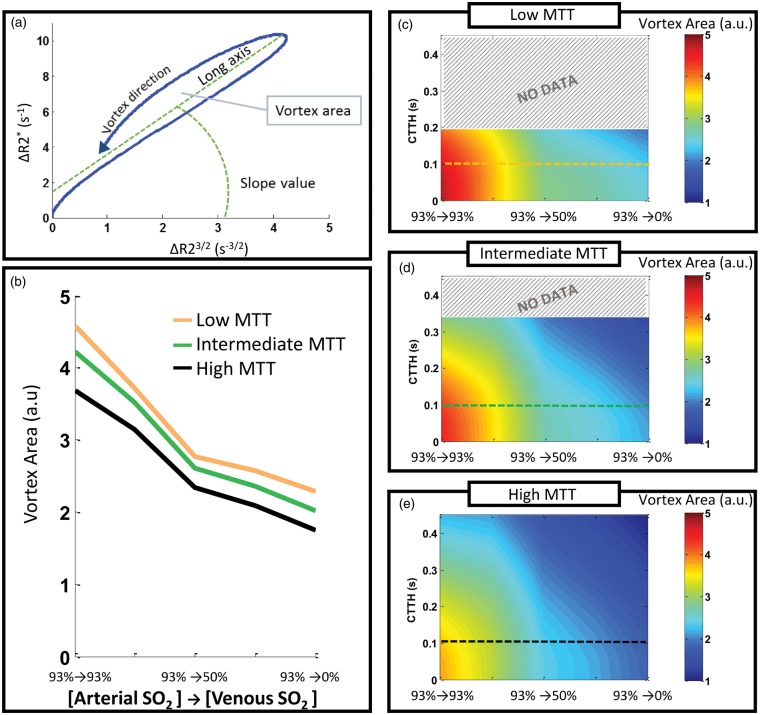
“In theory, an abnormal artery to venule oxygen-extraction corresponds to relative shift in VA (Fig. 3a)21, which was present in ABCD1-deficient HEM (smaller VA) when compared to age-matched non-ABCD1-deficient controls (Fig. 3d).”
From Hematopoietic stem-cell gene therapy is associated with restored white matter microvascular function in cerebral adrenoleukodystrophy (2023) · cites this paper as [21]
Self-check
Percentages, sums and reported differences re-computed from the paper’s own numbers.
The self-check needs the paper’s full text.
Citations
Cites
Magnetic resonance fingerprinting
Ma, D., Gulani, V., Seiberlich, N., Liu, K., Sunshine, J. L., Duerk, J. L., & Griswold, M. A. (2013) · Nature · doi:10.1038/nature11971 · Cited by 1,577
Mr contrast due to intravascular magnetic susceptibility perturbations
Boxerman, J. L., Hamberg, L. M., Rosen, B. R., & Weisskoff, R. M. (1995) · Magnetic Resonance in Medicine · doi:10.1002/mrm.1910340412 · Cited by 1,008
A Model for the Coupling between Cerebral Blood Flow and Oxygen Metabolism during Neural Stimulation
Buxton, R. B., & Frank, L. R. (1997) · Journal of Cerebral Blood Flow & Metabolism · doi:10.1097/00004647-199701000-00009 · Cited by 807
THE PHYSIOLOGICAL PRINCIPLE OF MINIMUM WORK APPLIED TO THE ANGLE OF BRANCHING OF ARTERIES
Murray, C. D. (1926) · Journal of General Physiology · doi:10.1085/jgp.9.6.835 · Cited by 750
Microscopic susceptibility variation and transverse relaxation: Theory and experiment
Weisskoff, R., Zuo, C. S., Boxerman, J. L., & Rosen, B. R. (1994) · Magnetic Resonance in Medicine · doi:10.1002/mrm.1910310605 · Cited by 715
Boxerman, J. L., Schmainda, K. M., & Weisskoff, R. M. (2006) · PubMed · Cited by 686
Jespersen, S. N., & Østergaard, L. (2012) · Journal of Cerebral Blood Flow & Metabolism · doi:10.1038/jcbfm.2011.153 · Cited by 504
Methodology of brain perfusion imaging
Barbier, E. L., Lamalle, L., & Décorps, M. (2001) · Journal of Magnetic Resonance Imaging · doi:10.1002/jmri.1073 · Cited by 404
He, X., & Yablonskiy, D. A. (2007) · Magnetic Resonance in Medicine · doi:10.1002/mrm.21108 · Cited by 396
Batchelor, T. T., Gerstner, E. R., Emblem, K. E., Duda, D. G., Kalpathy-Cramer, J., Snuderl, M., Ancukiewicz, M., Polaskova, P., Pinho, M. C., Jennings, D., et al. (2013) · Proceedings of the National Academy of Sciences · doi:10.1073/pnas.1318022110 · Cited by 340
Self-citation
Research works printed but not linked: 2
- Boxerman JL, 2006, AJNR Am J Neuroradiol, 27, 859
- 10.1080/j.1600-0455.2003.00104.x · DOI
Cited by
Lauer, A., Speroni, S. L., Choi, M., Da, X., Duncan, C., McCarthy, S., Krishnan, V., Lusk, C. A., Rohde, D., Hansen, M. B., et al. (2023) · Nature Communications · doi:10.1038/s41467-023-37262-w · Cited by 26
Self-citation
Metadata
- Authors
- Digernes, I., Bjørnerud, A., Vatnehol, S. A. S., Løvland, G., Courivaud, F., Vik-Mo, E., Meling, T. R., & Emblem, K. E.
- Affiliations
- Department of Diagnostic Physics, Oslo University Hospital, Oslo, Norway
- Department of Neurosurgery, Oslo University Hospital, Oslo, Norway
- Venue
- Journal of Cerebral Blood Flow & Metabolism
- Publisher
- SAGE Publications
- Published
- 2017-02-20
- Volume
- 37
- Issue
- 6
- Pages
- 2237-2248
- ISSN
- 0271-678X
- 1559-7016
- PMC
- PMC5444554
- Cited by
- 22
- References
- 36
- Language
- en
- Licence
- journals.sagepub.com/page/policies/text-and-data-mining-license (tdm)
About these checks
Registry, retraction, Cites and statistics results are computed, not judged, with one exception: a printed reference that no index lists is read once by a model before it counts as a citation error. Claims are extracted by a model and kept only when their quote appears verbatim in the text; each cited source is then checked, with a model’s help, for whether it says what the claim relies on. Those verdicts can be wrong — read the claim’s quote and the cited source before relying on one.
Statistics and arithmetic are recomputed, not judged.
Confidence bands are shown only for fields calibrated on our annotated test set. None is calibrated yet, so no band is shown.
What counts as a claim ›How we measure confidence ›How we check this ›
Are you an author, or do you see a problem with this page? Request a review
How to cite
Cite CoChat for the checks on this page, and the paper for its own findings.
- This page
- CoChat. (2026). Citation check: A theoretical framework for determining cerebral vascular function and heterogeneity from dynamic susceptibility contrast MRI. https://app.cochat.ai/papers/10.1177/0271678x17694187
- The paper
- Digernes, I., Bjørnerud, A., Vatnehol, S. A. S., Løvland, G., Courivaud, F., Vik-Mo, E., Meling, T. R., & Emblem, K. E. (2017). A theoretical framework for determining cerebral vascular function and heterogeneity from dynamic susceptibility contrast MRI. Journal of Cerebral Blood Flow & Metabolism. https://doi.org/10.1177/0271678x17694187
Data sources
Bibliographic data: Semantic Scholar, OpenAlex, Crossref.
Contains information from the Semantic Scholar Academic Graph Datasets, made available under the ODC Attribution License (ODC-BY 1.0).
Semantic Scholar’s data is described in: Kinney, R., et al. (2023). The Semantic Scholar Open Data Platform. arXiv:2301.10140.
