

The DOI matches its Crossref record; 66 of the 66 references it cites were found in a registry or an index; 1 of the 74 sources its claims cite were checked for support.
A framework for meta-analysis of prediction model studies with binary and time-to-event outcomes
Open accessAbstract
It is widely recommended that any developed—diagnostic or prognostic—prediction model is externally validated in terms of its predictive performance measured by calibration and discrimination. When multiple validations have been performed, a systematic review followed by a formal meta-analysis helps to summarize overall performance across multiple settings, and reveals under which circumstances the model performs suboptimal (alternative poorer) and may need adjustment. We discuss how to undertake meta-analysis of the performance of prediction models with either a binary or a time-to-event outcome. We address how to deal with incomplete availability of study-specific results (performance estimates and their precision), and how to produce summary estimates of the c-statistic, the observed:expected ratio and the calibration slope. Furthermore, we discuss the implementation of frequentist and Bayesian meta-analysis methods, and propose novel empirically-based prior distributions to improve estimation of between-study heterogeneity in small samples. Finally, we illustrate all methods using two examples: meta-analysis of the predictive performance of EuroSCORE II and of the Framingham Risk Score. All examples and meta-analysis models have been implemented in our newly developed R package “metamisc”.
Overview
AI snapshot
Written from the paper’s full text.
TL;DR
The paper provides a statistical framework for meta-analyzing the predictive performance of prediction models with binary or time-to-event outcomes, including methods to restore unreported performance estimates and to summarize discrimination and calibration. It illustrates the framework with EuroSCORE II and Framingham Risk Score meta-analyses and implements the methods in the R package “metamisc.”
Key findings
- EuroSCORE II: summary c-statistic 0.79 (95% CI 0.76–0.81; 95% PI 0.68–0.87); summary O:E ratio 1.11 (95% CI 0.90–1.36; 95% PI 0.43–2.85); calibration slope could not be estimated.
- Framingham Risk Score: summary c-statistic 0.69 (95% CI 0.66–0.71; 95% PI 0.59–0.77); summary O:E ratio 0.60 (95% CI 0.46–0.79; 95% PI 0.20–1.84); calibration slope 1.03 (95% CI 0.94–1.12; 95% PI 0.93–1.13) under ML Model 3.
- Proposed empirically-based priors for between-study heterogeneity substantially improved estimation of the between-study standard deviation in small meta-analyses.
- Bayesian estimation was recommended because frequentist methods may fail to produce reliable confidence or prediction intervals when validation studies are sparse.
Methods
- The paper develops frequentist and Bayesian random-effects meta-analysis models for the logit c-statistic, log total O:E ratio, and calibration slope, including one-stage models and meta-regression for heterogeneity.
- Empirical examples used 23 EuroSCORE II validations and Framingham Risk Score validations in male populations; Framingham meta-analyses included K=21 for c-statistic, K=17 for O:E ratio, and K=11 for calibration slope.
- Missing c-statistics, standard errors, and O:E ratios were restored from reported quantities using formulas; analyses were implemented in the R package “metamisc” using “metafor” and JAGS, with Bayesian convergence assessed by potential scale reduction factor ≤1.05.
Limitations
- The paper states that frequentist meta-analysis may suffer convergence issues and unreliable precision/heterogeneity estimates when validation studies are sparse; Hartung–Knapp intervals are too narrow with fewer than five studies, and prediction intervals have poor coverage in some settings.
- The paper states that meta-regression has low power and may suffer ecological bias; calibration slope could not be estimated for EuroSCORE II because subgroup-specific event rates were not extracted and the slope was not directly provided.
- Evident from the text: performance estimates are often poorly reported, requiring restoration and assumptions; time-to-event O:E analyses may require extrapolation when follow-up times differ; the empirical examples are reanalyses of existing reviews rather than new prospective validation studies.
Model-written summary. Check it against the paper before relying on it.
Integrity signals
Registry
Cites
Statistics
Figures
Verification
Claims the paper makes
46 Not checked yet · 26 No basis given · 25 Own result · 10 Own interpretation · 1 Supported · 1 Own method
The paper states this without a source or data behind it here, so there is nothing to check it against. The quote shows it is in the paper.
In the paper
“The total number of observed and expected events was available for all 23 validations.”
§ A framework for meta-analysis of prediction model studies with binary and time-to-event outcomes > 3 Data extraction and estimating unreported results to facilitate meta-analysis > 3.7 EuroSCORE II
plain- Asserted: passes — The authors put it forward as true.
- Checkable: passes — It can be checked against evidence.
- Load-bearing: passes — The paper’s conclusions depend on it.
- Based: passes — The paper gives a reason why it holds.
A result the paper reports from its own data — it cites no other source for it, so there is none to check. The quote shows it is in the paper.
In the paper
“As illustrated in Supporting Information 2, this method is fairly accurate for validation studies involving a binary or time-to-event outcome, as long as the total number of observed events is sufficiently large (above 10).”
§ A framework for meta-analysis of prediction model studies with binary and time-to-event outcomes > 3 Data extraction and estimating unreported results to facilitate meta-analysis > 3.1 Model discrimination
plaincorrelational- Asserted: passes — The authors put it forward as true.
- Checkable: passes — It can be checked against evidence.
- Load-bearing: passes — The paper’s conclusions depend on it.
- Based: passes — The paper gives a reason why it holds.
The paper states this without a source or data behind it here, so there is nothing to check it against. The quote shows it is in the paper.
In the paper
“Furthermore, because the EuroSCORE II model does not consider time-to-event, estimates for the total O:E ratios and their standard error could directly be derived from extracted quantities for O and E”
§ A framework for meta-analysis of prediction model studies with binary and time-to-event outcomes > 3 Data extraction and estimating unreported results to facilitate meta-analysis > 3.7 EuroSCORE II
hedgeddirect- Asserted: passes — The authors put it forward as true.
- Checkable: passes — It can be checked against evidence.
- Load-bearing: passes — The paper’s conclusions depend on it.
- Based: passes — The paper gives a reason why it holds.
A result the paper reports from its own data — it cites no other source for it, so there is none to check. The quote shows it is in the paper.
In the paper
“Results in Supporting Information 2.2 indicate that accurate predictions can be obtained for c < 0.70 by using the standard deviation of the linear predictor.”
§ A framework for meta-analysis of prediction model studies with binary and time-to-event outcomes > 3 Data extraction and estimating unreported results to facilitate meta-analysis > 3.1 Model discrimination
hedgeddirect- Asserted: passes — The authors put it forward as true.
- Checkable: passes — It can be checked against evidence.
- Load-bearing: passes — The paper’s conclusions depend on it.
- Based: passes — The paper gives a reason why it holds.
A result the paper reports from its own data — it cites no other source for it, so there is none to check. The quote shows it is in the paper.
In the paper
“Estimates for the c-statistic could be obtained for all 23 validations (Supporting Information 1.1).”
§ A framework for meta-analysis of prediction model studies with binary and time-to-event outcomes > 3 Data extraction and estimating unreported results to facilitate meta-analysis > 3.2 EuroSCORE II
hedged- Asserted: passes — The authors put it forward as true.
- Checkable: passes — It can be checked against evidence.
- Load-bearing: passes — The paper’s conclusions depend on it.
- Based: passes — The paper gives a reason why it holds.
A result the paper reports from its own data — it cites no other source for it, so there is none to check. The quote shows it is in the paper.
In the paper
“Estimates for observed and expected 10-year CHD risk were directly available for 6/24 validations (Supporting Information 1.2).”
§ A framework for meta-analysis of prediction model studies with binary and time-to-event outcomes > 3 Data extraction and estimating unreported results to facilitate meta-analysis > 3.6 Framingham
plain- Asserted: passes — The authors put it forward as true.
- Checkable: passes — It can be checked against evidence.
- Load-bearing: unclear — It is unclear whether the paper’s conclusions depend on it.
- Based: passes — The paper gives a reason why it holds.
A result the paper reports from its own data — it cites no other source for it, so there is none to check. The quote shows it is in the paper.
In the paper
“More accurate predictions (for c < 0.95) can be obtained if the mean and variance of the linear predictor are known for the affected and unaffected populations.”
§ A framework for meta-analysis of prediction model studies with binary and time-to-event outcomes > 3 Data extraction and estimating unreported results to facilitate meta-analysis > 3.1 Model discrimination
plaindirect- Asserted: passes — The authors put it forward as true.
- Checkable: passes — It can be checked against evidence.
- Load-bearing: passes — The paper’s conclusions depend on it.
- Based: passes — The paper gives a reason why it holds.
A result the paper reports from its own data — it cites no other source for it, so there is none to check. The quote shows it is in the paper.
In the paper
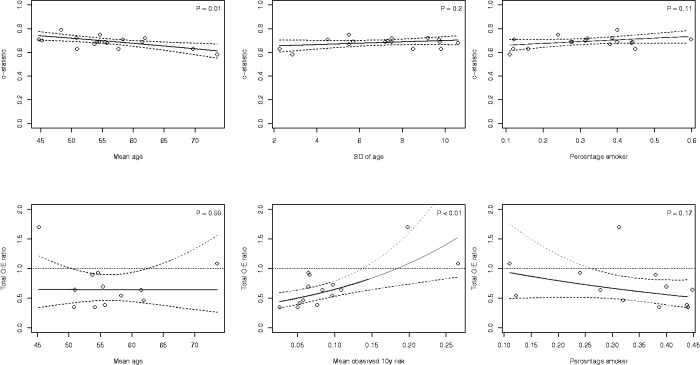
“Results in Figure 4 indicate that the c-statistic of the Framingham Risk Score tended to decrease when validated in older (male) populations (p = 0.01).”
§ A framework for meta-analysis of prediction model studies with binary and time-to-event outcomes > 5 Investigating sources of heterogeneity > 5.4 Framingham
hedgedcorrelational- Asserted: passes — The authors put it forward as true.
- Checkable: passes — It can be checked against evidence.
- Load-bearing: unclear — It is unclear whether the paper’s conclusions depend on it.
- Based: passes — The paper gives a reason why it holds.
A result the paper reports from its own data — it cites no other source for it, so there is none to check. The quote shows it is in the paper.
In the paper
“Results in Supporting Information 5.1 indicate that both strategies yielded similar summary estimates.”
§ A framework for meta-analysis of prediction model studies with binary and time-to-event outcomes > 4 Meta-analysis > 4.8 Framingham
hedged- Asserted: passes — The authors put it forward as true.
- Checkable: passes — It can be checked against evidence.
- Load-bearing: unclear — It is unclear whether the paper’s conclusions depend on it.
- Based: passes — The paper gives a reason why it holds.
A result the paper reports from its own data — it cites no other source for it, so there is none to check. The quote shows it is in the paper.
In the paper
“the mean age ranged from 41 to 74 across the included validations.”
§ A framework for meta-analysis of prediction model studies with binary and time-to-event outcomes > 5 Investigating sources of heterogeneity > 5.4 Framingham
plain- Asserted: passes — The authors put it forward as true.
- Checkable: passes — It can be checked against evidence.
- Load-bearing: unclear — It is unclear whether the paper’s conclusions depend on it.
- Based: passes — The paper gives a reason why it holds.
- It may state two separate claims as one. 39
- Probably not a substantial claim. 24
Every source the paper cites for this claim was checked and supports it.
In the paper
“Furthermore, because validation studies are often conducted using small and local data sets,11 they rarely provide evidence about a model’s potential generalizability across different settings and populations.”
§ A framework for meta-analysis of prediction model studies with binary and time-to-event outcomes > 1 Introduction
What the sources say
- Supportedcites [11] Collins GS de Groot JA Dutton S, et al. External validation of multivariable prediction models: a systematic review of methodological conduct and reporting. BMC Med Res Methodol 2014; 14: 40– 40. 24645774 PMC3999945 source
The citation is attached to the claim that validation studies often use small and local datasets. Results > Model validation: study design reports that 48% of validation datasets had fewer than 100 outcome events; Results reports that 12 of 33 studies combining model development and validation used data from the same centre at a different time. The sentence’s subsequent inference about generalizability is not directly attributed to this citation. (LLM, conf=0.85)
plaindirect- Asserted: passes — The authors put it forward as true.
- Checkable: passes — It can be checked against evidence.
- Load-bearing: passes — The paper’s conclusions depend on it.
- Based: passes — The paper gives a reason why it holds.
It may state two separate claims as one.
- Supported
A result the paper reports from its own data — it cites no other source for it, so there is none to check. The quote shows it is in the paper.
In the paper
“For 10/24 validations, information was only available for 5 or 7.5 years of follow-up, and we therefore considered a sensitivity analysis where we extrapolated observed and expected event counts using a Poisson distribution.”
§ A framework for meta-analysis of prediction model studies with binary and time-to-event outcomes > 3 Data extraction and estimating unreported results to facilitate meta-analysis > 3.6 Framingham
plain- Asserted: passes — The authors put it forward as true.
- Checkable: passes — It can be checked against evidence.
- Load-bearing: unclear — It is unclear whether the paper’s conclusions depend on it.
- Based: passes — The paper gives a reason why it holds.
It may state two separate claims as one.
- The authors state this as an assumption: Observed and expected event counts for different follow-up times can be extrapolated by assuming a Poisson distribution.
A result the paper reports from its own data — it cites no other source for it, so there is none to check. The quote shows it is in the paper.
In the paper
“The c-statistic was only reported in 19/24 validations. In some cases, missing c-statistics could be restored by contacting the study authors (two validations). For these 21 estimates of the c-statistic, 10 studies provided the standard error and 11 studies required approximation of the standard error using Newcombe’s method”
§ A framework for meta-analysis of prediction model studies with binary and time-to-event outcomes > 3 Data extraction and estimating unreported results to facilitate meta-analysis > 3.3 Framingham
hedged- Asserted: passes — The authors put it forward as true.
- Checkable: passes — It can be checked against evidence.
- Load-bearing: unclear — It is unclear whether the paper’s conclusions depend on it.
- Based: passes — The paper gives a reason why it holds.
It may state two separate claims as one.
A result the paper reports from its own data — it cites no other source for it, so there is none to check. The quote shows it is in the paper.
In the paper
“A total of 11 validations presented event rates for different risk strata”
§ A framework for meta-analysis of prediction model studies with binary and time-to-event outcomes > 3 Data extraction and estimating unreported results to facilitate meta-analysis > 3.6 Framingham
plain- Asserted: passes — The authors put it forward as true.
- Checkable: passes — It can be checked against evidence.
- Load-bearing: fails — The paper’s conclusions may not depend on it.
- Based: passes — The paper gives a reason why it holds.
Probably not a substantial claim. The paper’s conclusions may not depend on it.
A result the paper reports from its own data — it cites no other source for it, so there is none to check. The quote shows it is in the paper.
In the paper
“Model 2* could then only be applied to 16 studies, yielding a summary estimate for the total O:E ratio of 1.17 (95% CI: 0.86 to 1.50).”
§ A framework for meta-analysis of prediction model studies with binary and time-to-event outcomes > 4 Meta-analysis > 4.7 EuroSCORE II
hedgeddirect- Asserted: passes — The authors put it forward as true.
- Checkable: passes — It can be checked against evidence.
- Load-bearing: passes — The paper’s conclusions depend on it.
- Based: passes — The paper gives a reason why it holds.
It may state two separate claims as one.
A result the paper reports from its own data — it cites no other source for it, so there is none to check. The quote shows it is in the paper.
In the paper
“Results in Supporting Information 4.2 demonstrate that for the logit c-statistic and the log O:E ratio, it is unlikely that τdiscr>2 and, respectively, τcal.OE>2.”
§ A framework for meta-analysis of prediction model studies with binary and time-to-event outcomes > 4 Meta-analysis > 4.5 The Bayesian approach for random effects meta-analysis
boosted- Asserted: passes — The authors put it forward as true.
- Checkable: passes — It can be checked against evidence.
- Load-bearing: passes — The paper’s conclusions depend on it.
- Based: passes — The paper gives a reason why it holds.
It may state two separate claims as one.
A result the paper reports from its own data — it cites no other source for it, so there is none to check. The quote shows it is in the paper.
In the paper
“Although the 10-year predicted risk of CHD occurrence was usually too large (summary O:E=0.6), the calculated PI (0.2 to 1.8) indicates that predicted risks were too low for some of the validation studies.”
§ A framework for meta-analysis of prediction model studies with binary and time-to-event outcomes > 4 Meta-analysis > 4.8 Framingham
hedged- Asserted: passes — The authors put it forward as true.
- Checkable: passes — It can be checked against evidence.
- Load-bearing: unclear — It is unclear whether the paper’s conclusions depend on it.
- Based: passes — The paper gives a reason why it holds.
It may state two separate claims as one.
The paper states this without a source or data behind it here, so there is nothing to check it against. The quote shows it is in the paper.
In the paper
“In particular, substantial efforts are often needed to restore missing information from the primary studies and to harmonize the extracted performance statistics.”
§ A framework for meta-analysis of prediction model studies with binary and time-to-event outcomes > 6 Conclusion
plain- Asserted: passes — The authors put it forward as true.
- Checkable: passes — It can be checked against evidence.
- Load-bearing: passes — The paper’s conclusions depend on it.
- Based: fails — The paper may give no reason why it holds.
Probably not a substantial claim. The paper may give no reason why it holds.
A result the paper reports from its own data — it cites no other source for it, so there is none to check. The quote shows it is in the paper.
In the paper
“Results in Table 4 reveal substantial heterogeneity for the discrimination performance, with 95% PI ranging from 0.59 to 0.77 based on the frequentist approach.”
§ A framework for meta-analysis of prediction model studies with binary and time-to-event outcomes > 4 Meta-analysis > 4.8 Framingham
plain- Asserted: passes — The authors put it forward as true.
- Checkable: passes — It can be checked against evidence.
- Load-bearing: unclear — It is unclear whether the paper’s conclusions depend on it.
- Based: passes — The paper gives a reason why it holds.
It may state two separate claims as one.
A result the paper reports from its own data — it cites no other source for it, so there is none to check. The quote shows it is in the paper.
In the paper
“Also the standard deviation of age substantially varied across the included validation studies (range: 2–13), further highlighting the presence of differences in patient spectrum.”
§ A framework for meta-analysis of prediction model studies with binary and time-to-event outcomes > 5 Investigating sources of heterogeneity > 5.4 Framingham
plain- Asserted: passes — The authors put it forward as true.
- Checkable: passes — It can be checked against evidence.
- Load-bearing: unclear — It is unclear whether the paper’s conclusions depend on it.
- Based: passes — The paper gives a reason why it holds.
It may state two separate claims as one.
A result the paper reports from its own data — it cites no other source for it, so there is none to check. The quote shows it is in the paper.
In the paper
“The summary estimate of the calibration slope was close to 1, indicating that predictions by the Framingham Risk Score were sufficiently scaled (despite being too high on average).”
§ A framework for meta-analysis of prediction model studies with binary and time-to-event outcomes > 4 Meta-analysis > 4.8 Framingham
hedged- Asserted: passes — The authors put it forward as true.
- Checkable: passes — It can be checked against evidence.
- Load-bearing: unclear — It is unclear whether the paper’s conclusions depend on it.
- Based: passes — The paper gives a reason why it holds.
It may state two separate claims as one.
A result the paper reports from its own data — it cites no other source for it, so there is none to check. The quote shows it is in the paper.
In the paper
“when applying hierarchical related regressions, a binomial distribution was used for aforementioned 16 studies whereas a Poisson distribution was used for the remaining seven studies. The meta-analysis is then again based on 23 studies and yielded a summary estimate of 1.10 (with a 95% CI of 0.88 to 1.32).”
§ A framework for meta-analysis of prediction model studies with binary and time-to-event outcomes > 4 Meta-analysis > 4.7 EuroSCORE II
plain- Asserted: passes — The authors put it forward as true.
- Checkable: passes — It can be checked against evidence.
- Load-bearing: passes — The paper’s conclusions depend on it.
- Based: passes — The paper gives a reason why it holds.
It may state two separate claims as one.
The paper states this without a source or data behind it here, so there is nothing to check it against. The quote shows it is in the paper.
In the paper
“Although no empirical data was identified for heterogeneity on the calibration slope, individual estimates usually do not exceed [0,2] and thus it is also unlikely that τcal.slope>2.”
§ A framework for meta-analysis of prediction model studies with binary and time-to-event outcomes > 4 Meta-analysis > 4.5 The Bayesian approach for random effects meta-analysis
hedged- Asserted: passes — The authors put it forward as true.
- Checkable: passes — It can be checked against evidence.
- Load-bearing: passes — The paper’s conclusions depend on it.
- Based: passes — The paper gives a reason why it holds.
It may state two separate claims as one.
None of the sources cited for this claim have been checked yet.
In the paper
“Unfortunately, the interpretation of validation study results is often difficult, as changes in prediction model performance are likely to occur due to sampling error, differences in predictor effects, and/or differences in patient spectrum.”
§ A framework for meta-analysis of prediction model studies with binary and time-to-event outcomes > 1 Introduction
What the sources say
- Not checked yetcites [9] Debray TPA Vergouwe Y Koffijberg H, et al. A new framework to enhance the interpretation of external validation studies of clinical prediction models. J Clin Epidemiol 2015; 68: 279– 289. 25179855 source
- Not checked yetcites [10] Vergouwe Y Moons KGM Steyerberg EW External validity of risk models: use of benchmark values to disentangle a case-mix effect from incorrect coefficients. Am J Epidemiol 2010; 172: 971– 980. 20807737 PMC2984249 source
hedgeddirect- Asserted: passes — The authors put it forward as true.
- Checkable: passes — It can be checked against evidence.
- Load-bearing: passes — The paper’s conclusions depend on it.
- Based: passes — The paper gives a reason why it holds.
It may state two separate claims as one.
In the paper
“This logistic regression model was developed using 16,828 adult patients from 43 countries to predict mortality after cardiac surgery.3”
§ A framework for meta-analysis of prediction model studies with binary and time-to-event outcomes > 2 Motivating examples
What the sources say
- Not checked yetcites [3] Nashef SAM Roques F Sharples LD, et al. EuroSCORE II. Eur J Cardiothorac Surg 2012; 41: 734– 744; discussion 744–745. 22378855 source
plainn = 16,828- Asserted: passes — The authors put it forward as true.
- Checkable: passes — It can be checked against evidence.
- Load-bearing: fails — The paper’s conclusions may not depend on it.
- Based: passes — The paper gives a reason why it holds.
Probably not a substantial claim. The paper’s conclusions may not depend on it.
In the paper
“These methods mainly focused on (diagnostic) prediction models with a binary outcome, and may therefore have limited value when reviewing (prognostic) models with a time-to-event outcome.”
§ A framework for meta-analysis of prediction model studies with binary and time-to-event outcomes > 1 Introduction
What the sources say
- Not checked yetcites [14] Debray TPA Damen JAAG Snell KIE, et al. A guide to systematic review and meta-analysis of prediction model performance. BMJ 2017; 356: i6460– i6460. 28057641 source
hedgedconditional- Asserted: passes — The authors put it forward as true.
- Checkable: passes — It can be checked against evidence.
- Load-bearing: passes — The paper’s conclusions depend on it.
- Based: passes — The paper gives a reason why it holds.
It may state two separate claims as one.
A conclusion the paper draws from its own results — it cites no other source for it, so there is none to check. The quote shows it is in the paper.
In the paper
“When multiple validations have been performed, a systematic review followed by a formal meta-analysis helps to summarize overall performance across multiple settings, and reveals under which circumstances the model performs suboptimal (alternative poorer) and may need adjustment.”
§ A framework for meta-analysis of prediction model studies with binary and time-to-event outcomes > Abstract
plaindirect- Asserted: passes — The authors put it forward as true.
- Checkable: passes — It can be checked against evidence.
- Load-bearing: passes — The paper’s conclusions depend on it.
- Based: passes — The paper gives a reason why it holds.
It may state two separate claims as one.
In the paper
“In particular, the total O:E ratio quantifies the averaged observed:expected ratio across the entire range of predicted risks, and is strongly related to calibration-in-the-large.14”
§ A framework for meta-analysis of prediction model studies with binary and time-to-event outcomes > 3 Data extraction and estimating unreported results to facilitate meta-analysis > 3.4 Model calibration
What the sources say
- Not checked yetcites [14] Debray TPA Damen JAAG Snell KIE, et al. A guide to systematic review and meta-analysis of prediction model performance. BMJ 2017; 356: i6460– i6460. 28057641 source
boostedcorrelational- Asserted: passes — The authors put it forward as true.
- Checkable: passes — It can be checked against evidence.
- Load-bearing: unclear — It is unclear whether the paper’s conclusions depend on it.
- Based: passes — The paper gives a reason why it holds.
It may state two separate claims as one.
In the paper
“Alternatively, we may treat the total number of observed events as count data in a one-stage random-effects model43”
§ A framework for meta-analysis of prediction model studies with binary and time-to-event outcomes > 4 Meta-analysis > 4.3 Model calibration
What the sources say
- Not checked yetcites [43] Stijnen T Hamza TH Zdemir P Random effects meta-analysis of event outcome in the framework of the generalized linear mixed model with applications in sparse data. Stat Med 2010; 29: 3046– 3067. 20827667 source
hedged- Asserted: passes — The authors put it forward as true.
- Checkable: passes — It can be checked against evidence.
- Load-bearing: fails — The paper’s conclusions may not depend on it.
- Based: passes — The paper gives a reason why it holds.
Probably not a substantial claim. The paper’s conclusions may not depend on it.
None of the sources cited for this claim have been checked yet.
In the paper
“Although validation studies do not commonly report the definition and estimation method of presented c-statistics, Harrell’s version21 appears to be most widespread and recommended.22”
§ A framework for meta-analysis of prediction model studies with binary and time-to-event outcomes > 3 Data extraction and estimating unreported results to facilitate meta-analysis > 3.1 Model discrimination
What the sources say
- Not checked yetcites [21] Harrell FE Califf RM Pryor DB, et al. Evaluating the yield of medical tests. JAMA 1982; 247: 2543– 2546. 7069920 source
- Not checked yetcites [22] Lirette ST Aban I Quantifying predictive accuracy in survival models. J Nucl Cardiol 2015; 24: 1998– 2003. DOI:10.1007/s12350-015-0296-z. 26481370 source
hedged- Asserted: passes — The authors put it forward as true.
- Checkable: passes — It can be checked against evidence.
- Load-bearing: fails — The paper’s conclusions may not depend on it.
- Based: passes — The paper gives a reason why it holds.
Probably not a substantial claim. The paper’s conclusions may not depend on it.
In the paper
“A recent study by Blanche et al. showed that these strategies perform similarly when censoring is independent,28 and are thus likely to yield comparable estimates of time-dependent concordance.”
§ A framework for meta-analysis of prediction model studies with binary and time-to-event outcomes > 3 Data extraction and estimating unreported results to facilitate meta-analysis > 3.1 Model discrimination
What the sources say
- Not checked yetcites [28] Blanche P Dartigues JF Jacqmin-Gadda H Review and comparison of ROC curve estimators for a time-dependent outcome with marker-dependent censoring. Biom J 2013; 55: 687– 704. 23794418 source
hedged- Asserted: passes — The authors put it forward as true.
- Checkable: passes — It can be checked against evidence.
- Load-bearing: passes — The paper’s conclusions depend on it.
- Based: passes — The paper gives a reason why it holds.
It may state two separate claims as one.
The paper states this without a source or data behind it here, so there is nothing to check it against. The quote shows it is in the paper.
In the paper
“For prediction models with a survival outcome, Oij and Nij represent quantities for specific (and same) time periods, and should be adjusted when drop-out occurred or when studies evaluated different time periods”
§ A framework for meta-analysis of prediction model studies with binary and time-to-event outcomes > 4 Meta-analysis > 4.3 Model calibration
plain- Asserted: passes — The authors put it forward as true.
- Checkable: passes — It can be checked against evidence.
- Load-bearing: passes — The paper’s conclusions depend on it.
- Based: passes — The paper gives a reason why it holds.
Probably not a substantial claim. It may state two separate claims as one.
None of the sources cited for this claim have been checked yet.
In the paper
“For instance, validation studies rarely present information on the calibration intercept and slope, or different studies report estimates for different risk strata or time horizons.”
§ A framework for meta-analysis of prediction model studies with binary and time-to-event outcomes > 3 Data extraction and estimating unreported results to facilitate meta-analysis > 3.4 Model calibration
What the sources say
- Not checked yetcites [11] Collins GS de Groot JA Dutton S, et al. External validation of multivariable prediction models: a systematic review of methodological conduct and reporting. BMC Med Res Methodol 2014; 14: 40– 40. 24645774 PMC3999945 source
- Not checked yetcites [16] Bouwmeester W Zuithoff NPA Mallett S, et al. Reporting and methods in clinical prediction research: a systematic review. PLoS Med 2012; 9: 1– 12. PMC3358324 22629234 source
plain- Asserted: passes — The authors put it forward as true.
- Checkable: passes — It can be checked against evidence.
- Load-bearing: passes — The paper’s conclusions depend on it.
- Based: passes — The paper gives a reason why it holds.
It may state two separate claims as one.
In the paper
“Further, as we will discuss in the next section, estimates of the total O:E ratio and its standard error should be transformed to the (natural) log scale prior to meta-analysis.30”
§ A framework for meta-analysis of prediction model studies with binary and time-to-event outcomes > 3 Data extraction and estimating unreported results to facilitate meta-analysis > 3.4 Model calibration
What the sources say
- Not checked yetcites [30] Snell KI Ensor J Debray TP, et al. Meta-analysis of prediction model performance across multiple studies: which scale helps ensure between-study normality for the C -statistic and calibration measures? Stat Meth Med Res 2017, pp. 096228021770567– 096228021770567. DOI:10.1177/0962280217705678. PMC6193210 28480827
plain- Asserted: passes — The authors put it forward as true.
- Checkable: passes — It can be checked against evidence.
- Load-bearing: passes — The paper’s conclusions depend on it.
- Based: passes — The paper gives a reason why it holds.
Probably not a substantial claim.
- The authors state this as an assumption: Study-specific performance estimates are approximately normally distributed on the logit or log scale.
In the paper
“As a result, random effects models usually yield larger confidence intervals and assign study weights that are more similar to one another than those under fixed effect meta-analysis.40”
§ A framework for meta-analysis of prediction model studies with binary and time-to-event outcomes > 4 Meta-analysis > 4.1 Meta-analysis models
What the sources say
- Not checked yetcites [40] Borenstein M Hedges LV Higgins JPT, et al. A basic introduction to fixed-effect and random-effects models for meta-analysis. Res Synth Meth 2010; 1: 97– 111. 26061376 source
hedgeddirect- Asserted: passes — The authors put it forward as true.
- Checkable: passes — It can be checked against evidence.
- Load-bearing: fails — The paper’s conclusions may not depend on it.
- Based: passes — The paper gives a reason why it holds.
Probably not a substantial claim. The paper’s conclusions may not depend on it. It may state two separate claims as one.
- The authors state this as an assumption: In random effects meta-analysis, variation in predictive performance across studies may arise from chance and between-study heterogeneity.
None of the sources cited for this claim have been checked yet.
In the paper
“For prediction models with a time-to-event outcome, concordance is not uniquely defined and several variations of the c-statistic have been proposed.22,23 These variations typically adopt different strategies to account for ties or censoring, and may thus lead to different values for c.”
§ A framework for meta-analysis of prediction model studies with binary and time-to-event outcomes > 3 Data extraction and estimating unreported results to facilitate meta-analysis > 3.1 Model discrimination
What the sources say
- Not checked yetcites [22] Lirette ST Aban I Quantifying predictive accuracy in survival models. J Nucl Cardiol 2015; 24: 1998– 2003. DOI:10.1007/s12350-015-0296-z. 26481370 source
- Not checked yetcites [23] Austin PC Pencinca MJ Steyerberg EW Predictive accuracy of novel risk factors and markers: a simulation study of the sensitivity of different performance measures for the Cox proportional hazards regression model. Stat Methods Med Res 2015; 26: 1053– 1077. DOI:10.1177/ 0962280214567141. 25656552 PMC5499735 source
hedgedconditional- Asserted: passes — The authors put it forward as true.
- Checkable: passes — It can be checked against evidence.
- Load-bearing: passes — The paper’s conclusions depend on it.
- Based: passes — The paper gives a reason why it holds.
It may state two separate claims as one.
In the paper
“This Cox proportional hazards regression model was developed in 1998 for predicting the 10-year risk of CHD in the general population free from CHD and not on treatment”
§ A framework for meta-analysis of prediction model studies with binary and time-to-event outcomes > 2 Motivating examples
What the sources say
- Not checked yetcites [4] Wilson PW D’Agostino RB Levy D, et al. Prediction of coronary heart disease using risk factor categories. Circulation 1998; 97: 1837– 1847. 9603539 source
plain- Asserted: passes — The authors put it forward as true.
- Checkable: passes — It can be checked against evidence.
- Load-bearing: fails — The paper’s conclusions may not depend on it.
- Based: passes — The paper gives a reason why it holds.
Probably not a substantial claim. The paper’s conclusions may not depend on it. It may state two separate claims as one.
None of the sources cited for this claim have been checked yet.
In the paper
“This index quantifies prognostic separation of survival curves and is closely related to the standard deviation of the prognostic index, with Jinks et al. suggesting an equation to convert c values to D values based on empirical evidence25”
§ A framework for meta-analysis of prediction model studies with binary and time-to-event outcomes > 3 Data extraction and estimating unreported results to facilitate meta-analysis > 3.1 Model discrimination
What the sources say
- Not checked yetcites [24] Royston P Sauerbrei W A new measure of prognostic separation in survival data. Stat Med 2004; 23: 723– 748. 14981672 source
- Not checked yetcites [25] Jinks RC Royston P Parmar MKB Discrimination-based sample size calculations for multivariable prognostic models for time-to-event data. BMC Med Res Methodol 2015; 15: 82– 82. 26459415 PMC4603804 source
plaincorrelational- Asserted: passes — The authors put it forward as true.
- Checkable: passes — It can be checked against evidence.
- Load-bearing: passes — The paper’s conclusions depend on it.
- Based: passes — The paper gives a reason why it holds.
It may state two separate claims as one.
None of the sources cited for this claim have been checked yet.
In the paper
“In the standard DerSimonian and Laird approach, the heterogeneity parameter τ2 is estimated separately and subsequently inserted in the equations above.44,45”
§ A framework for meta-analysis of prediction model studies with binary and time-to-event outcomes > 4 Meta-analysis > 4.4 The frequentist approach for random effects meta-analysis
What the sources say
- Not checked yetcites [44] DerSimonian R Laird N Meta-analysis in clinical trials. Control Clin Trial 1986; 7: 177– 188. 3802833 source
- Not checked yetcites [45] Veroniki AA Jackson D Viechtbauer W, et al. Methods to estimate the between-study variance and its uncertainty in meta-analysis. Res Synth Meth 2016; 7: 55– 79. PMC4950030 26332144 source
plain- Asserted: passes — The authors put it forward as true.
- Checkable: passes — It can be checked against evidence.
- Load-bearing: fails — The paper’s conclusions may not depend on it.
- Based: passes — The paper gives a reason why it holds.
Probably not a substantial claim. The paper’s conclusions may not depend on it.
In the paper
“A recent systematic review identified 23 studies examining the performance of Framingham Wilson for predicting fatal or nonfatal CHD in male populations”
§ A framework for meta-analysis of prediction model studies with binary and time-to-event outcomes > 2 Motivating examples
What the sources say
- Not checked yetcites [18] Damen JAAG Pajouheshnia R Heus P, et al. Performance of the Framingham risk models and pooled cohort equations: a systematic review and meta-analysis. PLOS ONE 2018 Under review (submitted). PMC6563379 31189462
plain- Asserted: passes — The authors put it forward as true.
- Checkable: passes — It can be checked against evidence.
- Load-bearing: fails — The paper’s conclusions may not depend on it.
- Based: passes — The paper gives a reason why it holds.
Probably not a substantial claim. The paper’s conclusions may not depend on it.
None of the sources cited for this claim have been checked yet.
In the paper
“For instance, for prediction models with a binary outcome, the c-statistic is a reparameterization of Somer’s D,19 and can also be derived from the distribution of the linear predictor,20 Cohen’s effect size,20 or several correlation indices.21”
§ A framework for meta-analysis of prediction model studies with binary and time-to-event outcomes > 3 Data extraction and estimating unreported results to facilitate meta-analysis > 3.1 Model discrimination
What the sources say
- Not checked yetcites [19] Newson R Parameters behind nonparametric statistics: Kendalls tau, Somers D and median differences. Stata J 2002; 2: 45– 64. source
- Not checked yetcites [20] Austin PC Steyerberg EW Interpreting the concordance statistic of a logistic regression model: relation to the variance and odds ratio of a continuous explanatory variable. BMC Med Res Methodol 2012; 12: 82– 82. 22716998 PMC3528632 source
- Not checked yetcites [21] Harrell FE Califf RM Pryor DB, et al. Evaluating the yield of medical tests. JAMA 1982; 247: 2543– 2546. 7069920 source
plaincorrelational- Asserted: passes — The authors put it forward as true.
- Checkable: passes — It can be checked against evidence.
- Load-bearing: passes — The paper’s conclusions depend on it.
- Based: passes — The paper gives a reason why it holds.
It may state two separate claims as one.
None of the sources cited for this claim have been checked yet.
In the paper
“In a meta-analysis without access to individual participant data (IPD), we are reliant on extracting these performance measures from study publications. However, they are often poorly reported.”
§ A framework for meta-analysis of prediction model studies with binary and time-to-event outcomes > 3 Data extraction and estimating unreported results to facilitate meta-analysis
What the sources say
- Not checked yetcites [11] Collins GS de Groot JA Dutton S, et al. External validation of multivariable prediction models: a systematic review of methodological conduct and reporting. BMC Med Res Methodol 2014; 14: 40– 40. 24645774 PMC3999945 source
- Not checked yetcites [16] Bouwmeester W Zuithoff NPA Mallett S, et al. Reporting and methods in clinical prediction research: a systematic review. PLoS Med 2012; 9: 1– 12. PMC3358324 22629234 source
plain- Asserted: passes — The authors put it forward as true.
- Checkable: passes — It can be checked against evidence.
- Load-bearing: passes — The paper’s conclusions depend on it.
- Based: passes — The paper gives a reason why it holds.
It may state two separate claims as one.
The paper states this without a source or data behind it here, so there is nothing to check it against. The quote shows it is in the paper.
In the paper
“When missing, the standard error of the total O:E ratio can directly be derived from the total number of observed events.”
§ A framework for meta-analysis of prediction model studies with binary and time-to-event outcomes > 3 Data extraction and estimating unreported results to facilitate meta-analysis > 3.4 Model calibration
plaindirect- Asserted: passes — The authors put it forward as true.
- Checkable: passes — It can be checked against evidence.
- Load-bearing: fails — The paper’s conclusions may not depend on it.
- Based: fails — The paper may give no reason why it holds.
Probably not a substantial claim. The paper’s conclusions may not depend on it. The paper may give no reason why it holds.
In the paper
“In a recent review,17 23 validations of EuroSCORE II were identified in which its predictive performance was examined in patients undergoing cardiac surgery.”
§ A framework for meta-analysis of prediction model studies with binary and time-to-event outcomes > 2 Motivating examples
What the sources say
- Not checked yetcites [17] Guida P Mastro F Scrascia G, et al. Performance of the European System for Cardiac Operative Risk Evaluation II: a meta-analysis of 22 studies involving 145,592 cardiac surgery procedures. J Thorac Cardiovasc Surg 2014; 148: 3049–3057.e1. 25161130 source
plain- Asserted: passes — The authors put it forward as true.
- Checkable: passes — It can be checked against evidence.
- Load-bearing: fails — The paper’s conclusions may not depend on it.
- Based: passes — The paper gives a reason why it holds.
Probably not a substantial claim. The paper’s conclusions may not depend on it.
What the paper did — it cites no source for this, so there is none to check. The quote shows it is in the paper.
In the paper
“The calibration slope could not be estimated for EuroSCORE II because subgroup-specific event rates were not extracted from the validation studies and the slope itself was not directly provided.”
§ A framework for meta-analysis of prediction model studies with binary and time-to-event outcomes > 4 Meta-analysis > 4.7 EuroSCORE II
plaindirect- Asserted: passes — The authors put it forward as true.
- Checkable: passes — It can be checked against evidence.
- Load-bearing: unclear — It is unclear whether the paper’s conclusions depend on it.
- Based: passes — The paper gives a reason why it holds.
It may state two separate claims as one.
A conclusion the paper draws from its own results — it cites no other source for it, so there is none to check. The quote shows it is in the paper.
In the paper
“Overall, the results suggest that, as expected, discrimination, and particularly calibration performance of EuroSCORE II substantially varied across studies.”
§ A framework for meta-analysis of prediction model studies with binary and time-to-event outcomes > 4 Meta-analysis > 4.7 EuroSCORE II
hedged- Asserted: passes — The authors put it forward as true.
- Checkable: passes — It can be checked against evidence.
- Load-bearing: passes — The paper’s conclusions depend on it.
- Based: passes — The paper gives a reason why it holds.
It may state two separate claims as one.
A conclusion the paper draws from its own results — it cites no other source for it, so there is none to check. The quote shows it is in the paper.
In the paper
“the Bayesian approach is more flexible and accounts for uncertainty more fully.”
§ A framework for meta-analysis of prediction model studies with binary and time-to-event outcomes > 4 Meta-analysis > 4.5 The Bayesian approach for random effects meta-analysis
plaincorrelational- Asserted: passes — The authors put it forward as true.
- Checkable: fails — It may be too vague to check against evidence.
- Load-bearing: passes — The paper’s conclusions depend on it.
- Based: passes — The paper gives a reason why it holds.
Probably not a substantial claim. It may be too vague to check against evidence. It may state two separate claims as one.
In the paper
“prediction intervals have poor coverage when the extent of heterogeneity is limited, when few (less than 5) studies are included, or when there are a mixture of large and small studies.46”
§ A framework for meta-analysis of prediction model studies with binary and time-to-event outcomes > 4 Meta-analysis > 4.5 The Bayesian approach for random effects meta-analysis
What the sources say
- Not checked yetcites [46] Partlett C Riley RD Random effects meta-analysis: coverage performance of 95% confidence and prediction intervals following REML estimation. Stat Med 2017; 36: 301– 317. 27714841 PMC5157768 source
plaindirect- Asserted: passes — The authors put it forward as true.
- Checkable: passes — It can be checked against evidence.
- Load-bearing: passes — The paper’s conclusions depend on it.
- Based: passes — The paper gives a reason why it holds.
It may state two separate claims as one.
A conclusion the paper draws from its own results — it cites no other source for it, so there is none to check. The quote shows it is in the paper.
In the paper
“Although the average O:E ratio was close to 1, predicted risks were systematically too high or too low in certain populations as revealed by the PI.”
§ A framework for meta-analysis of prediction model studies with binary and time-to-event outcomes > 4 Meta-analysis > 4.7 EuroSCORE II
plaincorrelational- Asserted: passes — The authors put it forward as true.
- Checkable: passes — It can be checked against evidence.
- Load-bearing: passes — The paper’s conclusions depend on it.
- Based: passes — The paper gives a reason why it holds.
It may state two separate claims as one.
In the paper
“Convergence of Bayesian meta-analysis models was verified by evaluating the upper confidence limits of the potential scale reduction factor (values ≤1.05 were considered as converged).60”
§ A framework for meta-analysis of prediction model studies with binary and time-to-event outcomes > 4 Meta-analysis > 4.6 Empirical examples
What the sources say
- Not checked yetcites [60] Gelman A Rubin DB Inference from iterative simulation using multiple sequences. Stat Science 1992; 7: 457– 472. source
plain- Asserted: passes — The authors put it forward as true.
- Checkable: passes — It can be checked against evidence.
- Load-bearing: fails — The paper’s conclusions may not depend on it.
- Based: passes — The paper gives a reason why it holds.
Probably not a substantial claim. The paper’s conclusions may not depend on it.
None of the sources cited for this claim have been checked yet.
In the paper
“Results from previous studies suggest that these methods are most likely to yield discordance when there is low between-study heterogeneity, when there are few studies for meta-analysis, or when studies are small or based on different sample sizes.46,65,66”
§ A framework for meta-analysis of prediction model studies with binary and time-to-event outcomes > 6 Conclusion
What the sources say
- Not checked yetcites [46] Partlett C Riley RD Random effects meta-analysis: coverage performance of 95% confidence and prediction intervals following REML estimation. Stat Med 2017; 36: 301– 317. 27714841 PMC5157768 source
- Not checked yetcites [65] Sidik K Jonkman JN A comparison of heterogeneity variance estimators in combining results of studies. Stat Med 2007; 26: 1964– 1981. 16955539 source
- Not checked yetcites [66] Langan D Higgins JPT Simmonds M Comparative performance of heterogeneity variance estimators in meta-analysis: a review of simulation studies. Res Synth Meth 2017; 8: 181– 198. DOI: 10.1002/jrsm.1198. 27060925 source
hedgedcorrelational- Asserted: passes — The authors put it forward as true.
- Checkable: passes — It can be checked against evidence.
- Load-bearing: unclear — It is unclear whether the paper’s conclusions depend on it.
- Based: passes — The paper gives a reason why it holds.
It may state two separate claims as one.
The paper states this without a source or data behind it here, so there is nothing to check it against. The quote shows it is in the paper.
In the paper
“Although meta-regression may help to identify sources of heterogeneity and poor model transportability, the power for this is often low.”
§ A framework for meta-analysis of prediction model studies with binary and time-to-event outcomes > 5 Investigating sources of heterogeneity > 5.1 Meta-regression models
hedgedconditional- Asserted: passes — The authors put it forward as true.
- Checkable: passes — It can be checked against evidence.
- Load-bearing: fails — The paper’s conclusions may not depend on it.
- Based: fails — The paper may give no reason why it holds.
Probably not a substantial claim. The paper’s conclusions may not depend on it. The paper may give no reason why it holds. It may state two separate claims as one.
The paper states this without a source or data behind it here, so there is nothing to check it against. The quote shows it is in the paper.
In the paper
“This interval provides a range for the predicted model performance in a new validation of the model.”
§ A framework for meta-analysis of prediction model studies with binary and time-to-event outcomes > 4 Meta-analysis > 4.4 The frequentist approach for random effects meta-analysis
plain- Asserted: passes — The authors put it forward as true.
- Checkable: passes — It can be checked against evidence.
- Load-bearing: passes — The paper’s conclusions depend on it.
- Based: passes — The paper gives a reason why it holds.
Probably not a substantial claim.
In the paper
“Quantitative synthesis of prediction model studies may help to better understand their potential generalizability and can be achieved by applying meta-analysis methods.14”
§ A framework for meta-analysis of prediction model studies with binary and time-to-event outcomes > 6 Conclusion
What the sources say
- Not checked yetcites [14] Debray TPA Damen JAAG Snell KIE, et al. A guide to systematic review and meta-analysis of prediction model performance. BMJ 2017; 356: i6460– i6460. 28057641 source
hedgedconditional- Asserted: passes — The authors put it forward as true.
- Checkable: passes — It can be checked against evidence.
- Load-bearing: passes — The paper’s conclusions depend on it.
- Based: passes — The paper gives a reason why it holds.
It may state two separate claims as one.
In the paper
“Finally, because validation studies of a certain prediction model are often sparse, traditional (frequentist) meta-analysis models may suffer from convergence issues and yield unreliable estimates of precision and between-study heterogeneity.64”
§ A framework for meta-analysis of prediction model studies with binary and time-to-event outcomes > 6 Conclusion
What the sources say
- Not checked yetcites [64] Austin PC Estimating multilevel logistic regression models when the number of clusters is low: a comparison of different statistical software procedures. Int J Biostat 2010; 6: Article 16. PMC2949382 20949128 source
hedgedconditional- Asserted: passes — The authors put it forward as true.
- Checkable: passes — It can be checked against evidence.
- Load-bearing: passes — The paper’s conclusions depend on it.
- Based: passes — The paper gives a reason why it holds.
It may state two separate claims as one.
None of the sources cited for this claim have been checked yet.
In the paper
“Bayesian methods use formal probability models to express uncertainty about parameter values.49,50”
§ A framework for meta-analysis of prediction model studies with binary and time-to-event outcomes > 4 Meta-analysis > 4.5 The Bayesian approach for random effects meta-analysis
What the sources say
- Not checked yetcites [49] Greenland S Bayesian perspectives for epidemiological research: I. Foundations and basic methods. Int J Epidemiol 2006; 35: 765– 775. 16446352 source
- Not checked yetcites [50] Spiegelhalter DJ. Evidence synthesis. In: Senn S and Barnett V (eds.) Bayesian approaches to clinical trials and health-care evaluation. Chichester, UK: John Wiley & Sons, Ltd, 2004, pp.267–303. source
plain- Asserted: passes — The authors put it forward as true.
- Checkable: passes — It can be checked against evidence.
- Load-bearing: passes — The paper’s conclusions depend on it.
- Based: passes — The paper gives a reason why it holds.
Probably not a substantial claim.
The paper states this without a source or data behind it here, so there is nothing to check it against. The quote shows it is in the paper.
In the paper
“Heterogeneity may also arise when reported performance estimates are based on “improper” validations where certain predictors were neglected (e.g. due to missing data) or where various model parameters have been adjusted (e.g. intercept update).”
§ A framework for meta-analysis of prediction model studies with binary and time-to-event outcomes > 5 Investigating sources of heterogeneity
hedgedconditional- Asserted: passes — The authors put it forward as true.
- Checkable: passes — It can be checked against evidence.
- Load-bearing: fails — The paper’s conclusions may not depend on it.
- Based: fails — The paper may give no reason why it holds.
Probably not a substantial claim. The paper’s conclusions may not depend on it. The paper may give no reason why it holds.
A conclusion the paper draws from its own results — it cites no other source for it, so there is none to check. The quote shows it is in the paper.
In the paper
“We therefore could not attribute heterogeneity in the c-statistic to these differences.”
§ A framework for meta-analysis of prediction model studies with binary and time-to-event outcomes > 5 Investigating sources of heterogeneity > 5.3 EuroSCORE II
plain- Asserted: passes — The authors put it forward as true.
- Checkable: passes — It can be checked against evidence.
- Load-bearing: unclear — It is unclear whether the paper’s conclusions depend on it.
- Based: passes — The paper gives a reason why it holds.
It may state two separate claims as one.
In the paper
“Recently, Partlett and Riley showed that this equation has poor coverage in many situations, and requires improvement.46”
§ A framework for meta-analysis of prediction model studies with binary and time-to-event outcomes > 4 Meta-analysis > 4.4 The frequentist approach for random effects meta-analysis
What the sources say
- Not checked yetcites [46] Partlett C Riley RD Random effects meta-analysis: coverage performance of 95% confidence and prediction intervals following REML estimation. Stat Med 2017; 36: 301– 317. 27714841 PMC5157768 source
plain- Asserted: passes — The authors put it forward as true.
- Checkable: passes — It can be checked against evidence.
- Load-bearing: passes — The paper’s conclusions depend on it.
- Based: passes — The paper gives a reason why it holds.
It may state two separate claims as one.
The paper states this without a source or data behind it here, so there is nothing to check it against. The quote shows it is in the paper.
In the paper
“The Student-t (rather than the Normal) distribution is chosen to account for the uncertainty in τ2.”
§ A framework for meta-analysis of prediction model studies with binary and time-to-event outcomes > 4 Meta-analysis > 4.4 The frequentist approach for random effects meta-analysis
plaindirect- Asserted: passes — The authors put it forward as true.
- Checkable: passes — It can be checked against evidence.
- Load-bearing: passes — The paper’s conclusions depend on it.
- Based: passes — The paper gives a reason why it holds.
Probably not a substantial claim.
In the paper
“more advanced (so-called one-stage) approaches exist to directly combine the IPD with published summary data.67”
§ A framework for meta-analysis of prediction model studies with binary and time-to-event outcomes > 6 Conclusion
What the sources say
- Not checked yetcites [67] Debray TPA Moons KGM van Valkenhoef G, et al. Get real in individual participant data (IPD) meta-analysis: a review of the methodology. Res Synth Meth 2015; 6: 239– 309. PMC5042043 26287812 source
plain- Asserted: passes — The authors put it forward as true.
- Checkable: passes — It can be checked against evidence.
- Load-bearing: fails — The paper’s conclusions may not depend on it.
- Based: passes — The paper gives a reason why it holds.
Probably not a substantial claim. The paper’s conclusions may not depend on it.
The paper states this without a source or data behind it here, so there is nothing to check it against. The quote shows it is in the paper.
In the paper
“In addition, estimates of a model’s predictive performance are likely to be affected by the presence of between-study heterogeneity.”
§ A framework for meta-analysis of prediction model studies with binary and time-to-event outcomes > 6 Conclusion
hedgedconditional- Asserted: passes — The authors put it forward as true.
- Checkable: passes — It can be checked against evidence.
- Load-bearing: passes — The paper’s conclusions depend on it.
- Based: fails — The paper may give no reason why it holds.
Probably not a substantial claim. The paper may give no reason why it holds.
The paper states this without a source or data behind it here, so there is nothing to check it against. The quote shows it is in the paper.
In the paper
“In addition, meta-regression may suffer from study-level confounding (also known as ecological bias) when analyzing aggregate patient (average) information.”
§ A framework for meta-analysis of prediction model studies with binary and time-to-event outcomes > 5 Investigating sources of heterogeneity > 5.1 Meta-regression models
hedgedconditional- Asserted: passes — The authors put it forward as true.
- Checkable: passes — It can be checked against evidence.
- Load-bearing: fails — The paper’s conclusions may not depend on it.
- Based: fails — The paper may give no reason why it holds.
Probably not a substantial claim. The paper’s conclusions may not depend on it. The paper may give no reason why it holds.
None of the sources cited for this claim have been checked yet.
In the paper
“Common sources of heterogeneity are differences in study characteristics,62 differences in study quality, or differences in baseline risk across the validation studies.9,10”
§ A framework for meta-analysis of prediction model studies with binary and time-to-event outcomes > 5 Investigating sources of heterogeneity
What the sources say
- Not checked yetcites [62] Ban JW Emparanza JI Urreta I, et al. Design characteristics influence performance of clinical prediction rules in validation: a meta-epidemiological study. PLoS ONE 2016; 11: e0145779– e0145779. 26730980 PMC4701404 source
- Not checked yetcites [9] Debray TPA Vergouwe Y Koffijberg H, et al. A new framework to enhance the interpretation of external validation studies of clinical prediction models. J Clin Epidemiol 2015; 68: 279– 289. 25179855 source
- Not checked yetcites [10] Vergouwe Y Moons KGM Steyerberg EW External validity of risk models: use of benchmark values to disentangle a case-mix effect from incorrect coefficients. Am J Epidemiol 2010; 172: 971– 980. 20807737 PMC2984249 source
plaindirect- Asserted: passes — The authors put it forward as true.
- Checkable: passes — It can be checked against evidence.
- Load-bearing: unclear — It is unclear whether the paper’s conclusions depend on it.
- Based: passes — The paper gives a reason why it holds.
It may state two separate claims as one.
A conclusion the paper draws from its own results — it cites no other source for it, so there is none to check. The quote shows it is in the paper.
In the paper
“Further, adopting a Bayesian estimation framework may help to fully propagate the uncertainty resulting from estimating the within-study standard errors and the between-study standard deviation, which in turn may improve the coverage of calculated intervals.”
§ A framework for meta-analysis of prediction model studies with binary and time-to-event outcomes > 6 Conclusion
hedgedconditional- Asserted: passes — The authors put it forward as true.
- Checkable: passes — It can be checked against evidence.
- Load-bearing: fails — The paper’s conclusions may not depend on it.
- Based: fails — The paper may give no reason why it holds.
Probably not a substantial claim. The paper’s conclusions may not depend on it. The paper may give no reason why it holds. It may state two separate claims as one.
None of the sources cited for this claim have been checked yet.
In the paper
“An additional advantage of IPD is that it becomes possible to adjust discrimination performance for (variation in) subject-level covariates, and thus to gain more understanding in sources of between-study heterogeneity.9,10,26,68”
§ A framework for meta-analysis of prediction model studies with binary and time-to-event outcomes > 6 Conclusion
What the sources say
- Not checked yetcites [9] Debray TPA Vergouwe Y Koffijberg H, et al. A new framework to enhance the interpretation of external validation studies of clinical prediction models. J Clin Epidemiol 2015; 68: 279– 289. 25179855 source
- Not checked yetcites [10] Vergouwe Y Moons KGM Steyerberg EW External validity of risk models: use of benchmark values to disentangle a case-mix effect from incorrect coefficients. Am J Epidemiol 2010; 172: 971– 980. 20807737 PMC2984249 source
- Not checked yetcites [26] White IR Rapsomaniki E Emerging Risk Factors Collaboration. Covariate-adjusted measures of discrimination for survival data. Biom J 2015; 57: 592– 613. 25530064 PMC4666552 source
- Not checked yetcites [68] van Klaveren D Gnen M Steyerberg EW, et al. A new concordance measure for risk prediction models in external validation settings. Stat Med 2016; 35: 4136– 4152. DOI:10.1002/sim.6997. 27251001 PMC5550798 source
plaindirect- Asserted: passes — The authors put it forward as true.
- Checkable: passes — It can be checked against evidence.
- Load-bearing: unclear — It is unclear whether the paper’s conclusions depend on it.
- Based: passes — The paper gives a reason why it holds.
It may state two separate claims as one.
In the paper
“This is particularly relevant when confronting sparse data, multiple comparisons, collinearity, or non-identification, and for deriving PI.51”
§ A framework for meta-analysis of prediction model studies with binary and time-to-event outcomes > 4 Meta-analysis > 4.5 The Bayesian approach for random effects meta-analysis
What the sources say
- Not checked yetcites [51] Higgins JPT Thompson SG Spiegelhalter DJ A re-evaluation of random-effects meta-analysis. J R Stat Soc Ser A Stat Soc 2009; 172: 137– 159. PMC2667312 19381330 source
plaincorrelational- Asserted: passes — The authors put it forward as true.
- Checkable: passes — It can be checked against evidence.
- Load-bearing: passes — The paper’s conclusions depend on it.
- Based: passes — The paper gives a reason why it holds.
It may state two separate claims as one.
The authors state this as an assumption.
D values can be converted to c values by making distributional assumptions about the standard deviation of the prognostic index.
“It is also possible to convert D values to c values by making distributional assumptions with respect to the standard deviation of the prognostic index.26”
The authors state this as an assumption.
Observed and expected event counts for different follow-up times can be extrapolated by assuming a Poisson distribution.
“an alternative strategy that does not discard information is to apply extrapolation by assuming a Poisson distribution (Supporting Information 3.2).”
The authors state this as an assumption.
Study-specific performance estimates are approximately normally distributed on the logit or log scale.
“The logit transformation is applied to improve the validity of the Normality assumption, which is used to model variability around the summary c-statistic.30”
The authors state this as an assumption.
In random effects meta-analysis, variation in predictive performance across studies may arise from chance and between-study heterogeneity.
“In random effects meta-analysis models, it is assumed that variation in predictive performance measures across studies may not only appear due to chance, but is also prone to the (potential) presence of between-study heterogeneity.”
The paper relies on this without support.
Validations of a specific model and existing evidence or data on predictive performance measures are often sparse.
“validations of a specific model and thus existing evidence or data on predictive performance measures are often sparse.”
The authors state this as an assumption.
Prior independence of μ and τ holds.
“we assume prior independence of μ and τ.51”
The authors state this as an assumption.
Covariate effects γ are (roughly) linear on the meta-analysis scale.
“it assumes that covariate effects γ are (roughly) linear on the meta-analysis scale.”
Claims other papers make about this one
Each is checked against this paper’s own text: does it say what the citing paper says it does?
In the citing paper
“Meta-analysis and meta-regression methods can be used to quantify and understand heterogeneity in performance across external validation studies.”
From Evaluation of performance measures in predictive artificial intelligence models to support medical decisions: overview and guidance (2025) · cites this paper as [105]
Self-check
Percentages, sums and reported differences re-computed from the paper’s own numbers.
Each contradiction between two passages listed here was confirmed by an independent check.
Rated major: it would touch a result — a value a result rests on, reported and recomputed p-values on opposite sides of the significance level, two passages that conflict with no sign which is right, or a cited work retracted before this paper was published.
In the paper
§ A framework for meta-analysis of prediction model studies with binary and time-to-event outcomes > 5 Investigating sources of heterogeneity > 5.4 Framingham
“For the calibration performance, we found that under-estimation (i.e. O:E<1) notably occurred in low-risk populations (p < 0.01, Figure 4).”
§ A framework for meta-analysis of prediction model studies with binary and time-to-event outcomes > 4 Meta-analysis > 4.8 Framingham
“Although the 10-year predicted risk of CHD occurrence was usually too large (summary O:E=0.6)”
Citations
Cites
Meta-analysis in clinical trials
DerSimonian, R., & Laird, N. (1986) · Controlled Clinical Trials · doi:10.1016/0197-2456(86)90046-2 · Cited by 39,552 · cited 1×
“In the standard DerSimonian and Laird approach, the heterogeneity parameter 2 is estimated separately and subsequently inserted in the equations above.(44,45) We recommend to use restricted maximum likelihood (REML) estimation to account for the simultaneous estimation of and .”
MethodConducting Meta-Analyses in R with the metafor Package
Viechtbauer, W. (2010) · Journal of Statistical Software · doi:10.18637/jss.v036.i03 · Cited by 20,464
Inference from iterative simulation using multiple sequences
Gelman, A., & Rubin, D. B. (1992) · Statistical Science · doi:10.1214/ss/1177011136 · Cited by 16,627 · cited 1×
“Convergence of Bayesian metaanalysis models was verified by evaluating the upper confidence limits of the potential scale reduction factor (values 1:05 were considered as converged).(60)”
MethodNishimura, R., Osako, T., Nishiyama, Y., Tashima, R., Nakano, M., Fujisue, M., Toyozumi, Y., & Arima, N. (2013) · Oncology · doi:10.1159/000353099 · Cited by 13,239
Prediction of coronary heart disease using risk factor categories
Wilson, P. W. F., D’Agostino, R. B., Levy, D., Belanger, A. M., Silbershatz, H., & Kannel, W. B. (1998) · Circulation · doi:10.1161/01.cir.97.18.1837 · Cited by 9,581 · cited 3×
“In the second example, we meta-analyze the predictive performance of the Framingham Risk Score developed by Wilson et al.4 This Cox proportional hazards regression model was developed in 1998 for predicting the 10-year risk of CHD in the general population free from CHD and not on treatment (Supporting Information 1.2…”
MethodInfluentialA basic introduction to fixed-effect and random-effects models for meta-analysis
Borenstein, M., Hedges, L. V., Higgins, J. P. T., & Rothstein, H. R. (2010) · Research Synthesis Methods · doi:10.1002/jrsm.12 · Cited by 6,793 · cited 1×
“As a result, random effects models usually yield larger confidence intervals and assign study weights that are more similar to one another than those under fixed effect meta-analysis.(40) Although both types of aforementioned meta-analysis models have limitations, and following the guidance of meta-analysis of interve…”
Assessing the Performance of Prediction Models: A Framework for Traditional and Novel Measures
Steyerberg, E. W., Vickers, A. J., Cook, N. R., Gerds, T., Gonen, M., Obuchowski, N., Pencina, M. J., & Kattan, M. W. (2010) · Epidemiology · doi:10.1097/ede.0b013e3181c30fb2 · Cited by 5,170 · cited 1×
“For prediction models for binary outcomes as well as for time-to-event outcomes, common measures are the calibration intercept and slope.(34) The intercept is also known as calibration-in-the-large, and indicates whether predicted probabilities are, on average, too high (intercept below 0) or too low (intercept above…”
MethodGelman, A. (2006) · Bayesian Analysis · doi:10.1214/06-ba117a · Cited by 4,050
Evaluating the Yield of Medical Tests
Harrell, F. E. (1982) · JAMA: The Journal of the American Medical Association · doi:10.1001/jama.1982.03320430047030 · Cited by 3,490 · cited 1×
“For instance, for prediction models with a binary outcome, the c-statistic is a reparameterization of Somer’s D,(19) and can also be derived from the distribution of the linear predictor,(20) Cohen’s effect size,(20) or several correlation indices.(21) An overview of relevant equations for this derivation of the c-sta…”
MethodNashef, S. A. M., Roques, F., Sharples, L. D., Nilsson, J., Smith, C., Goldstone, A. R., & Lockowandt, U. (2012) · European Journal of Cardio-Thoracic Surgery · doi:10.1093/ejcts/ezs043 · Cited by 2,971 · cited 1×
“This logistic regression model was developed using 16,828 adult patients from 43 countries to predict mortality after cardiac surgery.(3) The corresponding prediction model equations are presented in Supporting Information 1.”
MethodInterpretation of random effects meta-analyses
Riley, R. D., Higgins, J. P. T., & Deeks, J. J. (2011) · BMJ · doi:10.1136/bmj.d549 · Cited by 2,884 · cited 1×
“Finally, for meta-analysis of model discrimination and calibration, we recommend the calculation of an (approximate) 95% prediction interval (PI) to depict the extent of between-study heterogeneity.(48) This interval provides a range for the predicted model performance in a new validation of the model.”
MethodSelf-citationA Re-Evaluation of Random-Effects Meta-Analysis
Higgins, J. P. T., Thompson, S. G., & Spiegelhalter, D. J. (2009) · Journal of the Royal Statistical Society Series A: Statistics in Society · doi:10.1111/j.1467-985x.2008.00552.x · Cited by 2,569 · cited 5×
“Although the average O : E ratio was close to 1, predicted risks were systematically too high or too low in certain populations as revealed by the PI.”
BackgroundInfluentialMoons, K. G. M., de Groot, J. A. H., Bouwmeester, W., Vergouwe, Y., Mallett, S., Altman, D. G., Reitsma, J. B., & Collins, G. S. (2014) · PLoS Medicine · doi:10.1371/journal.pmed.1001744 · Cited by 2,018
Self-citationMethods to estimate the between‐study variance and its uncertainty in meta‐analysis
Veroniki, A. A., Jackson, D., Viechtbauer, W., Bender, R., Bowden, J., Knapp, G., Kuss, O., Higgins, J. P., Langan, D., & Salanti, G. (2016) · Research Synthesis Methods · doi:10.1002/jrsm.1164 · Cited by 1,685 · cited 1×
“In the standard DerSimonian and Laird approach, the heterogeneity parameter 2 is estimated separately and subsequently inserted in the equations above.(44,45) We recommend to use restricted maximum likelihood (REML) estimation to account for the simultaneous estimation of and .”
MethodOehlert, G. (1992) · The American Statistician · doi:10.1080/00031305.1992.10475842 · Cited by 1,629 · cited 1×
“The logit c-statistic is simply given by lnðc=ð1 cÞÞ, and its standard error can be approximated by applying the delta method.(31) This then yields(14)”
MethodAdvanced methods in meta‐analysis: multivariate approach and meta‐regression
van Houwelingen, H. C., Arends, L. R., & Stijnen, T. (2002) · Statistics in Medicine · doi:10.1002/sim.1040 · Cited by 1,599 · cited 1×
“1 Meta-regression models We extend the presented meta-analysis models as follows to investigate sources of between-study heterogeneity.(63) Let Xi denote the (row)vector of covariates of study i including the constant term.”
Prognosis Research Strategy (PROGRESS) 3: Prognostic Model Research
Steyerberg, E. W., Moons, K. G. M., van der Windt, D. A., Hayden, J. A., Perel, P., Schroter, S., Riley, R. D., Hemingway, H., Altman, D. G., & for the PROGRESS Group (2013) · PLoS Medicine · doi:10.1371/journal.pmed.1001381 · Cited by 1,508 · cited 1×
“Prediction models can, for instance, be used to inform patients and their treating physicians, to decide upon the administration of subsequent testing (diagnostic models) or treatments (prognostic models), or to identify participants for clinical trials.(1,2) Well-known examples are the European system for cardiac ope…”
BackgroundSelf-citationPrognosis and prognostic research: what, why, and how?
Moons, K. G. M., Royston, P., Vergouwe, Y., Grobbee, D. E., & Altman, D. G. (2009) · BMJ · doi:10.1136/bmj.b375 · Cited by 1,337 · cited 1×
“Prediction models can, for instance, be used to inform patients and their treating physicians, to decide upon the administration of subsequent testing (diagnostic models) or treatments (prognostic models), or to identify participants for clinical trials.(1,2) Well-known examples are the European system for cardiac ope…”
BackgroundSelf-citationRisk prediction models: II. External validation, model updating, and impact assessment
Moons, K. G. M., Kengne, A. P., Grobbee, D. E., Royston, P., Vergouwe, Y., Altman, D. G., & Woodward, M. (2012) · Heart · doi:10.1136/heartjnl-2011-301247 · Cited by 1,195 · cited 1×
“More efforts are therefore needed to evaluate the performance of existing models in new settings and populations, and to adjust them if necessary.(6) In contrast to redevelopment, validation and updating of prediction models allows to (more effectively) account for information already captured in previous studies, and…”
BackgroundSelf-citationPenalising Model Component Complexity: A Principled, Practical Approach to Constructing Priors
Simpson, D., Rue, H., Riebler, A., Martins, T. G., & Sørbye, S. H. (2017) · Statistical Science · doi:10.1214/16-sts576 · Cited by 1,113 · cited 2×
“In line with previous recommendations,(51,55) we consider empirically-based priors for discr, cal:OE and cal:slope to rule out unreasonable values for these parameters and to allow for regularization when few studies are available for meta-analysis.(54) Therefore, we retrieved heterogeneity estimates from more than 20…”
MethodPrediction models for cardiovascular disease risk in the general population: systematic review
Damen, J. A. A. G., Hooft, L., Schuit, E., Debray, T. P. A., Collins, G. S., Tzoulaki, I., Lassale, C. M., Siontis, G. C. M., Chiocchia, V., Roberts, C., et al. (2016) · BMJ · doi:10.1136/bmj.i2416 · Cited by 935 · cited 1×
“For the same disease, outcome or the target population, often numerous, sometimes hundreds, prediction models have been published.(5) This practice is clearly undesirable for health-care professionals, guideline developers and patients, as it obfuscates which model to use in which context.”
BackgroundSelf-citationTime-dependent ROC curve analysis in medical research: current methods and applications
Kamarudin, A. N., Cox, T. F., & Kolamunnage‐Dona, R. (2017) · BMC Medical Research Methodology · doi:10.1186/s12874-017-0332-6 · Cited by 839 · cited 1×
“For prediction models including covariates with time-dependent effects and/or time-dependent covariates, concordance is often measured using time-dependent ROC curves.(27) Again, several variations have been proposed that adopt different strategies to account for censoring.”
MethodStijnen, T., Hamza, T. H., & Özdemir, P. (2010) · Statistics in Medicine · doi:10.1002/sim.4040 · Cited by 757
Collins, G. S., de Groot, J. A., Dutton, S., Omar, O., Shanyinde, M., Tajar, A., Voysey, M., Wharton, R., Yu, L.-M., Moons, K. G., et al. (2014) · BMC Medical Research Methodology · doi:10.1186/1471-2288-14-40 · Cited by 729 · cited 2×
“However, they are often poorly reported.(11,16) We now discuss how to retrieve the necessary but not explicitly reported predictive performance estimates from the primary prediction model (validation) studies using other reported data.”
BackgroundSelf-citationA guide to systematic review and meta-analysis of prediction model performance
Debray, T. P. A., Damen, J. A. A. G., Snell, K. I. E., Ensor, J., Hooft, L., Reitsma, J. B., Riley, R. D., & Moons, K. G. M. (2017) · BMJ · doi:10.1136/bmj.i6460 · Cited by 657 · cited 9×
“For this reason, it is often helpful to investigate potential sources of heterogeneity in the predictive performance by performing a meta-regression or subgroup analysis.(14,61) Common sources of heterogeneity are differences in study characteristics,(62) differences in study quality, or differences in baseline risk a…”
BackgroundMethodInfluentialSelf-citationReporting and Methods in Clinical Prediction Research: A Systematic Review
Bouwmeester, W., Zuithoff, N. P. A., Mallett, S., Geerlings, M. I., Vergouwe, Y., Steyerberg, E. W., Altman, D. G., & Moons, K. G. M. (2012) · PLoS Medicine · doi:10.1371/journal.pmed.1001221 · Cited by 600 · cited 3×
“However, they are often poorly reported.(11,16) We now discuss how to retrieve the necessary but not explicitly reported predictive performance estimates from the primary prediction model (validation) studies using other reported data.”
BackgroundMethodSelf-citationDebray, T. P. A., Vergouwe, Y., Koffijberg, H., Nieboer, D., Steyerberg, E. W., & Moons, K. G. M. (2015) · Journal of Clinical Epidemiology · doi:10.1016/j.jclinepi.2014.06.018 · Cited by 597 · cited 5×
“An additional advantage of IPD is that it becomes possible to adjust discrimination performance for (variation in) subject-level covariates, and thus to gain more understanding in sources of between-study heterogeneity.(9,10,26,68) Finally, methods for meta-analyzing clinical measures of performance such as net benefi…”
BackgroundMethodInfluentialSelf-citationTwo further applications of a model for binary regression
COX, D. R. (1958) · Biometrika · doi:10.1093/biomet/45.3-4.562 · Cited by 556 · cited 2×
“Conversely, the calibration slope quantifies whether predicted risks are, on average, too extreme (slope below 1) or too invariant (slope above 1).(35) Unfortunately, extraction of calibration measures is often hampered by poor assessment and reporting.”
BackgroundSteyerberg, E. W., Borsboom, G. J. J. M., van Houwelingen, H. C., Eijkemans, M. J. C., & Habbema, J. D. F. (2004) · Statistics in Medicine · doi:10.1002/sim.1844 · Cited by 552 · cited 1×
“In contrast to redevelopment, validation and updating of prediction models allows to (more effectively) account for information already captured in previous studies, and thus to make better use of existing evidence and data at hand.(7,8) The evaluation (and revision) of prediction models can be achieved by performing…”
MethodLambert, P. C., Sutton, A. J., Burton, P. R., Abrams, K. R., & Jones, D. R. (2005) · Statistics in Medicine · doi:10.1002/sim.2112 · Cited by 511
How to obtain the P value from a confidence interval
Altman, D., & Bland, J. (2011) · British medical journal · doi:10.1136/bmj.d2304 · Cited by 481 · cited 1×
“Again, this can be achieved by applying the delta method(36) or by transforming reported confidence intervals.(32) The former strategy generally yields the following approximation(14)”
MethodRandom-Effects Meta-analysis of Inconsistent Effects: A Time for Change
Cornell, J. E., Mulrow, C. D., Localio, R., Stack, C. B., Meibohm, A. R., Guallar, E., & Goodman, S. N. (2014) · Annals of Internal Medicine · doi:10.7326/m13-2886 · Cited by 453 · cited 1×
“Furthermore, when the heterogeneity is small and the study sizes are mixed, the Hartung–Knapp method produces confidence intervals that are too wide.(46,47) Similarly, prediction intervals have poor coverage when the extent of heterogeneity is limited, when few (less than 5) studies are included, or when there are a m…”
MethodA new measure of prognostic separation in survival data
Royston, P., & Sauerbrei, W. (2004) · Statistics in Medicine · doi:10.1002/sim.1621 · Cited by 450 · cited 1×
“Sometimes, discrimination is measured using Royston and Sauerbrei’s D index, usually referred to as the ‘‘D statistic’’.(24) This index quantifies prognostic separation of survival curves and is closely related to the standard deviation of the prognostic index, with Jinks et al.”
MethodTurner, R. M., Jackson, D., Wei, Y., Thompson, S. G., & Higgins, J. P. T. (2015) · Statistics in Medicine · doi:10.1002/sim.6381 · Cited by 410
Parameters behind “Nonparametric” Statistics: Kendall's tau, Somers’ D and Median Differences
Newson, R. (2002) · The Stata Journal: Promoting communications on statistics and Stata · doi:10.1177/1536867x0200200103 · Cited by 394
Bayesian perspectives for epidemiological research: I. Foundations and basic methods
Greenland, S. (2006) · International Journal of Epidemiology · doi:10.1093/ije/dyi312 · Cited by 383 · cited 1×
“Generally speaking, in contrast to frequentist methods, Bayesian methods use formal probability models to express uncertainty about parameter values.(49,50) This is particularly relevant when confronting sparse data, multiple comparisons, collinearity, or non-identification, and for deriving PI.”
MethodA comparison of heterogeneity variance estimators in combining results of studies
Sidik, K., & Jonkman, J. N. (2007) · Statistics in Medicine · doi:10.1002/sim.2688 · Cited by 380 · cited 1×
“Results from previous studies suggest that these methods are most likely to yield discordance when there is low between-study heterogeneity, when there are few studies for meta-analysis, or when studies are small or based on different sample sizes.(46,65,66) Further work is also still needed to summarize the evidence…”
ResultGeersing, G.-J., Bouwmeester, W., Zuithoff, P., Spijker, R., Leeflang, M., & Moons, K. (2012) · PLoS ONE · doi:10.1371/journal.pone.0032844 · Cited by 350
Self-citationGet real in individual participant data (IPD) meta‐analysis: a review of the methodology
Debray, T. P. A., Moons, K. G. M., van Valkenhoef, G., Efthimiou, O., Hummel, N., Groenwold, R. H. H., Reitsma, J. B., & on behalf of the GetReal methods review group (2015) · Research Synthesis Methods · doi:10.1002/jrsm.1160 · Cited by 348
Self-citationAustin, P. C., & Steyerberg, E. W. (2012) · BMC Medical Research Methodology · doi:10.1186/1471-2288-12-82 · Cited by 270 · cited 1×
“For instance, it is well known that a model’s discrimination performance tends to deteriorate when it is applied to populations or subgroups with a more homogeneous case-mix, as there is less separation of predicted risks across individuals.(9,10,20,41,42) Between-study heterogeneity may also appear when reported perf…”
BackgroundDamen, J. A., Pajouheshnia, R., Heus, P., Moons, K. G. M., Reitsma, J. B., Scholten, R. J. P. M., Hooft, L., & Debray, T. P. A. (2019) · BMC Medicine · doi:10.1186/s12916-019-1340-7 · Cited by 250
Self-citationVergouwe, Y., Moons, K. G. M., & Steyerberg, E. W. (2010) · American Journal of Epidemiology · doi:10.1093/aje/kwq223 · Cited by 243 · cited 4×
“An additional advantage of IPD is that it becomes possible to adjust discrimination performance for (variation in) subject-level covariates, and thus to gain more understanding in sources of between-study heterogeneity.(9,10,26,68) Finally, methods for meta-analyzing clinical measures of performance such as net benefi…”
BackgroundMethodInfluentialSelf-citationPartlett, C., & Riley, R. D. (2017) · Statistics in Medicine · doi:10.1002/sim.7140 · Cited by 240 · cited 5×
“Recently, Partlett and Riley showed that this equation has poor coverage in many situations, and requires improvement.(46) This motivates the Bayesian approach below.”
BackgroundMethodResultInfluentialSelf-citationBayesian perspectives for epidemiological research. II. Regression analysis
Greenland, S. (2007) · International Journal of Epidemiology · doi:10.1093/ije/dyl289 · Cited by 200 · cited 1×
“It is generally recommended to be conservative when setting the spread of the prior, and to empirically justify prior assertions.(54,55) For this reason, we here propose the use of non-informative prior distributions by assuming that discr, cal:slope, i, logitðPE, ijÞ N ð0, 10(6)Þ.”
MethodAustin, P. C. (2010) · The International Journal of Biostatistics · doi:10.2202/1557-4679.1195 · Cited by 193 · cited 1×
“Finally, because validation studies of a certain prediction model are often sparse, traditional (frequentist) meta-analysis models may suffer from convergence issues and yield unreliable estimates of precision and between-study heterogeneity.(64) For this reason, we presented several methods to overcome these 45 50 55…”
MethodNewcombe, R. G. (2006) · Statistics in Medicine · doi:10.1002/sim.2324 · Cited by 159 · cited 1×
“We here consider a method proposed by Newcombe to estimate the standard error of the c-statistic.(29)”
MethodLangan, D., Higgins, J. P. T., & Simmonds, M. (2017) · Research Synthesis Methods · doi:10.1002/jrsm.1198 · Cited by 149 · cited 1×
“Results from previous studies suggest that these methods are most likely to yield discordance when there is low between-study heterogeneity, when there are few studies for meta-analysis, or when studies are small or based on different sample sizes.(46,65,66) Further work is also still needed to summarize the evidence…”
Snell, K. I. E., Ensor, J., Debray, T. P. A., Moons, K. G. M., & Riley, R. D. (2017) · Statistical Methods in Medical Research · doi:10.1177/0962280217705678 · Cited by 130
Self-citationGuida, P., Mastro, F., Scrascia, G., Whitlock, R., & Paparella, D. (2014) · The Journal of Thoracic and Cardiovascular Surgery · doi:10.1016/j.jtcvs.2014.07.039 · Cited by 126
Blanche, P., Dartigues, J., & Jacqmin‐Gadda, H. (2013) · Biometrical Journal · doi:10.1002/bimj.201200045 · Cited by 94
Meta‐analysis and aggregation of multiple published prediction models
Debray, T. P. A., Koffijberg, H., Nieboer, D., Vergouwe, Y., Steyerberg, E. W., & Moons, K. G. M. (2014) · Statistics in Medicine · doi:10.1002/sim.6080 · Cited by 73 · cited 1×
“In contrast to redevelopment, validation and updating of prediction models allows to (more effectively) account for information already captured in previous studies, and thus to make better use of existing evidence and data at hand.(7,8) The evaluation (and revision) of prediction models can be achieved by performing…”
MethodSelf-citationBayesian estimation in random effects meta‐analysis using a non‐informative prior
Bodnar, O., Link, A., Arendacká, B., Possolo, A., & Elster, C. (2017) · Statistics in Medicine · doi:10.1002/sim.7156 · Cited by 73
Howell, N. J., Head, S. J., Freemantle, N., van der Meulen, T. A., Senanayake, E. L., Menon, A., Kappetein, A. P., & Pagano, D. (2013) · European Journal of Cardio-Thoracic Surgery · doi:10.1093/ejcts/ezt174 · Cited by 72 · cited 1×
“assessed the predictive performance of EuroSCORE II in 933 high-risk patients.(33) The observed in-hospital mortality was 9.”
MethodAssessing Risk Prediction Models Using Individual Participant Data From Multiple Studies
Pennells, L. A. M., Kaptoge, S. K., White, I. R., Thompson, S. G., Wood, A., Tipping, R., Folsom, A. R., Couper, D. J., Ballantyne, C. M., Coresh, J., et al. (2013) · American Journal of Epidemiology · doi:10.1093/aje/kwt298 · Cited by 62 · cited 1×
“For this reason, it is often helpful to investigate potential sources of heterogeneity in the predictive performance by performing a meta-regression or subgroup analysis.(14,61) Common sources of heterogeneity are differences in study characteristics,(62) differences in study quality, or differences in baseline risk a…”
BackgroundA new concordance measure for risk prediction models in external validation settings
van Klaveren, D., Gönen, M., Steyerberg, E. W., & Vergouwe, Y. (2016) · Statistics in Medicine · doi:10.1002/sim.6997 · Cited by 48
Assessing Discriminative Performance at External Validation of Clinical Prediction Models
Nieboer, D., van der Ploeg, T., & Steyerberg, E. W. (2016) · PLoS ONE · doi:10.1371/journal.pone.0148820 · Cited by 40
Austin, P. C., Pencinca, M. J., & Steyerberg, E. W. (2017) · Statistical Methods in Medical Research · doi:10.1177/0962280214567141 · Cited by 39 · cited 1×
“For prediction models with a time-to-event outcome, concordance is not uniquely defined and several variations of the c-statistic have been proposed.(22,23) These variations typically adopt different strategies to account for ties or censoring, and may thus lead to different values for c.”
BackgroundBurke, D. L., Bujkiewicz, S., & Riley, R. D. (2016) · Statistical Methods in Medical Research · doi:10.1177/0962280216631361 · Cited by 34
Self-citationJinks, R. C., Royston, P., & Parmar, M. K. (2015) · BMC Medical Research Methodology · doi:10.1186/s12874-015-0078-y · Cited by 32
(2003) · Bayesian Approaches to Clinical Trials and Health‐Care Evaluation · doi:10.1002/0470092602.ch5 · Cited by 26
Kundu, S., Mazumdar, M., & Ferket, B. S. (2017) · BMC Medical Research Methodology · doi:10.1186/s12874-017-0345-1 · Cited by 21 · cited 1×
“For instance, it is well known that a model’s discrimination performance tends to deteriorate when it is applied to populations or subgroups with a more homogeneous case-mix, as there is less separation of predicted risks across individuals.(9,10,20,41,42) Between-study heterogeneity may also appear when reported perf…”
BackgroundBan, J.-W., Emparanza, J. I., Urreta, I., & Burls, A. (2016) · PLOS ONE · doi:10.1371/journal.pone.0145779 · Cited by 18
Covariate‐adjusted measures of discrimination for survival data
White, I. R., Rapsomaniki, E., & for the Emerging Risk Factors Collaboration (2015) · Biometrical Journal · doi:10.1002/bimj.201400061 · Cited by 13 · cited 2×
“An additional advantage of IPD is that it becomes possible to adjust discrimination performance for (variation in) subject-level covariates, and thus to gain more understanding in sources of between-study heterogeneity.(9,10,26,68) Finally, methods for meta-analyzing clinical measures of performance such as net benefi…”
(2003) · Bayesian Approaches to Clinical Trials and Health‐Care Evaluation · doi:10.1002/0470092602.ch8 · Cited by 10
Buitrago, F., Hueros, J. I. C., Cañón-Barroso, L., Pozuelos, G., Molina-Martínez, L. M., Espigares-Arroyo, M., Galán‐González, J., & Lillo-Bravo, F. J. (2011) · The Annals of Family Medicine · doi:10.1370/afm.1287 · Cited by 9 · cited 1×
“analyzed the 10-year performance of the original Framingham coronary risk functions in nondiabetic patients.(37) They reported the observed (PO, t1⁄410 1⁄4 0:109) and predicted (PE, t1⁄410 1⁄4 0:169) 10-year risk estimates in a table, as well as the total number of observed events (Ot1⁄410 1⁄4 22).”
BackgroundQuantifying predictive accuracy in survival models
Lirette, S. T., & Aban, I. (2017) · Journal of Nuclear Cardiology · doi:10.1007/s12350-015-0296-z · Cited by 8 · cited 2×
“Although validation studies do not commonly report the definition and estimation method of presented c-statistics, Harrell’s version(21) appears to be most widespread and recommended.(22) Sometimes, discrimination is measured using Royston and Sauerbrei’s D index, usually referred to as the ‘‘D statistic’’.”
BackgroundMethod
Research works printed but not linked: 5
- Damen JAAG, 2016, BMJ, 353
- Damen JAAG, 2018, PLOS ONE
- Snell KI, 2017, Stat Meth Med Res, 096228021770567
- Dorfman R, 1938, Biometric Bull, 1, 129
- Plummer M. JAGS: A program for analysis of Bayesian graphical models using Gibbs sampling. In: Proceedings of the 3rd international workshop on distributed statistical computing , Vienna, Austria, March 2003.
Cited by
Sorted by citations
Moons, K. G. M., Wolff, R. F., Riley, R. D., Whiting, P. F., Westwood, M., Collins, G. S., Reitsma, J. B., Kleijnen, J., & Mallett, S. (2019) · Annals of Internal Medicine · doi:10.7326/m18-1377 · Cited by 1,669
Self-citationMinimum sample size for external validation of a clinical prediction model with a binary outcome
Riley, R. D., Debray, T. P. A., Collins, G. S., Archer, L., Ensor, J., van Smeden, M., & Snell, K. I. E. (2021) · Statistics in Medicine · doi:10.1002/sim.9025 · Cited by 400
Self-citationThere is no such thing as a validated prediction model
Van Calster, B., Steyerberg, E. W., Wynants, L., & van Smeden, M. (2023) · BMC Medicine · doi:10.1186/s12916-023-02779-w · Cited by 286
Cowley, L., Farewell, D. M., Maguire, S., & Kemp, A. (2019) · Diagnostic and Prognostic Research · doi:10.1186/s41512-019-0060-y · Cited by 271
“• If multiple validations have been performed, conduct a meta-analysis to summarise the overall performance of the CPR, using a published framework [35]”
MethodMinimum sample size for external validation of a clinical prediction model with a continuous outcome
Archer, L., Snell, K. I. E., Ensor, J., Hudda, M. T., Collins, G. S., & Riley, R. D. (2021) · Statistics in Medicine · doi:10.1002/sim.8766 · Cited by 198
Self-citation
Metadata
- Authors
- Debray, T. P., Damen, J. A., Riley, R. D., Snell, K., Reitsma, J. B., Hooft, L., Collins, G. S., & Moons, K. G.
- Affiliations
- University Medical Center Utrecht (NL)
- Keele University (GB)
- Centre for Statistics in Medicine, University of Oxford, Oxford, UK
- Corresponding author
- Debray, Thomas PA
- ORCID
- Venue
- Statistical Methods in Medical Research
- Publisher
- SAGE Publications
- Published
- 2018-07-23
- Volume
- 28
- Issue
- 9
- Pages
- 2768-2786
- ISSN
- 0962-2802 (ISSN-L)
- 1477-0334
- PMC
- PMC6728752
- OpenAlex
- W2883189216
- Semantic Scholar
- 6c2eb0b6f285a3b870e38916a4530aa254c8689f
- Cited by
- 278
- References
- 66
- Citations by year
- 2026: 55 · 2025: 53 · 2024: 46 · 2023: 46 · 2022: 33 · 2021: 22 · 2020: 13 · 2019: 7 · 2018: 1
- FWCI
- 2.12
- Type
- journal article
- Language
- en
- Open access
- hybrid
- doi.org
- Locations
- Statistical Methods in Medical Research (publishedVersion, cc-by-nc)
- PubMed Central (publishedVersion, cc-by-nc)
- PubMed (publishedVersion)
- Keele Research Repository (Keele University) (submittedVersion, cc-by)
- Utrecht University Repository (Utrecht University) (submittedVersion, other-oa)
- University of Birmingham Research Portal (University of Birmingham) (submittedVersion)
- Funders
- Netherlands Organization for Scientific Research (91617050)
- Cochrane Methods Innovation Funds Round 2 (MTH001F)
- Topics
- Social Sciences › Decision Sciences › Statistics, Probability and Uncertainty › Meta-analysis and systematic reviews
- Physical Sciences › Mathematics › Statistics and Probability › Statistical Methods in Epidemiology
- Physical Sciences › Mathematics › Statistics and Probability › Statistical Methods in Clinical Trials
- Keywords
- prediction model validation, binary outcomes, time-to-event outcomes, concordance index, calibration slope, observed-to-expected ratio, study heterogeneity, Bayesian meta-analysis, prior distributions, EuroSCORE II, Framingham risk score
- MeSH terms
- Systematic Reviews as Topic, Bayes Theorem, Calibration, Humans, Prognosis, Research Design, Meta-Analysis as Topic, Models, Statistical, Risk Assessment
About these checks
Registry, retraction, Cites and statistics results are computed, not judged, with one exception: a printed reference that no index lists is read once by a model before it counts as a citation error. Claims are extracted by a model and kept only when their quote appears verbatim in the text; each cited source is then checked, with a model’s help, for whether it says what the claim relies on. Those verdicts can be wrong — read the claim’s quote and the cited source before relying on one.
A language model drew the claims from the paper on 2026-10-09, under version 3 of the claim definition (model deepseek-v4.1-flash, prompt extract-v3).
A second model labelled each claim on 2026-10-09 (model jev-1.13-20260917, definition revision gold-guideline-v0.2).
Cited sources are checked with a language model’s help (gpt-6-sol).
Statistics and arithmetic are recomputed, not judged.
Confidence bands are shown only for fields calibrated on our annotated test set. None is calibrated yet, so no band is shown.
What counts as a claim ›How we measure confidence ›How we check this ›
Are you an author, or do you see a problem with this page? Request a review
