

The DOI matches its Crossref record; 12 of the 12 references it cites were found in a registry or an index.
Aging alters the cell cycle control and mitogenic signaling responses of human hematopoietic stem cells
Abstract
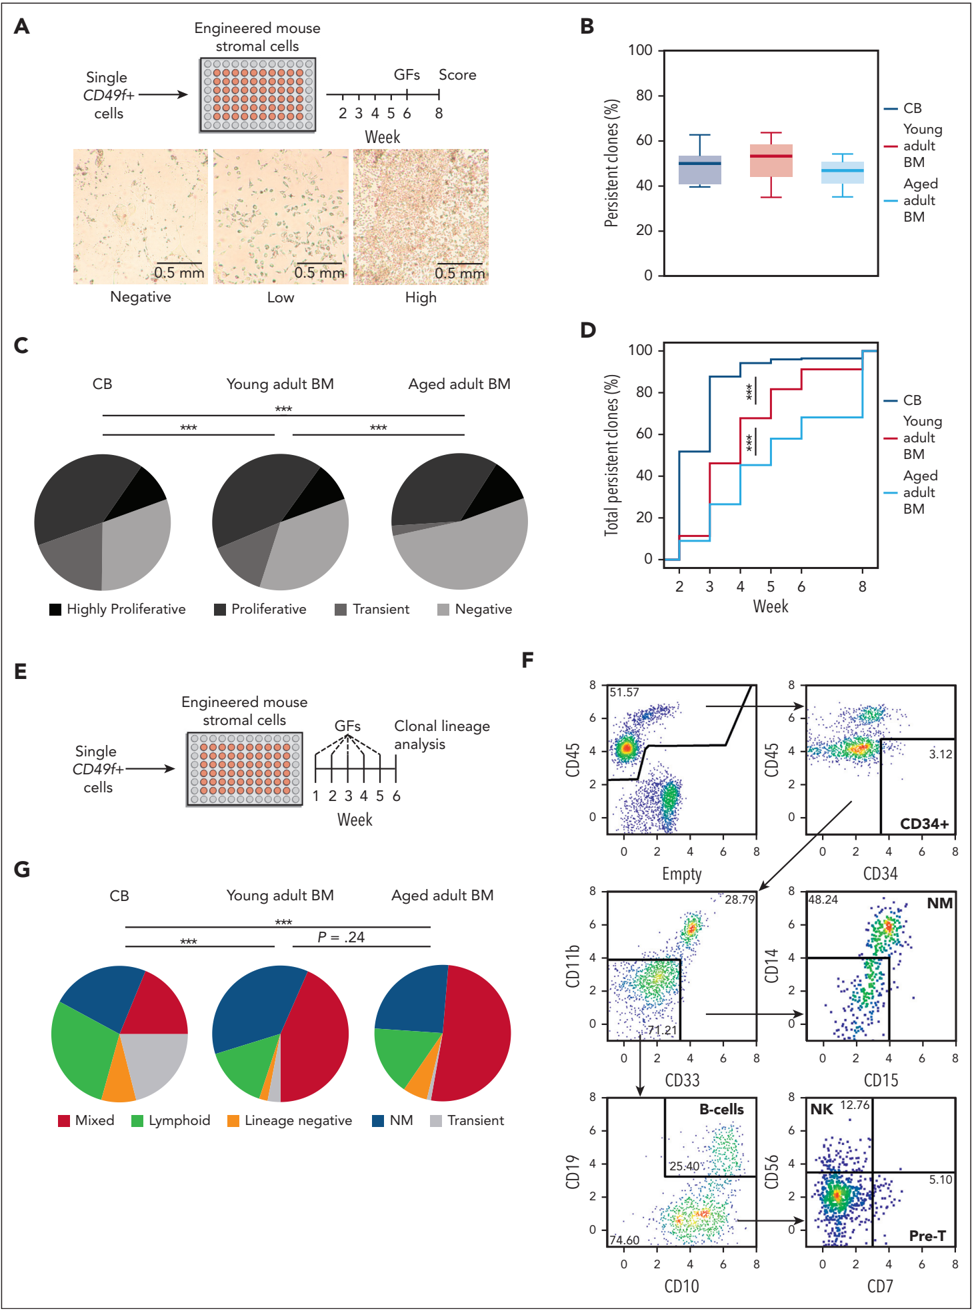
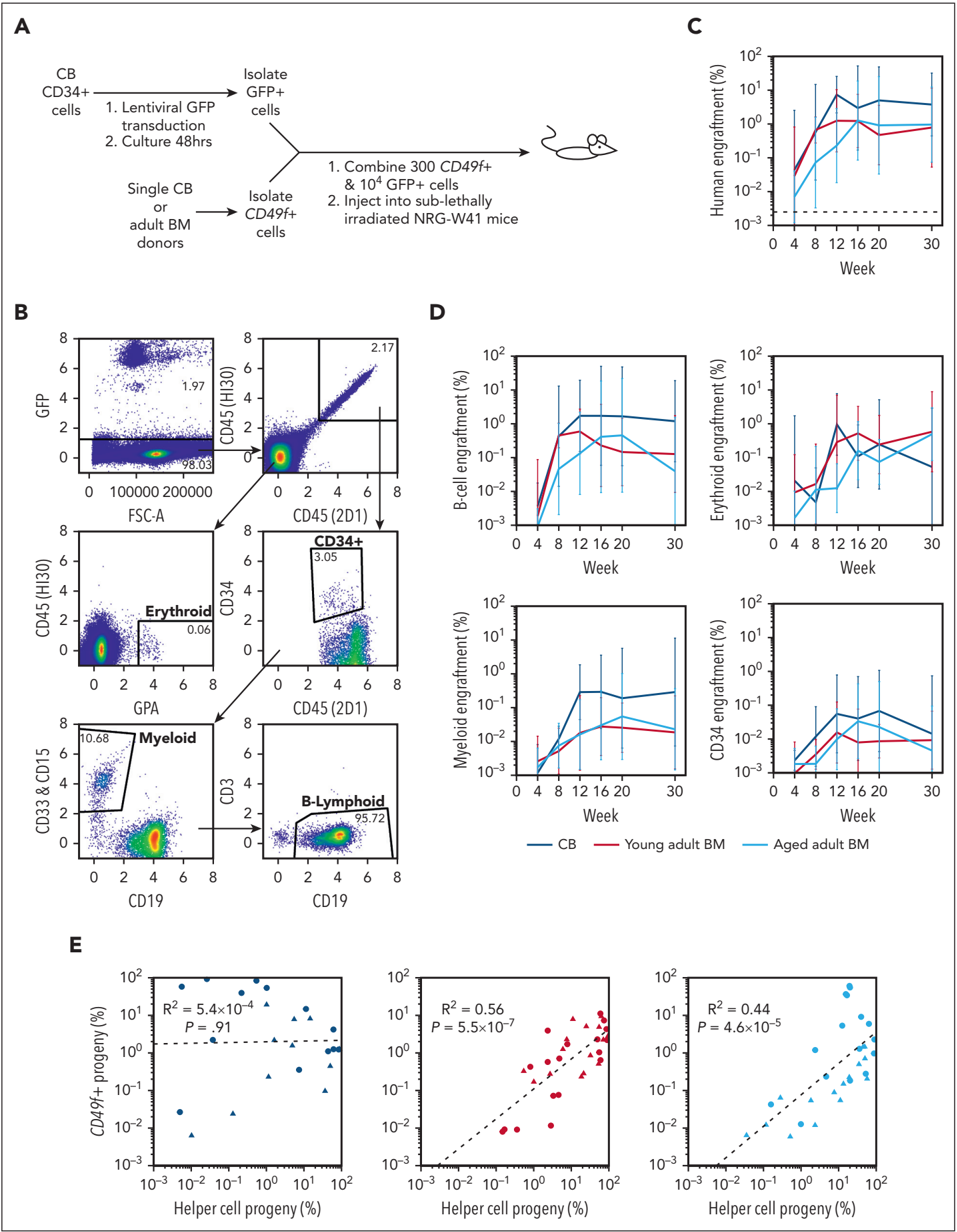
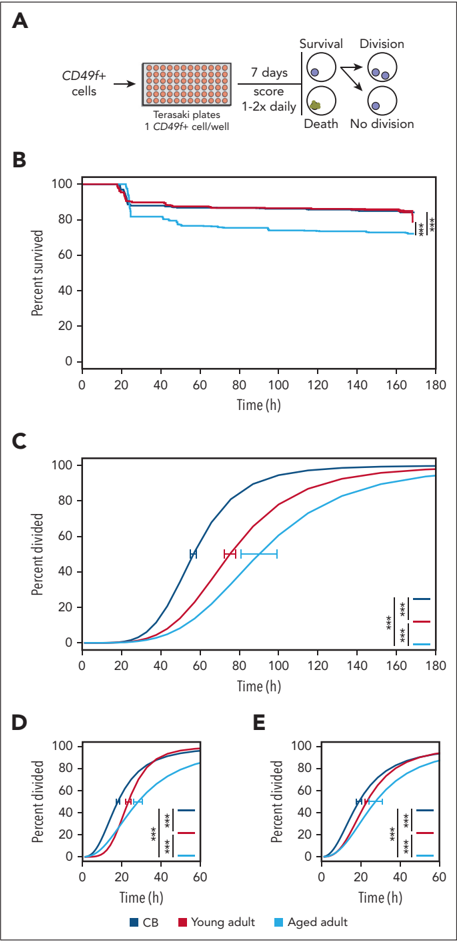
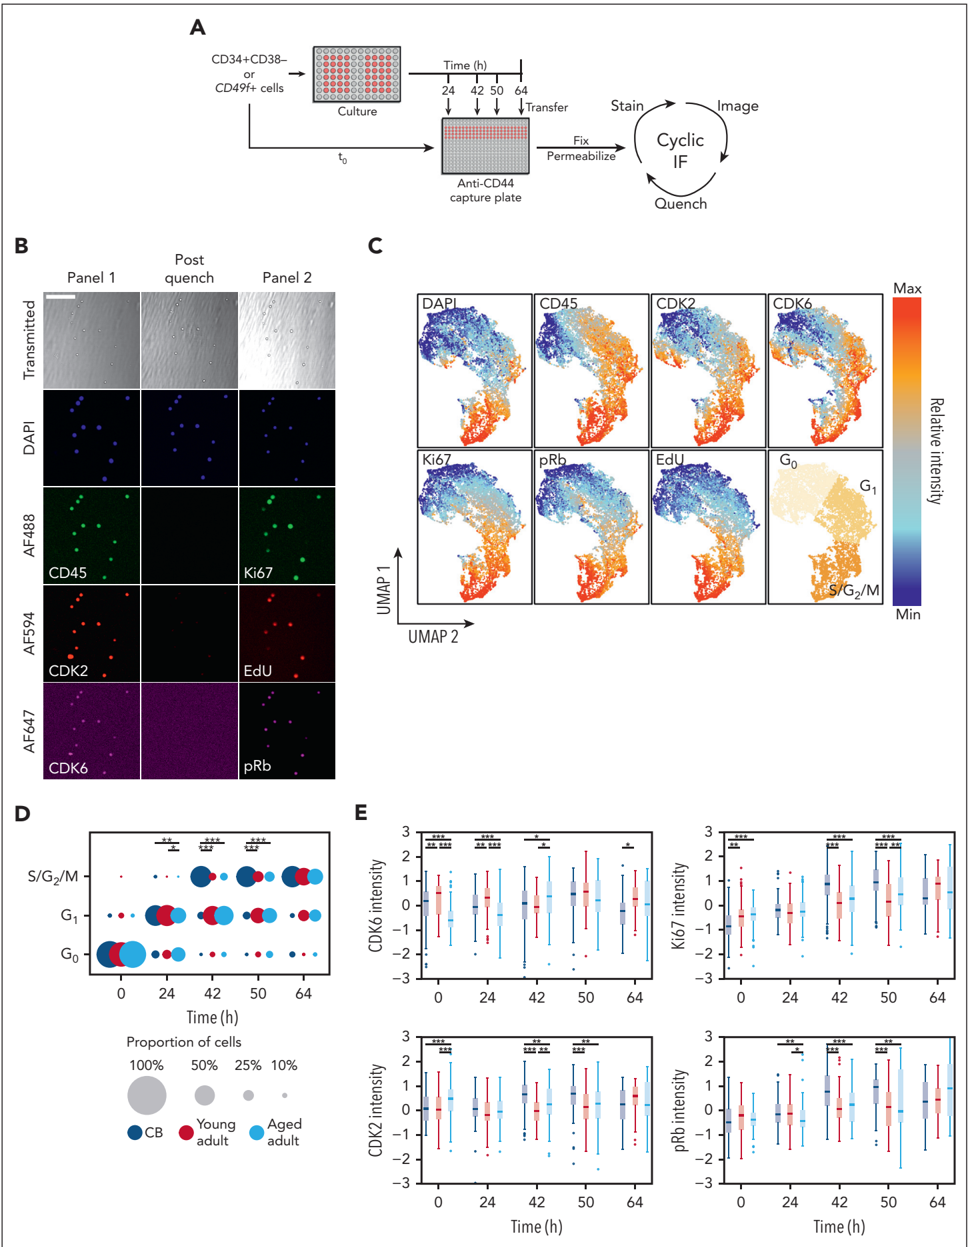
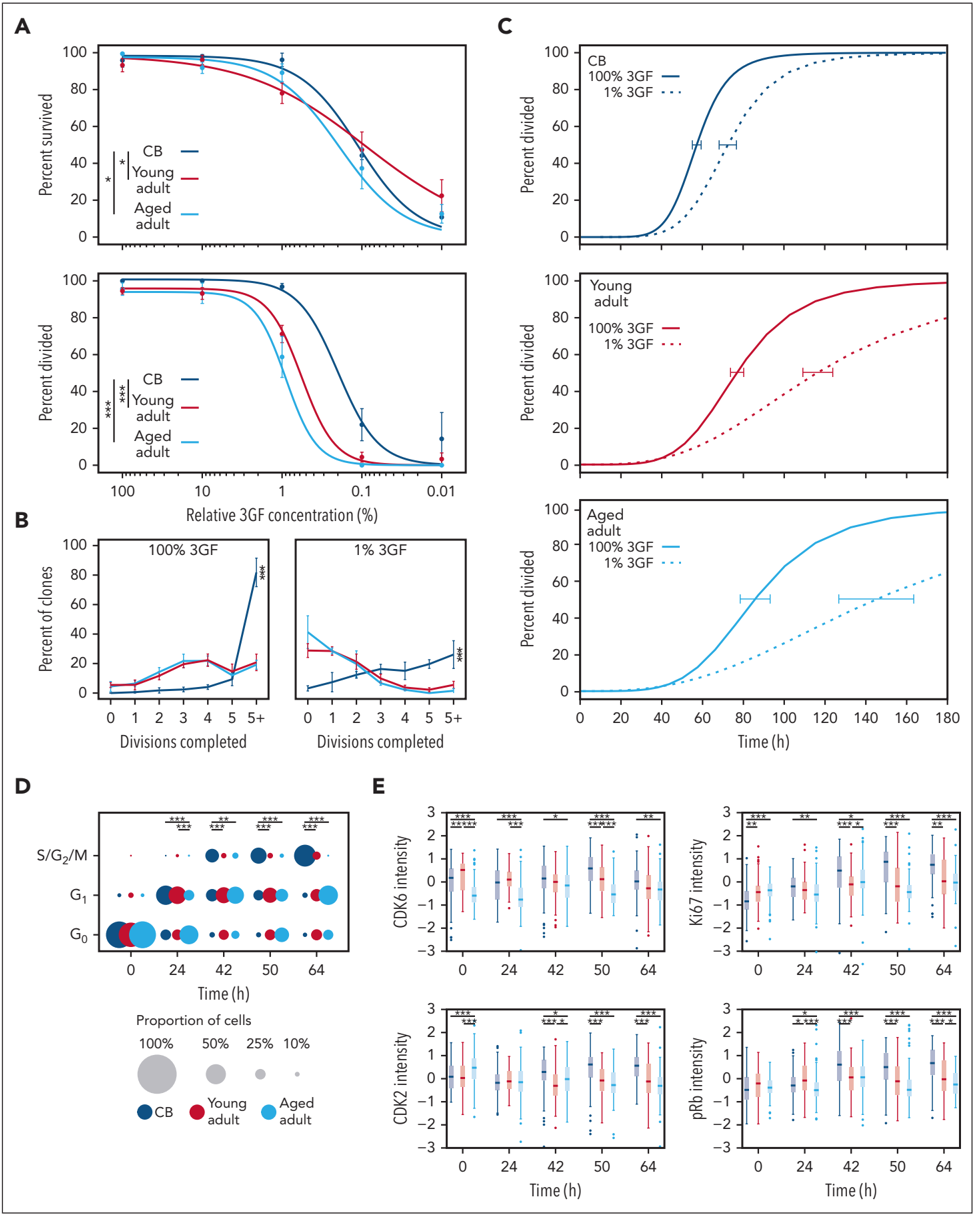
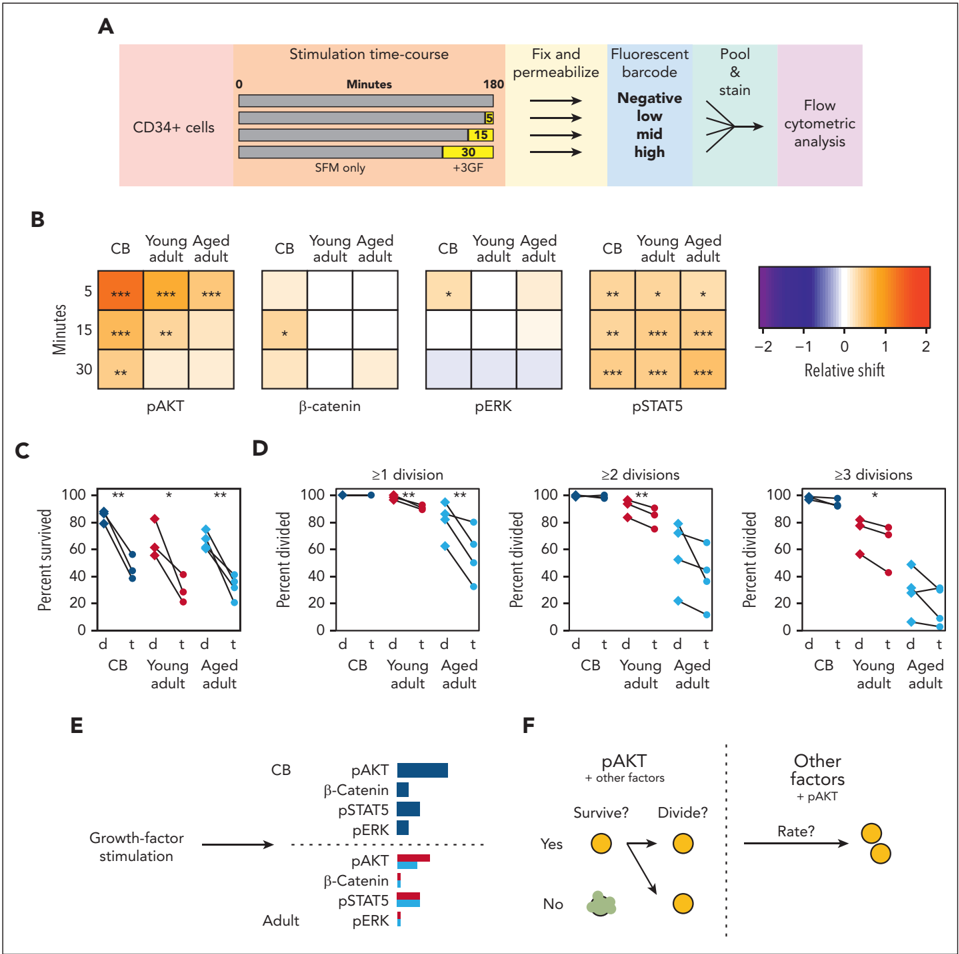
Human hematopoietic stem cells (HSCs), like their counterparts in mice, comprise a functionally and molecularly heterogeneous population of cells throughout life that collectively maintain required outputs of mature blood cells under homeostatic conditions. In both species, an early developmental change in the HSC population involves a postnatal switch from a state in which most of these cells exist in a rapidly cycling state and maintain a high self-renewal potential to a state in which the majority of cells are in a quiescent state with an overall reduced self-renewal potential. However, despite the well-established growth factor dependence of HSC proliferation, whether and how this mechanism of HSC regulation might be affected by aging has remained poorly understood. To address this knowledge gap, we isolated highly HSC-enriched CD34+CD38−CD45RA−CD90+CD49f+ (CD49f+) cells from cord blood, adult bone marrow, and mobilized peripheral blood samples obtained from normal humans spanning 7 decades of age and then measured their functional and molecular responses to growth factor stimulation in vitro and their regenerative activity in vivo in mice that had undergone transplantation. Initial experiments revealed that advancing donor age was accompanied by a significant and progressively delayed proliferative response but not the altered mature cell outputs seen in normal older individuals. Importantly, subsequent dose-response analyses revealed an age-associated reduction in the growth factor–stimulated proliferation of CD49f+ cells mediated by reduced activation of AKT and altered cell cycle entry and progression. These findings identify a new intrinsic, pervasive, and progressive aging-related alteration in the biological and signaling mechanisms required to drive the proliferation of very primitive, normal human hematopoietic cells.
Overview
The claims and statistics of this paper haven’t been checked yet.
Run the check — free, no account needed. It reads the open-access text and checks the sources it cites.
Integrity signals
Registry
Cites
Statistics
Figures
Verification
Claims the paper makes
The claims and statistics of this paper haven’t been checked yet.
Run the check — free, no account needed. It reads the open-access text and checks the sources it cites.
Claims other papers make about this one
Each is checked against this paper’s own text: does it say what the citing paper says it does?
In the citing paper
“Prior data indicate that aging is associated with chronic inflammation, increased NF-κB signaling, quiescence, and functional decline in HSCs.86,87,88”
From Selective advantage of mutant stem cells in human clonal hematopoiesis is associated with attenuated response to inflammation and aging (2024) · cites this paper as [87]
Self-check
Percentages, sums and reported differences re-computed from the paper’s own numbers.
The self-check needs the paper’s full text.
Citations
Cites
Wilson, A., Laurenti, E., Oser, G., van der Wath, R. C., Blanco-Bose, W., Jaworski, M., Offner, S., Dunant, C. F., Eshkind, L., Bockamp, E., et al. (2008) · Cell · doi:10.1016/j.cell.2008.10.048 · Cited by 1,908
Clonal hematopoiesis in human aging and disease
Jaiswal, S., & Ebert, B. L. (2019) · Science · doi:10.1126/science.aan4673 · Cited by 1,156
Human bone marrow hematopoietic stem cells are increased in frequency and myeloid-biased with age
Pang, W. W., Price, E. A., Sahoo, D., Beerman, I., Maloney, W. J., Rossi, D. J., Schrier, S. L., & Weissman, I. L. (2011) · Proceedings of the National Academy of Sciences · doi:10.1073/pnas.1116110108 · Cited by 991
Human haematopoietic stem cell lineage commitment is a continuous process
Velten, L., Haas, S. F., Raffel, S., Blaszkiewicz, S., Islam, S., Hennig, B. P., Hirche, C., Lutz, C., Buss, E. C., Nowak, D., et al. (2017) · Nature Cell Biology · doi:10.1038/ncb3493 · Cited by 925
Distinct routes of lineage development reshape the human blood hierarchy across ontogeny
Notta, F., Zandi, S., Takayama, N., Dobson, S., Gan, O. I., Wilson, G., Kaufmann, K. B., McLeod, J., Laurenti, E., Dunant, C. F., et al. (2016) · Science · doi:10.1126/science.aab2116 · Cited by 780
Replication stress is a potent driver of functional decline in ageing haematopoietic stem cells
Flach, J., Bakker, S. T., Mohrin, M., Conroy, P. C., Pietras, E. M., Reynaud, D., Alvarez, S., Diolaiti, M. E., Ugarte, F., Forsberg, E. C., et al. (2014) · Nature · doi:10.1038/nature13619 · Cited by 650
Clonal analysis reveals multiple functional defects of aged murine hematopoietic stem cells
Dykstra, B., Olthof, S., Schreuder, J., Ritsema, M., & de Haan, G. (2011) · Journal of Experimental Medicine · doi:10.1084/jem.20111490 · Cited by 494
Hematopoietic Stem Cells Are the Major Source of Multilineage Hematopoiesis in Adult Animals
Sawai, C. M., Babovic, S., Upadhaya, S., Knapp, D. J. H. F., Lavin, Y., Lau, C. M., Goloborodko, A., Feng, J., Fujisaki, J., Ding, L., et al. (2016) · Immunity · doi:10.1016/j.immuni.2016.08.007 · Cited by 381
Bowie, M. B., McKnight, K. D., Kent, D. G., McCaffrey, L., Hoodless, P. A., & Eaves, C. J. (2006) · Journal of Clinical Investigation · doi:10.1172/jci28310 · Cited by 380
Self-citationCho, R. H., Sieburg, H. B., & Muller-Sieburg, C. E. (2008) · Blood · doi:10.1182/blood-2007-11-123547 · Cited by 377
Research works printed but not linked: 48
- Laurenti, 2018, From haematopoietic stem cells to complex differentiation landscapes, Nature, 553, 418, 10.1038/nature25022 · DOI
- Blanco, 2018, Age-associated distribution of normal B-cell and plasma cell subsets in peripheral blood, J Allergy Clin Immunol, 141, 2208, 10.1016/j.jaci.2018.02.017 · DOI
- Comans-Bitter, 1997, Immunophenotyping of blood lymphocytes in childhoodReference values for lymphocyte subpopulations, J Pediatr, 130, 388, 10.1016/S0022-3476(97)70200-2 · DOI
- Geiger, 2013, The ageing haematopoietic stem cell compartment, Nat Rev Immunol, 13, 376, 10.1038/nri3433 · DOI · Paper page
- Guralnik, 2004, Prevalence of anemia in persons 65 years and older in the United States: evidence for a high rate of unexplained anemia, Blood, 104, 2263, 10.1182/blood-2004-05-1812 · DOI · Paper page
- Morbach, 2010, Reference values for B cell subpopulations from infancy to adulthood: age-dependent reference values for B cell populations, Clin Exp Immunol, 162, 271, 10.1111/j.1365-2249.2010.04206.x · DOI
- Chin, 2022, Aged healthy mice acquire clonal hematopoiesis mutations, Blood, 139, 629, 10.1182/blood.2021014235 · DOI
- Mitchell, 2022, Clonal dynamics of haematopoiesis across the human lifespan, Nature, 606, 343, 10.1038/s41586-022-04786-y · DOI · Paper page
- Benz, 2012, Hematopoietic stem cell subtypes expand differentially during development and display distinct lymphopoietic programs, Cell Stem Cell, 10, 273, 10.1016/j.stem.2012.02.007 · DOI
- Dykstra, 2007, Long-term propagation of distinct hematopoietic differentiation programs in vivo, Cell Stem Cell, 1, 218, 10.1016/j.stem.2007.05.015 · DOI · Paper page
- Sanjuan-Pla, 2013, Platelet-biased stem cells reside at the apex of the haematopoietic stem-cell hierarchy, Nature, 502, 232, 10.1038/nature12495 · DOI
- Yamamoto, 2013, Clonal analysis unveils self-renewing lineage-restricted progenitors generated directly from hematopoietic stem cells, Cell, 154, 1112, 10.1016/j.cell.2013.08.007 · DOI
- Amoah, 2022, Aging of human hematopoietic stem cells is linked to changes in Cdc42 activity, Haematologica, 107, 393, 10.3324/haematol.2020.269670 · DOI
- Kuranda, 2011, Age-related changes in human hematopoietic stem/progenitor cells: aging of human HSC, Aging Cell, 10, 542, 10.1111/j.1474-9726.2011.00675.x · DOI
- Nilsson, 2016, Human and murine hematopoietic stem cell aging is associated with functional impairments and intrinsic megakaryocytic/erythroid bias, PLoS One, 11, e0158369, 10.1371/journal.pone.0158369 · DOI
- Belluschi, 2018, Myelo-lymphoid lineage restriction occurs in the human haematopoietic stem cell compartment before lymphoid-primed multipotent progenitors, Nat Commun, 9, 4100, 10.1038/s41467-018-06442-4 · DOI
- Huntsman, 2015, Human hematopoietic stem cells from mobilized peripheral blood can be purified based on CD49f integrin expression, Blood, 126, 1631, 10.1182/blood-2015-07-660670 · DOI
- Knapp, 2018, Single-cell analysis identifies a CD33 + subset of human cord blood cells with high regenerative potential, Nat Cell Biol, 20, 710, 10.1038/s41556-018-0104-5 · DOI
- Knapp, 2017, Dissociation of survival, proliferation, and state control in human hematopoietic stem cells, Stem Cell Reports, 8, 152, 10.1016/j.stemcr.2016.12.003 · DOI
- Notta, 2011, Isolation of single human hematopoietic stem cells capable of long-term multilineage engraftment, Science, 333, 218, 10.1126/science.1201219 · DOI · Paper page
- Wang, 2019, Ultra-high-frequency reprogramming of individual long-term hematopoietic stem cells yields low somatic variant induced pluripotent stem cells, Cell Rep, 26, 2580, 10.1016/j.celrep.2019.02.021 · DOI
- Bowie, 2007, Identification of a new intrinsically timed developmental checkpoint that reprograms key hematopoietic stem cell properties, Proc Natl Acad Sci U S A, 104, 5878, 10.1073/pnas.0700460104 · DOI
- Foudi, 2009, Analysis of histone 2B-GFP retention reveals slowly cycling hematopoietic stem cells, Nat Biotechnol, 27, 84, 10.1038/nbt.1517 · DOI · Paper page
- Morcos, 2020, Continuous mitotic activity of primitive hematopoietic stem cells in adult mice, J Exp Med, 217, e20191284, 10.1084/jem.20191284 · DOI
- Baerlocher, 2007, Longitudinal data on telomere length in leukocytes from newborn baboons support a marked drop in stem cell turnover around 1 year of age, Aging Cell, 6, 121, 10.1111/j.1474-9726.2006.00254.x · DOI
- Sidorov, 2009, Leukocyte telomere dynamics and human hematopoietic stem cell kinetics during somatic growth, Exp Hematol, 37, 514, 10.1016/j.exphem.2008.11.009 · DOI · Paper page
- Dykstra, 2006, High-resolution video monitoring of hematopoietic stem cells cultured in single-cell arrays identifies new features of self-renewal, Proc Natl Acad Sci U S A, 103, 8185, 10.1073/pnas.0602548103 · DOI
- Hui, 2018, High-resolution single-cell DNA methylation measurements reveal epigenetically distinct hematopoietic stem cell subpopulations, Stem Cell Reports, 11, 578, 10.1016/j.stemcr.2018.07.003 · DOI · Paper page
- Knapp, 2019, A topological view of human CD34+ cell state trajectories from integrated single-cell output and proteomic data, Blood, 133, 927, 10.1182/blood-2018-10-878025 · DOI
- Knapp, 2017, Distinct signaling programs control human hematopoietic stem cell survival and proliferation, Blood, 129, 307, 10.1182/blood-2016-09-740654 · DOI
- Miller, 2017, Analysis of parameters that affect human hematopoietic cell outputs in mutant c-kit-immunodeficient mice, Exp Hematol, 48, 41, 10.1016/j.exphem.2016.12.012 · DOI
- Loeffler, 2018, Mouse and human HSPC immobilization in liquid culture by CD43- or CD44-antibody coating, Blood, 131, 1425, 10.1182/blood-2017-07-794131 · DOI
- Lin, 2015, Highly multiplexed imaging of single cells using a high-throughput cyclic immunofluorescence method, Nat Commun, 6, 8390, 10.1038/ncomms9390 · DOI
- Copley, 2013, The Lin28b–let-7–Hmga2 axis determines the higher self-renewal potential of fetal haematopoietic stem cells, Nat Cell Biol, 15, 916, 10.1038/ncb2783 · DOI
- Becht, 2018, Dimensionality reduction for visualizing single-cell data using UMAP, Nat Biotechnol, 37, 38, 10.1038/nbt.4314 · DOI · Paper page
- McInnes, 2018, UMAP: Uniform Manifold Approximation and Projection, JOSS, 3, 861, 10.21105/joss.00861 · DOI · Paper page
- Laurenti, 2015, CDK6 levels regulate quiescence exit in human hematopoietic stem cells, Cell Stem Cell, 16, 302, 10.1016/j.stem.2015.01.017 · DOI · Paper page
- Wilpshaar, 2000, Similar repopulating capacity of mitotically active and resting umbilical cord blood CD34+ cells in NOD/SCID mice, Blood, 96, 2100, 10.1182/blood.V96.6.2100 · DOI
- Hume, 2020, A unified model for the G1/S cell cycle transition, Nucleic Acids Res, 48, 12483, 10.1093/nar/gkaa1002 · DOI
- Sherr, 2000, The Pezcoller lecture: cancer cell cycles revisited, Cancer Res, 60, 3689
- Sherr, 1993, Mammalian G1 cyclins, Cell, 73, 1059, 10.1016/0092-8674(93)90636-5 · DOI
- Grover, 2016, Single-cell RNA sequencing reveals molecular and functional platelet bias of aged haematopoietic stem cells, Nat Commun, 7, 11075, 10.1038/ncomms11075 · DOI
- Carrelha, 2018, Hierarchically related lineage-restricted fates of multipotent haematopoietic stem cells, Nature, 554, 106, 10.1038/nature25455 · DOI
- Young, 2021, Decline in IGF1 in the bone marrow microenvironment initiates hematopoietic stem cell aging, Cell Stem Cell, 28, 1473, 10.1016/j.stem.2021.03.017 · DOI · Paper page
- García-Gutiérrez, 2019, MYC oncogene contributions to release of cell cycle brakes, Genes (Basel), 10, 244, 10.3390/genes10030244 · DOI
- Wang, 2021, Cytokine combinations for human blood stem cell expansion induce cell-type– and cytokine-specific signaling dynamics, Blood, 138, 847, 10.1182/blood.2020008386 · DOI
- García-Prat, 2021, TFEB-mediated endolysosomal activity controls human hematopoietic stem cell fate, Cell Stem Cell, 28, 1838, 10.1016/j.stem.2021.07.003 · DOI · Paper page
- Loeffler, 2019, Asymmetric lysosome inheritance predicts activation of haematopoietic stem cells, Nature, 573, 426, 10.1038/s41586-019-1531-6 · DOI
Cited by
Jakobsen, N. A., Turkalj, S., Zeng, A. G. X., Stoilova, B., Metzner, M., Rahmig, S., Nagree, M. S., Shah, S., Moore, R., Usukhbayar, B., et al. (2024) · Cell Stem Cell · doi:10.1016/j.stem.2024.05.010 · Cited by 130
Metadata
- Authors
- Hammond, C. A., Wu, S. W., Wang, F., MacAldaz, M. E., & Eaves, C. J.
- Affiliations
- 1Terry Fox Laboratory, British Columbia Cancer Agency, Vancouver, Canada
- Venue
- Blood
- Publisher
- American Society of Hematology
- Published
- 2023-04-20
- Volume
- 141
- Issue
- 16
- Pages
- 1990-2002
- ISSN
- 0006-4971
- 1528-0020
- Cited by
- 40
- References
- 12
- Language
- en
About these checks
Registry, retraction, Cites and statistics results are computed, not judged, with one exception: a printed reference that no index lists is read once by a model before it counts as a citation error. Claims are extracted by a model and kept only when their quote appears verbatim in the text; each cited source is then checked, with a model’s help, for whether it says what the claim relies on. Those verdicts can be wrong — read the claim’s quote and the cited source before relying on one.
Statistics and arithmetic are recomputed, not judged.
Confidence bands are shown only for fields calibrated on our annotated test set. None is calibrated yet, so no band is shown.
What counts as a claim ›How we measure confidence ›How we check this ›
Are you an author, or do you see a problem with this page? Request a review
How to cite
Cite CoChat for the checks on this page, and the paper for its own findings.
- This page
- CoChat. (2026). Citation check: Aging alters the cell cycle control and mitogenic signaling responses of human hematopoietic stem cells. https://app.cochat.ai/papers/10.1182/blood.2022017174
- The paper
- Hammond, C. A., Wu, S. W., Wang, F., MacAldaz, M. E., & Eaves, C. J. (2023). Aging alters the cell cycle control and mitogenic signaling responses of human hematopoietic stem cells. Blood. https://doi.org/10.1182/blood.2022017174
