

The DOI matches its Crossref record; 72 of the 72 references it cites were found in a registry or an index.
Impaired immune responses in the lungs of aged mice following influenza infection
Open accessAbstract
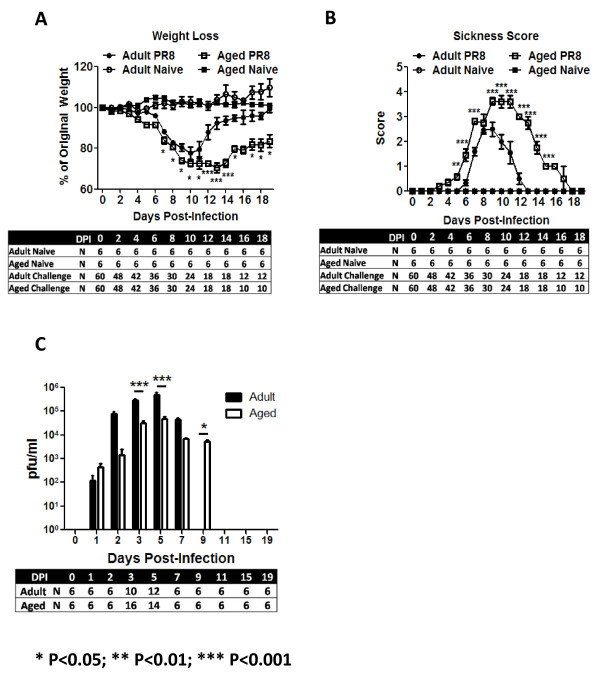
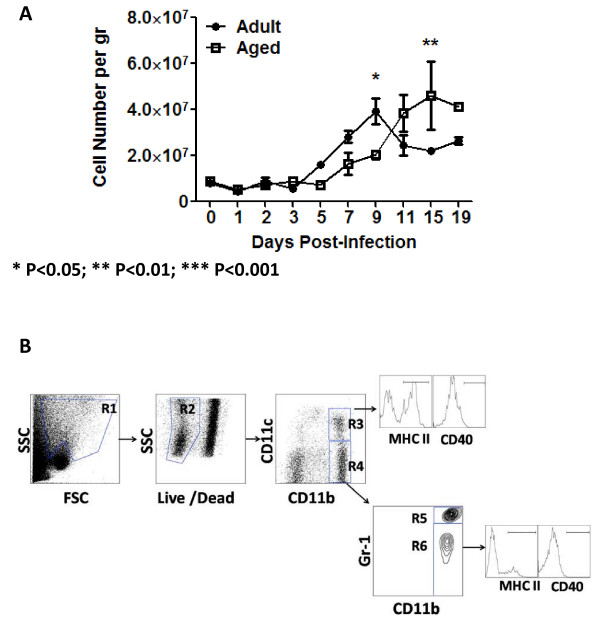
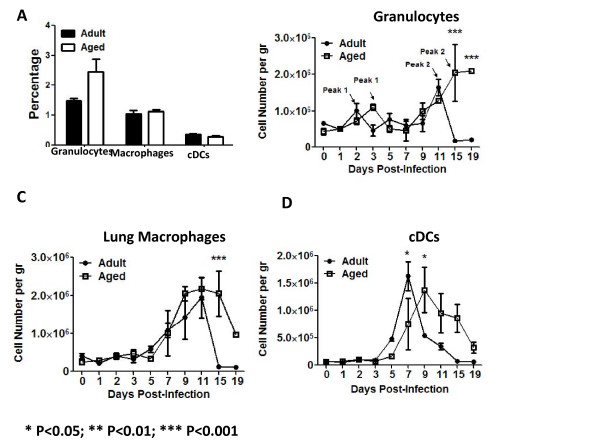
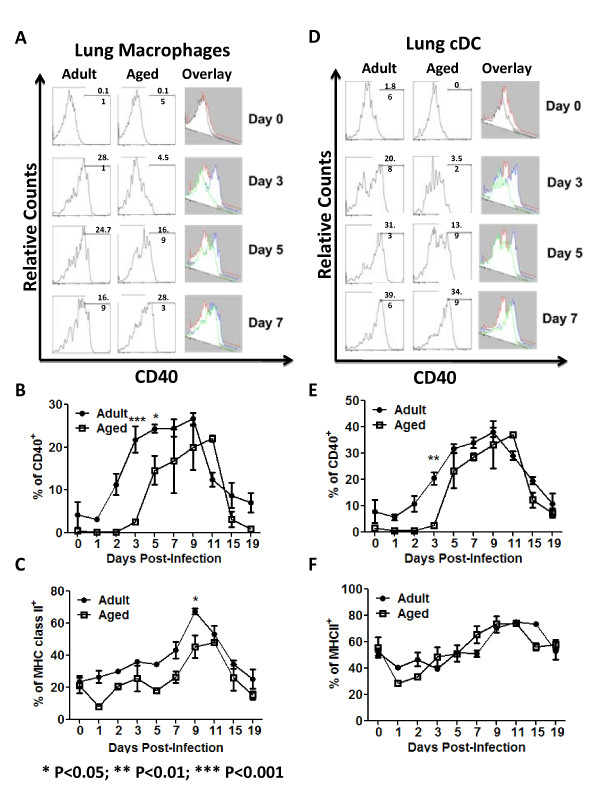
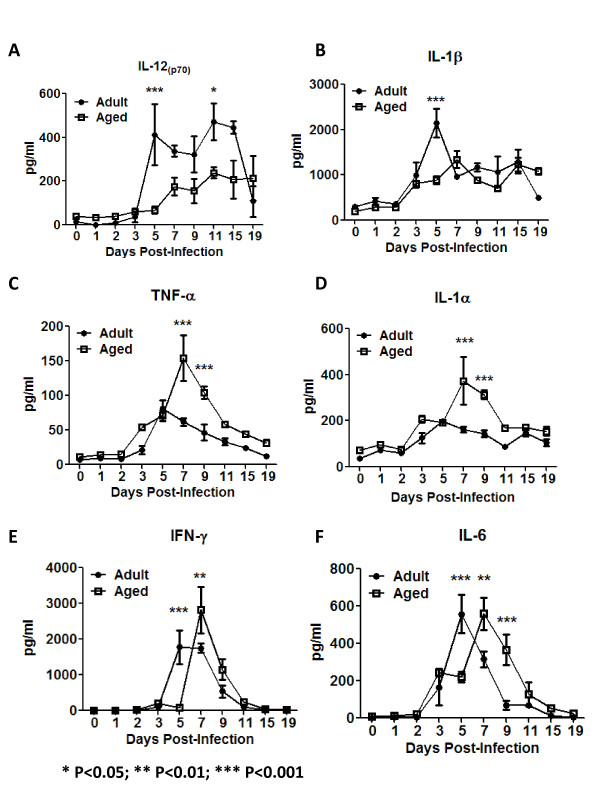
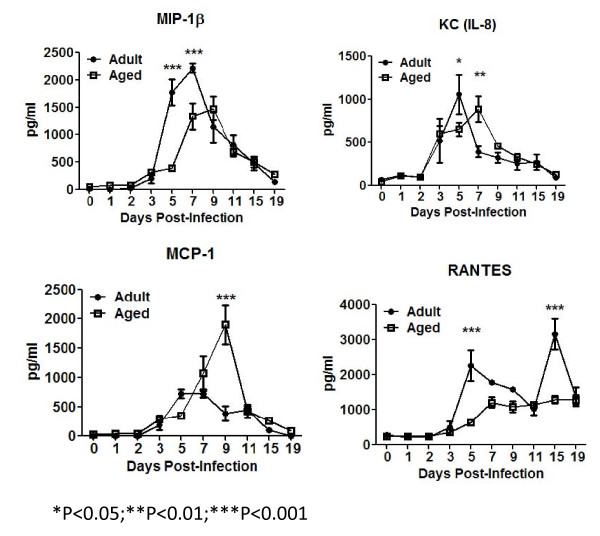
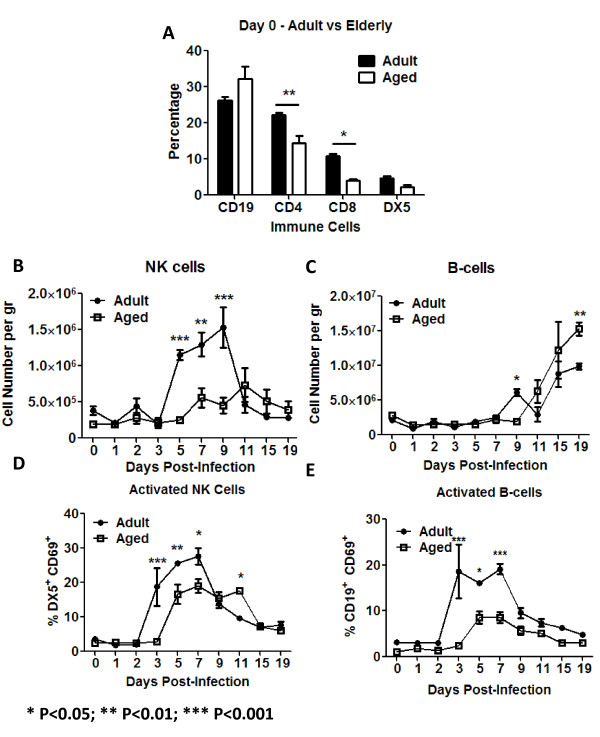
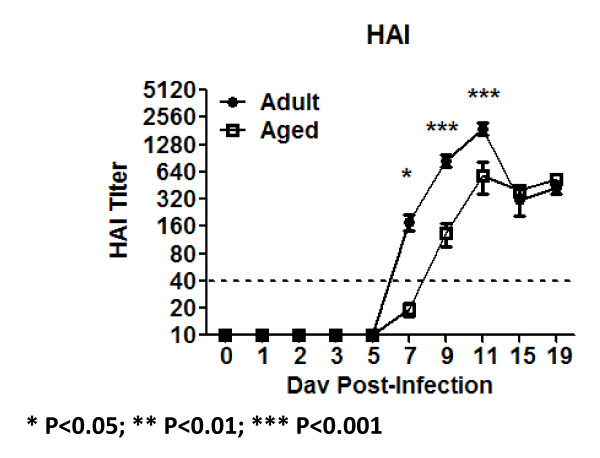
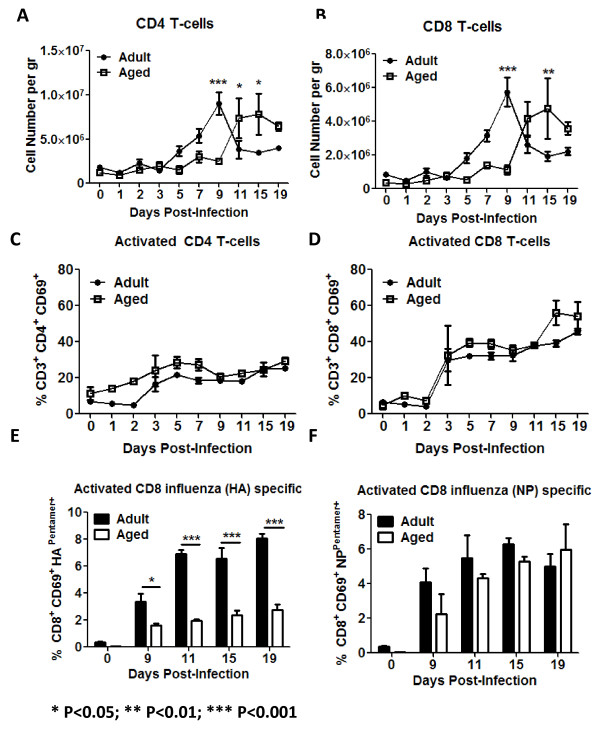
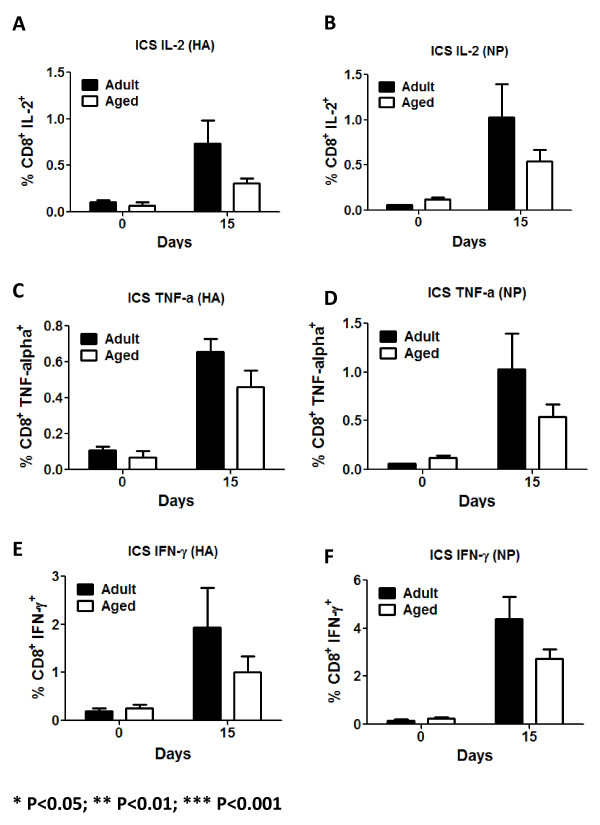
BACKGROUND: Each year, influenza virus infection causes severe morbidity and mortality, particularly in the most susceptible groups including children, the elderly (>65 years-old) and people with chronic respiratory diseases. Among the several factors that contribute to the increased susceptibility in elderly populations are the higher prevalence of chronic diseases (e.g. diabetes) and the senescence of the immune system. METHODS: In this study, aged and adult mice were infected with sublethal doses of influenza virus (A/Puerto Rico/8/1934). Differences in weight loss, morbidity, virus titer and the kinetics of lung infiltration with cells of the innate and adaptive immune responses were analyzed. Additionally, the main cytokines and chemokines produced by these cells were also assayed. RESULTS: Compared to adult mice, aged mice had higher morbidity, lost weight more rapidly, and recovered more slowly from infection. There was a delay in the accumulation of granulocytic cells and conventional dendritic cells (cDCs), but not macrophages in the lungs of aged mice compared to adult animals. The delayed infiltration kinetics of APCs in aged animals correlated with alteration in their activation (CD40 expression), which also correlated with a delayed detection of cytokines and chemokines in lung homogenates. This was associated with retarded lung infiltration by natural killer (NK), CD4+ and CD8+ T-cells. Furthermore, the percentage of activated (CD69+) influenza-specific and IL-2 producer CD8+ T-cells was higher in adult mice compared to aged ones. Additionally, activation (CD69+) of adult B-cells was earlier and correlated with a quicker development of neutralizing antibodies in adult animals. CONCLUSION: Overall, alterations in APC priming and activation lead to delayed production of cytokines and chemokines in the lungs that ultimately affected the infiltration of immune cells following influenza infection. This resulted in delayed activation of the adaptive immune response and subsequent delay in clearance of virus and prolonged illness in aged animals. Since the elderly are the fastest growing segment of the population in developed countries, a better understanding of the changes that occur in the immune system during the aging process is a priority for the development of new vaccines and adjuvants to improve the immune responses in this population.
Overview
The claims and statistics of this paper haven’t been checked yet.
Run the check — free, no account needed. It reads the open-access text and checks the sources it cites.
Integrity signals
Registry
Cites
Statistics
Figures
Verification
Claims the paper makes
The claims and statistics of this paper haven’t been checked yet.
Run the check — free, no account needed. It reads the open-access text and checks the sources it cites.
Claims other papers make about this one
Each is checked against this paper’s own text: does it say what the citing paper says it does?
In the citing paper
“There is an age-associated reduction in the upregulation of costimulatory molecules critical for T cell priming and dysregulated cytokine production by DCs (115, 117).”
From Aging and Lung Disease (2020) · cites this paper as [115]
In the citing paper
“In experimental models, DC migration into the aged lung during influenza infection is reduced (115).”
From Aging and Lung Disease (2020) · cites this paper as [115]
Self-check
Percentages, sums and reported differences re-computed from the paper’s own numbers.
The self-check needs the paper’s full text.
Citations
Cites
Martinon, F., Burns, K., & Tschopp, J. (2002) · Molecular Cell · doi:10.1016/s1097-2765(02)00599-3 · Cited by 6,066
Kiessling, R. W., Klein, E., & Wigzell, H. (1975) · European Journal of Immunology · doi:10.1002/eji.1830050208 · Cited by 1,827
CD40 AND CD154 IN CELL-MEDIATED IMMUNITY
Grewal, I. S., & Flavell, R. A. (1998) · Annual Review of Immunology · doi:10.1146/annurev.immunol.16.1.111 · Cited by 1,538
Selective attraction of monocytes and T lymphocytes of the memory phenotype by cytokine RANTES
Schall, T. J., Bacon, K. B., Toy, K. J., & Goeddel, D. V. (1990) · Nature · doi:10.1038/347669a0 · Cited by 1,378
Kiessling, R. W., Klein, E., Pross, H. F., & Wigzell, H. (1975) · European Journal of Immunology · doi:10.1002/eji.1830050209 · Cited by 1,143
The Global Circulation of Seasonal Influenza A (H3N2) Viruses
Russell, C. A., Jones, T. C., Barr, I., Cox, N. J., Garten, R. J., Gregory, V., Gust, I. D., Hampson, A. W., Hay, A. J., Hurt, A. C., et al. (2008) · Science · doi:10.1126/science.1154137 · Cited by 729
Activation of NK cell cytotoxicity
Smyth, M. J., Cretney, E., Kelly, J. M., Westwood, J. A., Street, S. E. A., Yagita∥, H., Takeda, K., van Dommelen, S. L. H., Degli‐Esposti, M. A., & Hayakawa, Y. (2004) · Molecular Immunology · doi:10.1016/j.molimm.2004.07.034 · Cited by 714
Taylor, P. R., Brown, G. D., Reid, D. M., Willment, J. A., Martínez‐Pomares, L., Gordon, S., & Wong, S. Y. C. (2002) · The Journal of Immunology · doi:10.4049/jimmunol.169.7.3876 · Cited by 655
COPD as a Disease of Accelerated Lung Aging
Ito, K., & Barnes, P. J. (2009) · CHEST Journal · doi:10.1378/chest.08-1419 · Cited by 634
Cutting edge: impaired toll-like receptor expression and function in aging
Renshaw, M., Rockwell, J., Engleman, C., Gewirtz, A., Katz, J., & Sambhara, S. (2002) · The Journal of Immunology · doi:10.4049/jimmunol.169.9.4697 · Cited by 626
Research works printed but not linked: 1
- Hobbs F, Damon BL, Taeuber CM: Sixty-five plus in the United States. In Census UBot. US Government Printing Office; 1996:23–190.
Cited by
Sorted by citations
Age-dependent dysregulation of innate immunity
Shaw, A. C., Goldstein, D. R., & Montgomery, R. R. (2013) · Nature Reviews Immunology · doi:10.1038/nri3547 · Cited by 1,061
Aging of the innate immune system
Shaw, A. C., Joshi, S., Greenwood, H., Panda, A., & Lord, J. M. (2010) · Current Opinion in Immunology · doi:10.1016/j.coi.2010.05.003 · Cited by 647
Cho, S. J., & Stout-Delgado, H. W. (2020) · Annual Review of Physiology · doi:10.1146/annurev-physiol-021119-034610 · Cited by 458
Sex, the aging immune system, and chronic disease
Bupp, M. G. (2015) · Cellular Immunology · doi:10.1016/j.cellimm.2015.02.002 · Cited by 333
Zhao, J., Zhao, J., Legge, K., & Perlman, S. (2011) · Journal of Clinical Investigation · doi:10.1172/jci59777 · Cited by 265
Aging Impairs Alveolar Macrophage Phagocytosis and Increases Influenza-Induced Mortality in Mice
Wong, C. K., Smith, C. A., Sakamoto, K., Kaminski, N., Koff, J. L., & Goldstein, D. R. (2017) · The Journal of Immunology · doi:10.4049/jimmunol.1700397 · Cited by 246
Impact of aging on dendritic cell functions in humans
Agrawal, A., & Gupta, S. (2011) · Ageing Research Reviews · doi:10.1016/j.arr.2010.06.004 · Cited by 246
Giles, B. M., & Ross, T. M. (2011) · Vaccine · doi:10.1016/j.vaccine.2011.01.100 · Cited by 205
Self-citationMurine single-cell RNA-seq reveals cell-identity- and tissue-specific trajectories of aging
Kimmel, J. C., Penland, L., Rubinstein, N. D., Hendrickson, D. G., Kelley, D. R., & Rosenthal, A. Z. (2019) · Genome Research · doi:10.1101/gr.253880.119 · Cited by 184
Comparative Immunology, Microbiology and Infectious Diseases
Soloff, A. C., Weirback, H. K., Ross, T. M., & Barratt‐Boyes, S. M. (2012) · Cited by 176
Self-citationEmerging SARS-CoV-2 variants expand species tropism to murines
Shuai, H., Chan, J. F., Yuen, T. T., Yoon, C., Hu, J., Wen, L., Hu, B., Yang, D., Wang, Y., Hou, Y., et al. (2021) · EBioMedicine · doi:10.1016/j.ebiom.2021.103643 · Cited by 166
Nrf2 expression modifies influenza A entry and replication in nasal epithelial cells
Kesic, M. J., Simmons, S. O., Bauer, R. N., & Jaspers, I. (2011) · Free Radical Biology and Medicine · doi:10.1016/j.freeradbiomed.2011.04.027 · Cited by 171
Influenza A virus infection kinetics: quantitative data and models
Smith, A. M., & Perelson, A. S. (2010) · WIREs Systems Biology and Medicine · doi:10.1002/wsbm.129 · Cited by 164
Dendritic cells of the oral mucosa
Hovav, A.-H. (2013) · Mucosal Immunology · doi:10.1038/mi.2013.42 · Cited by 161
Innate immune responses in the ageing lung.
Boe, D. M., Boule, L. A., & Kovacs, E. J. (2016) · Clinical and Experimental Immunology · doi:10.1111/cei.12881 · Cited by 156
Modeling Influenza Virus Infection: A Roadmap for Influenza Research
Boianelli, A., Nguyễn, V. K., Ebensen, T., Schulze, K., Wilk, E., Sharma, N., Stegemann‐Koniszewski, S., Bruder, D., Toapanta, F. R., Guzmán, C. A., et al. (2015) · Viruses · doi:10.3390/v7102875 · Cited by 158
Self-citationBrandenberger, C., & Mühlfeld, C. (2017) · Cell and Tissue Research · doi:10.1007/s00441-016-2511-x · Cited by 152
Neutrophils in aging and aging‐related pathologies
Avondt, K. V., Strecker, J., Tulotta, C., Minnerup, J., Schulz, C., & Soehnlein, O. (2022) · Immunological Reviews · doi:10.1111/imr.13153 · Cited by 155
Effects of Aging on Influenza Virus Infection Dynamics
Hernandez-Vargas, E. A., Wilk, E., Canini, L., Toapanta, F. R., Binder, S. C., Uvarovskii, A., Ross, T. M., Guzmán, C. A., Perelson, A. S., & Meyer‐Hermann, M. (2014) · Journal of Virology · doi:10.1128/jvi.03644-13 · Cited by 141
Self-citationDysbiosis, malnutrition and enhanced gut-lung axis contribute to age-related respiratory diseases
Saint‐Criq, V., Lugo‐Villarino, G., & Thomas, M. (2020) · Ageing Research Reviews · doi:10.1016/j.arr.2020.101235 · Cited by 152
Intranasal Treatment with Poly(I·C) Protects Aged Mice from Lethal Respiratory Virus Infections
Zhao, J., Wohlford-Lenane, C., Zhao, J., Fleming, E., Lane, T. E., McCray, P. B., & Perlman, S. M. (2012) · Journal of Virology · doi:10.1128/jvi.01410-12 · Cited by 145
Immunosenescence and Challenges of Vaccination against Influenza in the Aging Population.
Reber, A. J., Chirkova, T., Kim, J. H., Cao, W., Biber, R., Shay, D. K., & Sambhara, S. R. (2012) · Europe PMC (PubMed Central) · Cited by 133
Excessive neutrophil levels in the lung underlie the age-associated increase in influenza mortality
Kulkarni, U., Zemans, R. L., Smith, C. A., Wood, S. C., Deng, J. C., & Goldstein, D. R. (2019) · Mucosal Immunology · doi:10.1038/s41385-018-0115-3 · Cited by 127
The Impact of Immunosenescence on Pulmonary Disease
Murray, M., & Chotirmall, S. H. (2015) · Mediators of Inflammation · doi:10.1155/2015/692546 · Cited by 125
Mendonca, P., & Soliman, K. F. A. (2020) · Antioxidants · doi:10.3390/antiox9080659 · Cited by 126
Pommerenke, C., Wilk, E., Srivastava, B., Schulze, A., Novoselova, N., Geffers, R., & Schughart, K. (2012) · PLoS ONE · doi:10.1371/journal.pone.0041169 · Cited by 118
Sun, S., Zhao, G., Liu, C., Wu, X., Guo, Y., Yu, H., Song, H., Du, L., Jiang, S., Guo, R., et al. (2013) · American Journal of Respiratory Cell and Molecular Biology · doi:10.1165/rcmb.2012-0428oc · Cited by 110
Dual Nature of Type I Interferons in SARS-CoV-2-Induced Inflammation
King, C., & Sprent, J. (2021) · Trends in Immunology · doi:10.1016/j.it.2021.02.003 · Cited by 104
Innate immunesenescence: underlying mechanisms and clinical relevance
Hazeldine, J., & Lord, J. M. (2015) · Biogerontology · doi:10.1007/s10522-014-9514-3 · Cited by 104
Stout-Delgado, H. W., Vaughan, S. E., Shirali, A. C., Jaramillo, R. J., & Harrod, K. S. (2012) · The Journal of Immunology · doi:10.4049/jimmunol.1103051 · Cited by 100
Influenza Pathogenesis: The Effect of Host Factors on Severity of Disease
Gounder, A. P., & Boon, A. C. M. (2019) · The Journal of Immunology · doi:10.4049/jimmunol.1801010 · Cited by 101
Host susceptibility to severe influenza A virus infection
Clohisey, S., & Baillie, J. K. (2019) · Critical Care · doi:10.1186/s13054-019-2566-7 · Cited by 96
T-Cell Biology in Aging, With a Focus on Lung Disease
Lee, N., Shin, M. S., & Kang, I. (2012) · The Journals of Gerontology Series A · doi:10.1093/gerona/glr237 · Cited by 89
Bartley, J. M., Zhou, X., Kuchel, G. A., Weinstock, G. M., & Haynes, L. (2017) · Frontiers in Immunology · doi:10.3389/fimmu.2017.01164 · Cited by 87
Linton, P., & Thoman, M. L. (2014) · Immunology Letters · doi:10.1016/j.imlet.2014.06.017 · Cited by 87
The role of dysregulated immune responses in COVID-19 pathogenesis
Tahaghoghi-Hajghorbani, S., Zafari, P., Masoumi, E., Rajabinejad, M., Jafari-Shakib, R., Hasani, B., & Rafiei, A. (2020) · Virus Research · doi:10.1016/j.virusres.2020.198197 · Cited by 88
Cognitive and Behavioral Consequences of Impaired Immunoregulation in Aging
Corona, A. W., Fenn, A. M., & Godbout, J. P. (2011) · Journal of Neuroimmune Pharmacology · doi:10.1007/s11481-011-9313-4 · Cited by 87
Chen, J., Kelley, W. J., & Goldstein, D. R. (2020) · The Journal of Immunology · doi:10.4049/jimmunol.2000380 · Cited by 83
Hohman, L. S., & Osborne, L. C. (2022) · Aging Cell · doi:10.1111/acel.13700 · Cited by 89
Giles, B. M., Bissel, S. J., DeAlmeida, D. R., Wiley, C. A., & Ross, T. M. (2011) · Clinical and Vaccine Immunology · doi:10.1128/cvi.05533-11 · Cited by 81
Self-citationAge and testosterone mediate influenza pathogenesis in male mice
Steeg, L. G. V., Vermillion, M. S., Hall, O. J., Alam, O., McFarland, R., Chen, H., Zirkin, B. R., & Klein, S. L. (2016) · American Journal of Physiology-Lung Cellular and Molecular Physiology · doi:10.1152/ajplung.00352.2016 · Cited by 79
Beli, E., Clinthorne, J. F., Duriancik, D. M., Hwang, I., Kim, S., & Gardner, E. M. (2011) · Mechanisms of Ageing and Development · doi:10.1016/j.mad.2011.08.005 · Cited by 76
Impact of aging on viral infections
Leng, J., & Goldstein, D. R. (2010) · Microbes and Infection · doi:10.1016/j.micinf.2010.08.009 · Cited by 81
Influenza Virus Infection Model With Density Dependence Supports Biphasic Viral Decay
Smith, A. P., Moquin, D. J., Bernhauerová, V., & Smith, A. M. (2018) · Frontiers in Microbiology · doi:10.3389/fmicb.2018.01554 · Cited by 72
Morales‐Nebreda, L., Helmin, K. A., Acosta, M. A. T., Markov, N. S., Hu, J. Y.-S., Joudi, A. M., Aillon, R. P., Abdala‐Valencia, H., Politanska, Y., & Singer, B. D. (2021) · JCI Insight · doi:10.1172/jci.insight.141690 · Cited by 73
Host‐pathogen kinetics during influenza infection and coinfection: insights from predictive modeling
Smith, A. M. (2018) · Immunological Reviews · doi:10.1111/imr.12692 · Cited by 71
Early Priming Minimizes the Age-Related Immune Compromise of CD8+ T Cell Diversity and Function
Valkenburg, S., Venturi, V., Dang, T. H. Y., Bird, N. L., Doherty, P. C., Turner, S. J., Davenport, M. P., & Kedzierska, K. (2012) · PLoS Pathogens · doi:10.1371/journal.ppat.1002544 · Cited by 70
Myers, M. A., Smith, A. P., Lane, L. C., Moquin, D. J., Aogo, R., Woolard, S., Thomas, P. G., Vogel, P., & Smith, A. M. (2021) · eLife · doi:10.7554/elife.68864 · Cited by 70
Pica, N., Langlois, R. A., Krammer, F., Margine, I., & Palese, P. (2012) · Journal of Virology · doi:10.1128/jvi.01131-12 · Cited by 69
Oral Administration of Bifidobacterium longum Ameliorates Influenza Virus Infection in Mice
Iwabuchi, N., Xiao, J., Yaeshima, T., & Iwatsuki, K. (2011) · Biological and Pharmaceutical Bulletin · doi:10.1248/bpb.34.1352 · Cited by 66
Aging of the CD4 T Cell Compartment
Lefebvre, J. S. (2012) · Open Longevity Science · doi:10.2174/1876326x01206010083 · Cited by 65
Ebola virus infection modeling and identifiability problems
Nguyễn, V. K., Binder, S. C., Boianelli, A., Meyer‐Hermann, M., & Hernandez-Vargas, E. A. (2015) · Frontiers in Microbiology · doi:10.3389/fmicb.2015.00257 · Cited by 64
A large-scale immuno-epidemiological simulation of influenza A epidemics
Lukens, S., DePasse, J. V., Rosenfeld, R., Ghedin, E., Mochan, E., Brown, S. T., Grefenstette, J. J., Burke, D. S., Swigon, D., & Clermont, G. (2014) · BMC Public Health · doi:10.1186/1471-2458-14-1019 · Cited by 63
Analysis of Practical Identifiability of a Viral Infection Model
Nguyễn, V. K., Klawonn, F., Mikolajczyk, R., & Hernandez-Vargas, E. A. (2016) · PLoS ONE · doi:10.1371/journal.pone.0167568 · Cited by 62
Chen, W. H., Toapanta, F. R., Shirey, K. A., Zhang, L., Giannelou, A., Page, C., Frieman, M. B., Vogel, S. N., & Cross, A. S. (2011) · Immunology Letters · doi:10.1016/j.imlet.2011.10.009 · Cited by 64
Self-citationMultiscale model within-host and between-host for viral infectious diseases
Almocera, A. E. S., Nguyễn, V. K., & Hernandez-Vargas, E. A. (2018) · Journal of Mathematical Biology · doi:10.1007/s00285-018-1241-y · Cited by 61
Iterative community-driven development of a SARS-CoV-2 tissue simulatorPreprint
Getz, M., Wang, Y., An, G. C., Asthana, M., Becker, A., Cockrell, C., Collier, N. T., Craig, M., Davis, C. L., Faeder, J. R., et al. (2020) · bioRxiv (Cold Spring Harbor Laboratory) · doi:10.1101/2020.04.02.019075 · Cited by 61
Nagai, M., Moriyama, M., Ishii, C., Mori, H., Watanabe, H., Nakahara, T., Yamada, T., Ishikawa, D., Ishikawa, T., Hirayama, A., et al. (2023) · Nature Communications · doi:10.1038/s41467-023-39569-0 · Cited by 63
Role of NK Cells in Influenza Infection
Schultz‐Cherry, S. (2014) · Current topics in microbiology and immunology · doi:10.1007/82_2014_403 · Cited by 59
Bhardwaj, N., Heise, M. T., & Ross, T. M. (2010) · PLoS neglected tropical diseases · doi:10.1371/journal.pntd.0000725 · Cited by 59
Self-citationReduced dynamic range of antiviral innate immune responses in aging
Molony, R. D., Malawista, A., & Montgomery, R. R. (2017) · Experimental Gerontology · doi:10.1016/j.exger.2017.08.019 · Cited by 60
Immune-mediated attenuation of influenza illness after infection: opportunities and challenges
Patel, M. M., York, I. A., Monto, A. S., Thompson, M. G., & Fry, A. M. (2021) · The Lancet Microbe · doi:10.1016/s2666-5247(21)00180-4 · Cited by 57
Steeg, L. G. V., Dhakal, S., Woldetsadik, Y. A., Park, H.-S., Mulka, K. R., Reilly, E. C., Topham, D. J., & Klein, S. L. (2020) · PLoS Pathogens · doi:10.1371/journal.ppat.1008506 · Cited by 54
Considerations for a Respiratory Syncytial Virus Vaccine Targeting an Elderly Population
Stephens, L. M., & Varga, S. M. (2021) · Vaccines · doi:10.3390/vaccines9060624 · Cited by 54
Immunesenescence: A Predisposing Risk Factor for the Development of COVID-19?
Hazeldine, J., & Lord, J. M. (2020) · Frontiers in Immunology · doi:10.3389/fimmu.2020.573662 · Cited by 55
Older but Not Wiser: the Age-Driven Changes in Neutrophil Responses during Pulmonary Infections
Simmons, S. R., Bhalla, M., Herring, S. E., Tchalla, E. Y. I., & Ghanem, E. N. B. (2021) · Infection and Immunity · doi:10.1128/iai.00653-20 · Cited by 56
Huffman, D. M., Justice, J. N., Stout, M. B., Kirkland, J. L., Barzilai, N., & Austad, S. N. (2016) · The Journals of Gerontology Series A: Biological Sciences and Medical Sciences · doi:10.1093/gerona/glw106 · Cited by 52
A spatial sequencing atlas of age-induced changes in the lung during influenza infection
Kasmani, M. Y., Topchyan, P., Brown, A. K., Brown, R. J., Wu, X., Chen, Y., Khatun, A., Alson, D., Wu, Y., Burns, R., et al. (2023) · Nature Communications · doi:10.1038/s41467-023-42021-y · Cited by 55
SARS-CoV-2, immunosenescence and inflammaging: partners in the COVID-19 crime
Domingues, R., Lippi, A., Setz, C., Outeiro, T. F., & Kriško, A. (2020) · Aging · doi:10.18632/aging.103989 · Cited by 52
Krishnarajah, S., Ingelfinger, F., Friebel, E., Cansever, D., Amorim, A., Andreadou, M., Bamert, D., Litscher, G., Lutz, M., Mayoux, M., et al. (2021) · Nature Aging · doi:10.1038/s43587-021-00148-x · Cited by 57
A Novel Immunobiotics Bacteroides dorei Ameliorates Influenza Virus Infection in Mice
Song, L., Huang, Y., Liu, G., Li, X., Xiao, Y., Liu, C., Zhang, Y., Li, J., Xu, J., Lu, S., et al. (2022) · Frontiers in Immunology · doi:10.3389/fimmu.2021.828887 · Cited by 53
The inflammatory response to influenza A virus (H1N1): An experimental and mathematical study
Price, I., Mochan, E., David Swigon, A., Ermentrout, B., Lukens, S., Toapanta, F. R., Ross, T. M., & Clermont, G. (2015) · Journal of Theoretical Biology · doi:10.1016/j.jtbi.2015.03.017 · Cited by 51
Self-citationBhat, T. A., Kalathil, S. G., Leigh, N. J., Muthumalage, T., Rahman, I., Goniewicz, M. L., & Thanavala, Y. M. (2020) · Nicotine & Tobacco Research · doi:10.1093/ntr/ntaa267 · Cited by 51
Schneider-Ohrum, K., Giles, B. M., Weirback, H. K., Williams, B. L., DeAlmeida, D. R., & Ross, T. M. (2011) · Vaccine · doi:10.1016/j.vaccine.2011.09.051 · Cited by 50
Self-citationAge-related Dysregulation of Inflammation and Innate Immunity: Lessons Learned from Rodent Models.
Brubaker, A. L., Palmer, J. L., & Kovacs, E. J. (2011) · Europe PMC (PubMed Central) · Cited by 47
Vaccine efficacy and T helper cell differentiation change with aging
Lefebvre, J. S., Lorenzo, E. C., Masters, A. R., Hopkins, J. W., Eaton, S. M., Smiley, S. T., & Haynes, L. (2016) · Oncotarget · doi:10.18632/oncotarget.9254 · Cited by 46
How Inflammation Blunts Innate Immunity in Aging
Goldberg, E. L., Shaw, A. C., & Montgomery, R. R. (2020) · Interdisciplinary topics in gerontology and geriatrics · doi:10.1159/000504480 · Cited by 46
Tantawy, M. A., Hatesuer, B., Wilk, E., Dengler, L., Kasnitz, N., Weiß, S., & Schughart, K. (2014) · PLoS ONE · doi:10.1371/journal.pone.0106392 · Cited by 42
Sun, S., Zhao, G., Xiao, W., Hu, J., Guo, Y., Yu, H., Wu, X., Tan, Y., & Zhou, Y. (2011) · Virology Journal · doi:10.1186/1743-422x-8-52 · Cited by 42
Epithelial Cells from Smokers Modify Dendritic Cell Responses in the Context of Influenza Infection
Horvath, K. M., Brighton, L. E., Zhang, W., Carson, J. L., & Jaspers, I. (2010) · American Journal of Respiratory Cell and Molecular Biology · doi:10.1165/rcmb.2010-0190oc · Cited by 42
Beswick, M., Pachnio, A., Lauder, S. N., Sweet, C., & Moss, P. A. H. (2012) · Journal of Virology · doi:10.1128/jvi.02427-12 · Cited by 41
Nguyen, T. H. O., McAuley, J., Kim, Y., Zheng, M. Z. M., Gherardin, N. A., Godfrey, D. I., Purcell, D. F. J., Sullivan, L. C., Westall, G. P., Reading, P. C., et al. (2021) · Clinical & Translational Immunology · doi:10.1002/cti2.1242 · Cited by 42
Aging and respiratory viral infection: from acute morbidity to chronic sequelae
Wu, Y., Goplen, N. P., & Sun, J. (2021) · Cell & Bioscience · doi:10.1186/s13578-021-00624-2 · Cited by 42
Bartley, J. M., Pan, S. J., Keilich, S. R., Hopkins, J. W., Al‐Naggar, I. M., Kuchel, G. A., & Haynes, L. (2016) · Aging · doi:10.18632/aging.100882 · Cited by 41
CD8+ T cell immunity to 2009 pandemic and seasonal H1N1 influenza viruses
Scheible, K. M., Zhang, G., Baer, J., Azadniv, M., Lambert, K., Pryhuber, G., Treanor, J. J., & Topham, D. J. (2011) · Vaccine · doi:10.1016/j.vaccine.2010.12.073 · Cited by 39
Jennrich, S., Lee, M. H., Lynn, R. C., Dewberry, K., & Debes, G. F. (2012) · Journal of Virology · doi:10.1128/jvi.07025-11 · Cited by 41
Evasion of natural killer cells by influenza virus
Guo, H., Kumar, P., & Malarkannan, S. (2010) · Journal of Leukocyte Biology · doi:10.1189/jlb.0610319 · Cited by 39
Lu, J., Duan, X., Zhao, W., Wang, J., Wang, H., Zhou, K., & Fang, M. (2018) · Aging and Disease · doi:10.14336/ad.2017.0701 · Cited by 38
Lewis, N. M., Zhu, Y., Peltan, I. D., Gaglani, M., McNeal, T., Ghamande, S. A., Steingrub, J. S., Shapiro, N. I., Duggal, A., Bender, W., et al. (2023) · Clinical Infectious Diseases · doi:10.1093/cid/ciad677 · Cited by 38
Toapanta, F. R., Bernal, P. J., & Sztein, M. B. (2012) · Frontiers in Cellular and Infection Microbiology · doi:10.3389/fcimb.2012.00128 · Cited by 39
Self-citationLanzer, K. G., Cookenham, T. S., Reiley, W. W., & Blackman, M. A. (2018) · Immunity & Ageing · doi:10.1186/s12979-018-0122-y · Cited by 38
Amatore, D., Celestino, I., Brundu, S., Galluzzi, L., Coluccio, P., Checconi, P., Magnani, M., Palamara, A. T., Fraternale, A., & Nencioni, L. (2019) · FASEB BioAdvances · doi:10.1096/fba.2018-00066 · Cited by 37
Cellular Senescence in Immunity against Infections
Marrella, V., Facoetti, A., & Cassani, B. (2022) · International Journal of Molecular Sciences · doi:10.3390/ijms231911845 · Cited by 38
Aging exacerbates damage and delays repair of alveolar epithelia following influenza viral pneumonia
Yin, L., Zheng, D., Limmon, G. V., Leung, N. H. N., Xu, S., Rajapakse, J. C., Yu, H., Chow, V. T. K., & Chen, J. (2014) · Respiratory Research · doi:10.1186/s12931-014-0116-z · Cited by 36
Combination of STING Pathway Agonist With Saponin Is an Effective Adjuvant in Immunosenescent Mice
Vassilieva, E. V., Taylor, D., & Compans, R. W. (2019) · Frontiers in Immunology · doi:10.3389/fimmu.2019.03006 · Cited by 35
Human Susceptibility to Influenza Infection and Severe DiseasePreprint
Mettelman, R. C., & Thomas, P. G. (2020) · Cold Spring Harbor Perspectives in Medicine · doi:10.1101/cshperspect.a038711 · Cited by 35
Ren, Z., Na, L., Xu, Y., Rozati, M., Wang, J., Xu, J., Sun, C., Vidal, K., Wu, D., & Meydani, S. N. (2012) · Journal of Nutrition · doi:10.3945/jn.112.159467 · Cited by 32
Phenotype and functions of conventional dendritic cells are not compromised in aged mice
Tan, S., Cavanagh, L. L., d'Advigor, W., Shackel, N. A., Groth, B. F. D. S., & Weninger, W. (2012) · Immunology and Cell Biology · doi:10.1038/icb.2011.104 · Cited by 32
Inflammatory responses to influenza vaccination at the extremes of age
McDonald, J. U., Zhong, Z., Groves, H., & Tregoning, J. S. (2017) · Immunology · doi:10.1111/imm.12742 · Cited by 32
Recruited and Tissue-Resident Natural Killer Cells in the Lung During Infection and Cancer
Franklin, M., Connolly, E., & Hussell, T. (2022) · Frontiers in Immunology · doi:10.3389/fimmu.2022.887503 · Cited by 32
Metadata
- Authors
- Toapanta, F. R., & Ross, T. M.
- Affiliations
- University of Maryland, Baltimore (US)
- University of Pittsburgh (US)
- Corresponding author
- Toapanta, Franklin R
- Ross, Ted M
- Venue
- Respiratory Research
- Published
- 2009-11-18
- Volume
- 10
- Issue
- 1
- Pages
- 112-112
- ISSN
- 1465-9921 (ISSN-L)
- 1465-993X
- PMC
- PMC2785782
- OpenAlex
- W2106535354
- Cited by
- 259
- References
- 72
- Citations by year
- 2026: 15 · 2025: 11 · 2024: 17 · 2023: 10 · 2022: 18 · 2021: 25 · 2020: 21 · 2019: 24 · 2018: 12 · 2017: 12 · 2016: 10 · 2015: 10 · 2014: 13 · 2013: 9 · 2012: 23
- FWCI
- 11.64
- Type
- journal article
- Language
- en
- Open access
- gold
- doi.org
- Licence
- Locations
- Respiratory Research (publishedVersion, cc-by)
- PubMed Central (publishedVersion, cc-by)
- PubMed (publishedVersion)
- DOAJ (DOAJ: Directory of Open Access Journals) (submittedVersion)
- Funders
- National Institutes of Health (n01ai50018-7-0-1)
- National Institute of General Medical Sciences (R01GM083602)
- National Institute of Allergy and Infectious Diseases (N01AI50018)
- Topics
- Health Sciences › Medicine › Epidemiology › Influenza Virus Research Studies
- Life Sciences › Immunology and Microbiology › Immunology › Immune responses and vaccinations
- Life Sciences › Immunology and Microbiology › Immunology › Immune Response and Inflammation
- Keywords
- influenza, immunosenescence, aged mice, lung immune response, antigen-presenting cells, myeloid dendritic cells, CD40, CD69, T cell activation, B cell activation, neutralizing antibodies, cytokines and chemokines
- MeSH terms
- Age Factors, Aging, Animals, Antigen-Presenting Cells, B-Lymphocytes, Cell Line, Chemotaxis, Dendritic Cells, Disease Models, Animal, Dogs, Female, Granulocytes, Immunity, Innate, Kinetics, Lung, Lymphocyte Activation, Macrophages, Mice, Inbred BALB C, Orthomyxoviridae Infections, T-Lymphocytes, Weight Loss, Immunophenotyping, Cytokines, Chemokines, Mice, Influenza A Virus, H1N1 Subtype, Adaptive Immunity
About these checks
Registry, retraction, Cites and statistics results are computed, not judged, with one exception: a printed reference that no index lists is read once by a model before it counts as a citation error. Claims are extracted by a model and kept only when their quote appears verbatim in the text; each cited source is then checked, with a model’s help, for whether it says what the claim relies on. Those verdicts can be wrong — read the claim’s quote and the cited source before relying on one.
Statistics and arithmetic are recomputed, not judged.
Confidence bands are shown only for fields calibrated on our annotated test set. None is calibrated yet, so no band is shown.
What counts as a claim ›How we measure confidence ›How we check this ›
Are you an author, or do you see a problem with this page? Request a review
