

The DOI matches its Crossref record; 28 of the 28 references it cites were found in a registry or an index.
Decon2LS: An open-source software package for automated processing and visualization of high resolution mass spectrometry data
Open accessAbstract
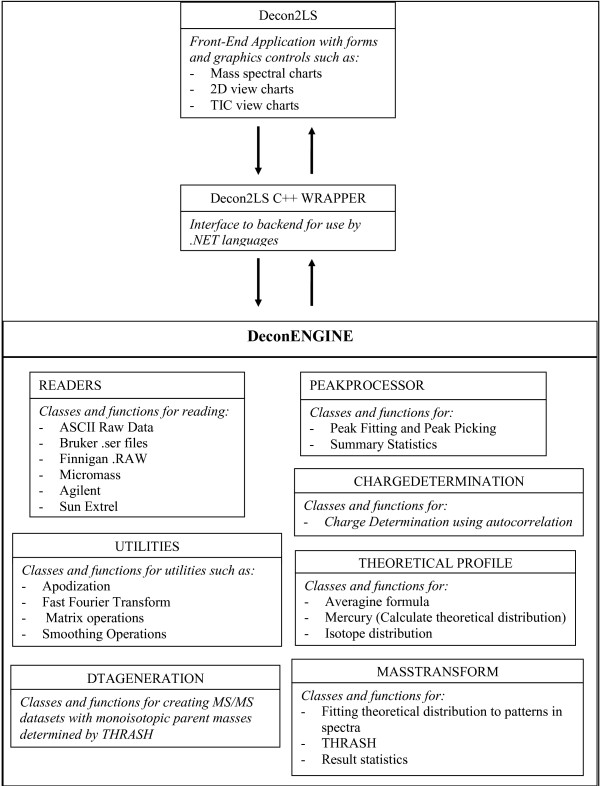
Background: Data generated from liquid chromatography coupled to high-resolution mass spectrometry (LC-MS)-based studies of a biological sample can contain large amounts of biologically significant information in the form of proteins, peptides, and metabolites. Interpreting this data involves inferring the masses and abundances of biomolecules injected into the instrument. Because of the inherent complexity of mass spectral patterns produced by these biomolecules, the analysis is significantly enhanced by using visualization capabilities to inspect and confirm results. In this paper we describe Decon2LS, an open-source software package for automated processing and visualization of high-resolution MS data. Drawing extensively on algorithms developed over the last ten years for ICR2LS, Decon2LS packages the algorithms as a rich set of modular, reusable processing classes for performing diverse functions such as reading raw data, routine peak finding, theoretical isotope distribution modelling, and deisotoping. Because the source code is openly available, these functionalities can now be used to build derivative applications in relatively fast manner. In addition, Decon2LS provides an extensive set of visualization tools, such as high performance chart controls. Results: With a variety of options that include peak processing, deisotoping, isotope composition, etc, Decon2LS supports processing of multiple raw data formats. Deisotoping can be performed on an individual scan, an individual dataset, or on multiple datasets using batch processing. Other processing options include creating a two dimensional view of mass and liquid chromatography (LC) elution time features, generating spectrum files for tandem MS data, creating total intensity chromatograms, and visualizing theoretical peptide profiles. Application of Decon2LS to deisotope different datasets obtained across different instruments yielded a high number of features that can be used to identify and quantify peptides in the biological sample. Conclusion: Decon2LS is an efficient software package for discovering and visualizing features in proteomics studies that require automated interpretation of mass spectra. Besides being easy to use, fast, and reliable, Decon2LS is also open-source, which allows developers in the proteomics and bioinformatics communities to reuse and refine the algorithms to meet individual needs. Decon2LS source code, installer, and tutorials may be downloaded free of charge at http://http:/ncrr.pnl.gov/software/.
Overview
The claims and statistics of this paper haven’t been checked yet.
Free: it reads the open-access text and checks the first 5 claims that cite a source we can check. Create a free account to check every claim.
Integrity signals
Registry
Cites
Statistics
Figures
Verification
Claims the paper makes
The claims and statistics of this paper haven’t been checked yet.
Free: it reads the open-access text and checks the first 5 claims that cite a source we can check. Create a free account to check every claim.
Claims other papers make about this one
Each is checked against this paper’s own text: does it say what the citing paper says it does?
The cited source says what the claim attributes to it.
In the citing paper
“Importing data obtained from different MS instruments is supported using ProteoWizard,12 DeconEngine,13 and vendor provided libraries.”
From MASH Explorer: A Universal Software Environment for Top-Down Proteomics (2020) · cites this paper as [13]
Self-check
Percentages, sums and reported differences re-computed from the paper’s own numbers.
The self-check needs the paper’s full text.
Citations
Cites
Eng, J. K., McCormack, A. L., & Yates, J. R. (1994) · Journal of the American Society for Mass Spectrometry · doi:10.1016/1044-0305(94)80016-2 · Cited by 6,484 · cited 1×
“These files can be processed using search-engines such as SEQUEST[22] to identify peptides.”
MethodSmith, C. A., Want, E. J., O'Maille, G., Abagyan, R., & Siuzdak, G. (2006) · Analytical Chemistry · doi:10.1021/ac051437y · Cited by 5,262 · cited 1×
“While XCMS [13] is useful for data pre-processing, peak-detection, retention-time alignment and peak matching across samples, this algorithm also does not perform deisotoping. msInspect [14] is an analysis package for deisotoping high-resolution LC-MS data in mzXML format in sequential steps.”
MethodOpenMS – An open-source software framework for mass spectrometry
Sturm, M., Bertsch, A., Gröpl, C., Hildebrandt, A., Hussong, R., Lange, E., Pfeifer, N., Schulz-Trieglaff, O., Zerck, A., Reinert, K., et al. (2008) · BMC Bioinformatics · doi:10.1186/1471-2105-9-163 · Cited by 644
Interpreting mass spectra of multiply charged ions
Mann, M., Meng, C. K., & Fenn, J. B. (1989) · Analytical Chemistry · doi:10.1021/ac00190a023 · Cited by 588 · cited 1×
“Several deisotoping and visualization algorithms have been described in the literature [3-9] and are available as part of commercial vendor packages such as XCalibur (Thermo Fisher), MassHunter (Agilent) and Elucidator System (Rosetta Biosoftware).”
MethodZhang, Z., & Marshall, A. G. (1998) · Journal of the American Society for Mass Spectrometry · doi:10.1016/s1044-0305(97)00284-5 · Cited by 509 · cited 1×
“Several deisotoping and visualization algorithms have been described in the literature [3-9] and are available as part of commercial vendor packages such as XCalibur (Thermo Fisher), MassHunter (Agilent) and Elucidator System (Rosetta Biosoftware).”
MethodAutomated reduction and interpretation of
Horn, D. M., Zubarev, R. A., & McLafferty, F. W. (2000) · Journal of the American Society for Mass Spectrometry · doi:10.1016/s1044-0305(99)00157-9 · Cited by 507
Senko, M. W., Beu, S. C., & McLaffertycor, F. W. (1995) · Journal of the American Society for Mass Spectrometry · doi:10.1016/1044-0305(95)00017-8 · Cited by 451 · cited 2×
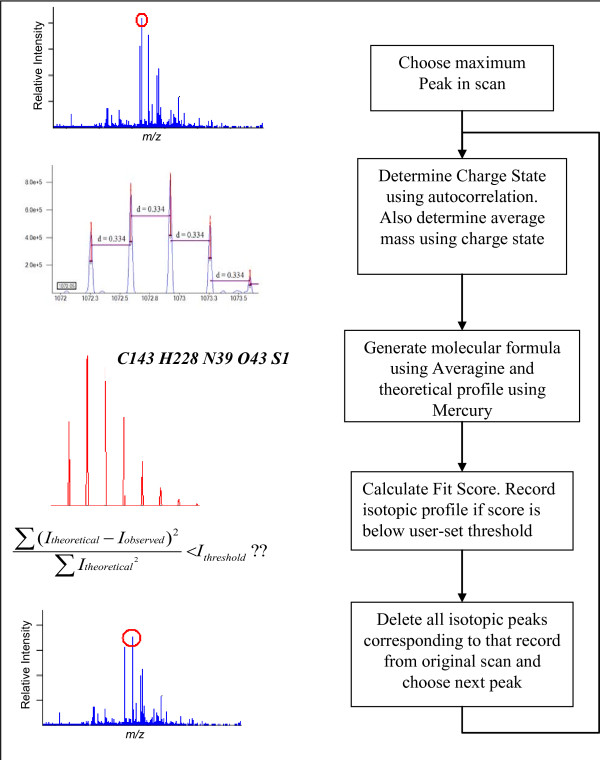
“The most likely empirical composition is determined using the average mass determined in step 2 and the Averagine algorithm [17], which assumes an empirical composition that is equal to the average composition of all the peptides in a protein FASTA file.”
MethodAn accurate mass tag strategy for quantitative and high-throughput proteome measurements
Smith, R. D., Anderson, G. A., Lipton, M. S., Pasa-Tolic, L., Shen, Y., Conrads, T. P., Veenstra, T. D., & Udseth, H. R. (2002) · PROTEOMICS · doi:10.1002/1615-9861(200205)2:5<513::aid-prot513>3.0.co;2-w · Cited by 432 · cited 2×
“tides in a database constructed from previous LC-MS/MS analyses [20].”
MethodSelf-citationBellew, M., Coram, M., Fitzgibbon, M., Igra, M., Randolph, T., Wang, P., May, D., Eng, J., Fang, R., Lin, C., et al. (2006) · Bioinformatics · doi:10.1093/bioinformatics/btl276 · Cited by 265 · cited 1×
“msInspect [14] is an analysis package for deisotoping high-resolution LC-MS data in mzXML format in sequential steps.”
MethodSenko, M. W., Canterbury, J. D., Guan, S., & Marshall, A. G. (1996) · Rapid Communications in Mass Spectrometry · doi:10.1002/(sici)1097-0231(199611)10:14<1839::aid-rcm718>3.0.co;2-v · Cited by 259 · cited 1×
“While a functional application of THRASH was not provided by its developers, the algorithm was reportedly incorporated into the MIDAS [18] data system.”
Method
Cited by
Advances in structure elucidation of small molecules using mass spectrometry
Kind, T., & Fiehn, O. (2010) · Bioanalytical Reviews · doi:10.1007/s12566-010-0015-9 · Cited by 480
“Open-source software tools, such as Decon2LS [136], exist (see Fig.”
MethodDiamond, D. L., Syder, A. J., Jacobs, J. M., Sorensen, C. M., Walters, K.-A., Proll, S. C., McDermott, J. E., Gritsenko, M. A., Zhang, Q., Zhao, R., et al. (2010) · PLoS Pathogens · doi:10.1371/journal.ppat.1000719 · Cited by 412
“Decon2LS [26], VIPER [27]; freely available at http://ncrr.”
BackgroundSelf-citationLin, P., Liu, J., Shilling, J. E., Kathmann, S. M., Laskin, J., & Laskin, A. (2015) · Physical Chemistry Chemical Physics · doi:10.1039/c5cp02563j · Cited by 306
Yu, L., Smith, J., Laskin, A., Anastasio, C., Laskin, J., & Zhang, Q. (2014) · Atmospheric Chemistry and Physics · doi:10.5194/acp-14-13801-2014 · Cited by 272
“Peaks with a S / N (signal-to-noise ratio) > 10 were selected using the Decon2LS software developed at the Pacific Northwest National Laboratory (PNNL) (Jaitly et al., 2009).”
MethodRevealing Brown Carbon Chromophores Produced in Reactions of Methylglyoxal with Ammonium Sulfate
Lin, P., Laskin, J., Nizkorodov, S. A., & Laskin, A. (2015) · Environmental Science & Technology · doi:10.1021/acs.est.5b03608 · Cited by 231
Metadata
- Authors
- Jaitly, N., Mayampurath, A., Littlefield, K., Adkins, J. N., Anderson, G. A., & Smith, R. D.
- Affiliations
- Pacific Northwest National Laboratory (US)
- Corresponding author
- Smith, Richard D
- Venue
- BMC Bioinformatics
- Published
- 2009-03-17
- Volume
- 10
- Issue
- 1
- Pages
- 87-87
- ISSN
- 1471-2105 (ISSN-L)
- PMC
- PMC2666663
- OpenAlex
- W2014186056
- Cited by
- 217
- References
- 26
- Citations by year
- 2026: 7 · 2025: 4 · 2024: 6 · 2023: 5 · 2022: 4 · 2021: 3 · 2020: 11 · 2019: 9 · 2018: 12 · 2017: 12 · 2016: 18 · 2015: 15 · 2014: 23 · 2013: 23 · 2012: 19
- FWCI
- 8.73
- Type
- journal article
- Language
- en
- Open access
- gold
- doi.org
- Licence
- cc-by
- Locations
- BMC Bioinformatics (publishedVersion, cc-by)
- PubMed Central (publishedVersion, cc-by)
- PubMed (publishedVersion)
- TSpace (University of Toronto) (submittedVersion)
- DOAJ (DOAJ: Directory of Open Access Journals) (submittedVersion)
- Funders
- U.S. Department of Energy (RR018522, DE-AC05?, 76RLO 1830, DE‐AC05‐76RLO1830)
- Battelle (DE-AC05, DE‐AC05‐76RLO 1830)
- National Institutes of Health
- National Center for Research Resources (P41RR018522, RR-018522)
- Biological and Environmental Research (DE-AC05-76RLO-1830, RR018522)
- Pacific Northwest National Laboratory (DE-AC05-76RLO 1830)
- Topics
- Life Sciences › Biochemistry, Genetics and Molecular Biology › Molecular Biology › Metabolomics and Mass Spectrometry Studies
- Physical Sciences › Chemistry › Spectroscopy › Advanced Proteomics Techniques and Applications
- Physical Sciences › Chemistry › Spectroscopy › Mass Spectrometry Techniques and Applications
- Keywords
- high-resolution mass spectrometry, LC-MS data processing, peak detection, proteomics, peptide identification, open source software
- MeSH terms
- Algorithms, Chromatography, Liquid, Software, Mass Spectrometry, Proteomics
About these checks
Registry, retraction, Cites and statistics results are computed, not judged, with one exception: a printed reference that no index lists is read once by a model before it counts as a citation error. Claims are extracted by a model and kept only when their quote appears verbatim in the text; each cited source is then checked, with a model’s help, for whether it says what the claim relies on. Those verdicts can be wrong — read the claim’s quote and the cited source before relying on one.
Statistics and arithmetic are recomputed, not judged.
Confidence bands are shown only for fields calibrated on our annotated test set. None is calibrated yet, so no band is shown.
What counts as a claim ›How we measure confidence ›How we check this ›
Are you an author, or do you see a problem with this page? Request a review
How to cite
Cite CoChat for the checks on this page, and the paper for its own findings.
- This page
- CoChat. (2026). Citation check: Decon2LS: An open-source software package for automated processing and visualization of high resolution mass spectrometry data. https://app.cochat.ai/papers/10.1186/1471-2105-10-87
- The paper
- Jaitly, N., Mayampurath, A., Littlefield, K., Adkins, J. N., Anderson, G. A., & Smith, R. D. (2009). Decon2LS: An open-source software package for automated processing and visualization of high resolution mass spectrometry data. BMC Bioinformatics. https://doi.org/10.1186/1471-2105-10-87
Data sources
Bibliographic data: Semantic Scholar, OpenAlex, Crossref.
Contains information from the Semantic Scholar Academic Graph Datasets, made available under the ODC Attribution License (ODC-BY 1.0).
Semantic Scholar’s data is described in: Kinney, R., et al. (2023). The Semantic Scholar Open Data Platform. arXiv:2301.10140.
