

The DOI matches its Crossref record; 42 of the 42 references it cites were found in a registry or an index.
Improved human disease candidate gene prioritization using mouse phenotype
Open accessAbstract
Background: The majority of common diseases are multi-factorial and modified by genetically and mechanistically complex polygenic interactions and environmental factors. High-throughput genome-wide studies like linkage analysis and gene expression profiling, tend to be most useful for classification and characterization but do not provide sufficient information to identify or prioritize specific disease causal genes. Results: Extending on an earlier hypothesis that the majority of genes that impact or cause disease share membership in any of several functional relationships we, for the first time, show the utility of mouse phenotype data in human disease gene prioritization. We study the effect of different data integration methods, and based on the validation studies, we show that our approach, ToppGene http://toppgene.cchmc.org , outperforms two of the existing candidate gene prioritization methods, SUSPECTS and ENDEAVOUR. Conclusion: The incorporation of phenotype information for mouse orthologs of human genes greatly improves the human disease candidate gene analysis and prioritization.
Overview
The claims and statistics of this paper haven’t been checked yet.
Run the check — free, no account needed. It reads the open-access text and checks the sources it cites.
Integrity signals
Registry
Cites
Statistics
Figures
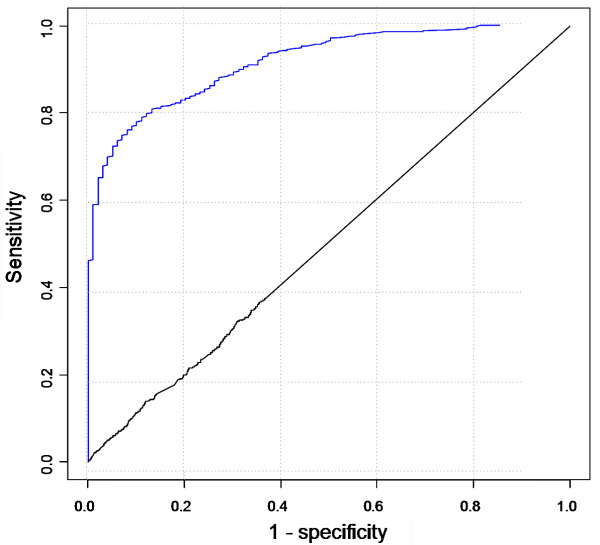
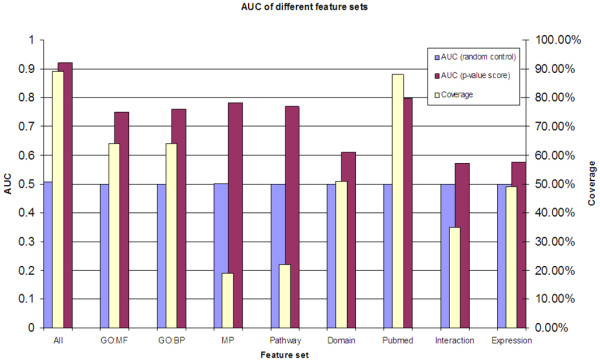
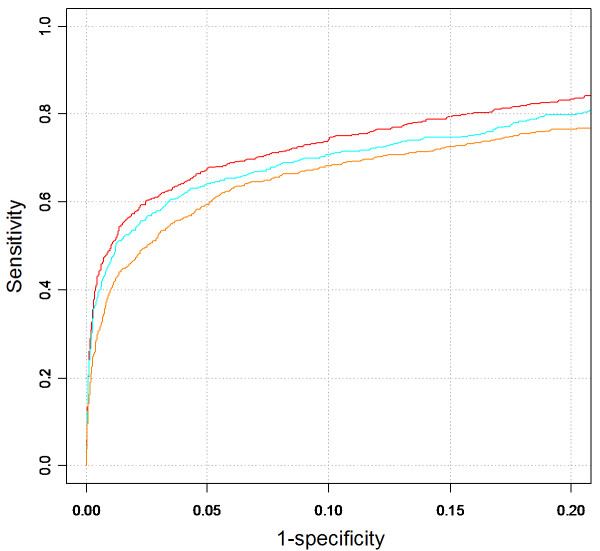
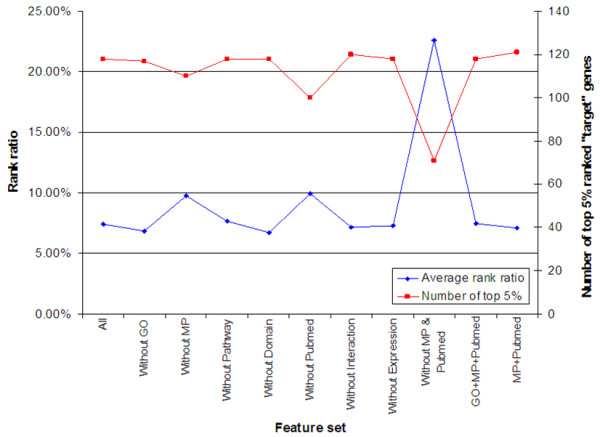
Verification
Claims the paper makes
The claims and statistics of this paper haven’t been checked yet.
Run the check — free, no account needed. It reads the open-access text and checks the sources it cites.
Claims other papers make about this one
Each is checked against this paper’s own text: does it say what the citing paper says it does?
The cited source says what the claim attributes to it.
In the citing paper
“mining genes associated with phenotypes from the Mammalian Phenotype Ontology resource (Smith et al, 2005; Chen et al, 2007) revealed that, albeit less significant when compared to Hep‐ID TFs, Hep‐IDCONNECT TF‐encoding genes are linked to abnormal liver phenotypes and metabolic functions (Fig 2G).”
From An extended transcription factor regulatory network controls hepatocyte identity (2023) · cites this paper as Chen et al, 2007
Self-check
Percentages, sums and reported differences re-computed from the paper’s own numbers.
The self-check needs the paper’s full text.
Citations
Cites
Subramanian, A., Tamayo, P., Mootha, V. K., Mukherjee, S., Ebert, B. L., Gillette, M. A., Paulovich, A., Pomeroy, S. L., Golub, T. R., Lander, E. S., et al. (2005) · Proceedings of the National Academy of Sciences · doi:10.1073/pnas.0506580102 · Cited by 53,625
DAVID: Database for Annotation, Visualization, and Integrated Discovery
Dennis, G., Sherman, B. T., Hosack, D. A., Yang, J., Gao, W., Lane, H. C., & Lempicki, R. A. (2003) · Genome Biology · doi:10.1186/gb-2003-4-5-p3 · Cited by 9,327
The Gene Ontology (GO) database and informatics resource
Gene Ontology Consortium (2003) · Nucleic Acids Research · doi:10.1093/nar/gkh036 · Cited by 4,596
The unified medical language system (UMLS): integrating biomedical terminology
Bodenreider, O. (2004) · Nucleic Acids Research · doi:10.1093/nar/gkh061 · Cited by 4,356
BioGRID: a general repository for interaction datasets
Stark, C. (2006) · Nucleic Acids Research · doi:10.1093/nar/gkj109 · Cited by 3,960
A gene atlas of the mouse and human protein-encoding transcriptomes
Su, A. I., Wiltshire, T., Batalov, S., Lapp, H., Ching, K. A., Block, D., Zhang, J., Soden, R., Hayakawa, M., Kreiman, G., et al. (2004) · Proceedings of the National Academy of Sciences · doi:10.1073/pnas.0400782101 · Cited by 3,475
From genomics to chemical genomics: new developments in KEGG
Kanehisa, M. I. (2005) · Nucleic Acids Research · doi:10.1093/nar/gkj102 · Cited by 3,126
Pfam: clans, web tools and services
Finn, R. D. (2005) · Nucleic Acids Research · doi:10.1093/nar/gkj149 · Cited by 2,291
Evolving gene/transcript definitions significantly alter the interpretation of GeneChip data
Dai, M. (2005) · Nucleic Acids Research · doi:10.1093/nar/gni179 · Cited by 1,807
BIND--The Biomolecular Interaction Network Database
Bader, G. D. (2001) · Nucleic Acids Research · doi:10.1093/nar/29.1.242 · Cited by 1,560
Research works printed but not linked: 2
- Entrez Gene. [http://www.ncbi.nlm.nih.gov/entrez/query.fcgi?db=gene]
- NCBI Gene Expression Omnibus (GEO). [http://www.ncbi.nlm.nih.gov/projects/geo/]
Cited by
Sorted by citations
ToppGene Suite for gene list enrichment analysis and candidate gene prioritization
Chen, J., Bardes, E. E., Aronow, B. J., & Jegga, A. G. (2009) · Nucleic Acids Research · doi:10.1093/nar/gkp427 · Cited by 2,952
Self-citationDivergence of human and mouse brain transcriptome highlights Alzheimer disease pathways
Miller, J. A., Horvath, S., & Geschwind, D. H. (2010) · Proceedings of the National Academy of Sciences · doi:10.1073/pnas.0914257107 · Cited by 480
Computational tools for prioritizing candidate genes: boosting disease gene discovery
Moreau, Y., & Tranchevent, L.-C. (2012) · Nature Reviews Genetics · doi:10.1038/nrg3253 · Cited by 417
Kaimal, V., Bardes, E. E., Tabar, S., Jegga, A. G., & Aronow, B. J. (2010) · Nucleic Acids Research · doi:10.1093/nar/gkq418 · Cited by 369
Self-citationDisease candidate gene identification and prioritization using protein interaction networks
Chen, J., Aronow, B. J., & Jegga, A. G. (2009) · BMC Bioinformatics · doi:10.1186/1471-2105-10-73 · Cited by 374
Self-citationThe mammalian phenotype ontology: enabling robust annotation and comparative analysis
Smith, C. L., & Eppig, J. T. (2009) · WIREs Systems Biology and Medicine · doi:10.1002/wsbm.44 · Cited by 353
An Integrated Genome-wide CRISPRa Approach to Functionalize lncRNAs in Drug Resistance
Bester, A. C., Lee, J. D., Chavez, A., Lee, Y.-R., Nachmani, D., Vora, S., Victor, J., Sauvageau, M., Monteleone, E., Rinn, J. L., et al. (2018) · Cell · doi:10.1016/j.cell.2018.03.052 · Cited by 318
Single-cell transcriptomic analysis of mouse neocortical development
Loo, L., Simon, J. M., Xing, L., McCoy, E. S., Niehaus, J. K., Guo, J., Anton, E. S., & Zylka, M. J. (2019) · Nature Communications · doi:10.1038/s41467-018-08079-9 · Cited by 289
Wong, H. R., Cvijanovich, N. Z., Allen, G. L., Lin, R., ANAS, N. G., Meyer, K., Freishtat, R. J., Monaco, M., Odoms, K., Sakthivel, B., et al. (2009) · Critical Care Medicine · doi:10.1097/ccm.0b013e31819fcc08 · Cited by 260
The ADP/ATP translocase drives mitophagy independent of nucleotide exchange
Hoshino, A., Wang, W.-J., Wada, S., McDermott-Roe, C., Evans, C. S., Gosis, B., Morley, M. P., Rathi, K. S., Li, J., Li, K., et al. (2019) · Nature · doi:10.1038/s41586-019-1667-4 · Cited by 228
PhenomeNET: a whole-phenome approach to disease gene discovery
Hoehndorf, R., Schofield, P. N., & Gkoutos, G. V. (2011) · Nucleic Acids Research · doi:10.1093/nar/gkr538 · Cited by 224
Atlas of Gene Expression in the Developing Kidney at Microanatomic Resolution
Brunskill, E. W., Aronow, B. J., Georgas, K. M., Rumballe, B. A., Valerius, M. T., Aronow, J. E., Kaimal, V., Jegga, A. G., Grimmond, S. M., McMahon, A. P., et al. (2008) · Developmental Cell · doi:10.1016/j.devcel.2008.09.007 · Cited by 221
Self-citationHinge, A. S., He, J., Bartram, J., Javier, J. E., Xu, J., Fjellman, E., Sesaki, H., Li, T., Yu, J., Wunderlich, M., et al. (2020) · Cell stem cell · doi:10.1016/j.stem.2020.01.016 · Cited by 206
Erlich, Y., Edvardson, S., Hodges, E. C., Zenvirt, S., Thekkat, P. U., Shaag, A., Dor, T., Hannon, G. J., & Elpeleg, O. N. (2011) · Genome Research · doi:10.1101/gr.117143.110 · Cited by 198
A guide to web tools to prioritize candidate genes
Tranchevent, L.-C., Capdevila, F. B., Nitsch, D., Moor, B. D., Causmaecker, P. D., & Moreau, Y. (2010) · Briefings in Bioinformatics · doi:10.1093/bib/bbq007 · Cited by 189
AP-1 activity induced by co-stimulation is required for chromatin opening during T cell activation
Yukawa, M., Jagannathan, S., Vallabh, S., Kartashov, A. V., Chen, X., Weirauch, M. T., & Barski, A. (2019) · The Journal of Experimental Medicine · doi:10.1084/jem.20182009 · Cited by 173
Using genetic markers to orient the edges in quantitative trait networks: The NEO software
Aten, J. E., Fuller, T. F., Lusis, A. J., & Horvath, S. (2008) · BMC Systems Biology · doi:10.1186/1752-0509-2-34 · Cited by 147
Gene-Network Analysis Identifies Susceptibility Genes Related to Glycobiology in Autism
van der Zwaag, B., Franke, L., Poot, M., Hochstenbach, R., Spierenburg, H. A., Vorstman, J. A. S., van Daalen, E., de Jonge, M. V., Verbeek, N. E., Brilstra, E. H., et al. (2009) · PLoS ONE · doi:10.1371/journal.pone.0005324 · Cited by 147
Cheng, L., Li, J., Ju, P., Peng, J., & Wang, Y. (2014) · PLoS ONE · doi:10.1371/journal.pone.0099415 · Cited by 143
Nam, K. T., Lee, H.-J., Smith, J. J., Lapierre, L. A., Kamath, V. P., Chen, X., Aronow, B. J., Yeatman, T. J., Bhartur, S. G., Calhoun, B. C., et al. (2010) · Journal of Clinical Investigation · doi:10.1172/jci40728 · Cited by 141
Self-citationGLAD4U: deriving and prioritizing gene lists from PubMed literature
Jourquin, J., Duncan, D. T., Shi, Z., & Zhang, B. (2012) · BMC Genomics · doi:10.1186/1471-2164-13-s8-s20 · Cited by 140
Systems biology of the autophagy-lysosomal pathway
Jegga, A. G., Schneider, L. E., Ouyang, X., & Zhang, J. (2011) · Autophagy · doi:10.4161/auto.7.5.14811 · Cited by 129
Self-citationTargetMine, an Integrated Data Warehouse for Candidate Gene Prioritisation and Target Discovery
Chen, Y. A., Tripathi, L. P., & Mizuguchi, K. (2011) · PLoS ONE · doi:10.1371/journal.pone.0017844 · Cited by 124
Improving disease gene prioritization using the semantic similarity of Gene Ontology terms
Schlicker, A., Lengauer, T., & Albrecht, M. (2010) · Bioinformatics · doi:10.1093/bioinformatics/btq384 · Cited by 124
Boczek, N. J., Best, J. M., Tester, D. J., Giudicessi, J. R., Middha, S., Evans, J. M., Kamp, T. J., & Ackerman, M. J. (2013) · Circulation Cardiovascular Genetics · doi:10.1161/circgenetics.113.000138 · Cited by 111
Exploiting Protein-Protein Interaction Networks for Genome-Wide Disease-Gene Prioritization
Güney, E., & Oliva, B. (2012) · PLoS ONE · doi:10.1371/journal.pone.0043557 · Cited by 109
Elucidation of MRAS-mediated Noonan syndrome with cardiac hypertrophy
Higgins, E. M., Bos, J. M., Mason‐Suares, H., Tester, D. J., Ackerman, J. P., MacRae, C. A., Sol‐Church, K., Gripp, K. W., Urrutia, R. A., & Ackerman, M. J. (2017) · JCI Insight · doi:10.1172/jci.insight.91225 · Cited by 95
Logan-Collins, J. M., Thomas, R. M., Yu, P., Jaquish, D., Mose, E. S., French, R. P., Stuart, W. D., McClaine, R. J., Aronow, B. J., Hoffman, R. M., et al. (2010) · Cancer Research · doi:10.1158/0008-5472.can-09-0761 · Cited by 94
Self-citationConserved senescence associated genes and pathways in primary human fibroblasts detected by RNA-seq
Marthandan, S., Baumgart, M., Priebe, S., Groth, M., Schaer, J., Kaether, C., Guthke, R., Cellerino, A., Platzer, M., Diekmann, S., et al. (2016) · PLOS ONE · doi:10.1371/journal.pone.0154531 · Cited by 91
“associated ones, such as “DNA replication (hsa03030)”, “Cell cycle (hsa04110)”, and DNA repair pathways (Fig 4), consistent with [97].”
BackgroundGenome-wide Enrichment of De Novo Coding Mutations in Orofacial Cleft Trios
Bishop, M. R., Perez, K. K. D., Sun, M. R., Ho, S., Chopra, P., Mukhopadhyay, N., Hetmanski, J. B., Taub, M. A., Moreno‐Uribe, L. M., Valencia‐Ramirez, L. C., et al. (2020) · The American Journal of Human Genetics · doi:10.1016/j.ajhg.2020.05.018 · Cited by 91
An unbiased evaluation of gene prioritization tools
Börnigen, D., Tranchevent, L.-C., Capdevila, F. B., Devriendt, K., Moor, B. D., Causmaecker, P. D., & Moreau, Y. (2012) · Bioinformatics · doi:10.1093/bioinformatics/bts581 · Cited by 81
Luo, Y., Uzuner, Ö., & Szolovits, P. (2016) · Briefings in Bioinformatics · doi:10.1093/bib/bbw001 · Cited by 80
Buxbaum, J. D., Betancur, C., Bozdagi, O., Dorr, N. P., Elder, G. A., & Hof, P. R. (2012) · Molecular Autism · doi:10.1186/2040-2392-3-1 · Cited by 76
PINTA: a web server for network-based gene prioritization from expression data
Nitsch, D., Tranchevent, L.-C., Gonçalves, J. P., Vogt, J. K., Madeira, S. C., & Moreau, Y. (2011) · Nucleic Acids Research · doi:10.1093/nar/gkr289 · Cited by 74
Mahmoudi, E., Fitzsimmons, C., Geaghan, M. P., Shannon Weickert, C., Atkins, J. R., Wang, X., & Cairns, M. J. (2019) · Neuropsychopharmacology · doi:10.1038/s41386-019-0348-1 · Cited by 73
The meningeal transcriptional response to traumatic brain injury and aging
Bolte, A. C., Shapiro, D. A., Dutta, A. B., Feng, W., Bruch, K. R., Kovacs, M. A., Marco, A. R., Ennerfelt, H. E., & Lukens, J. R. (2022) · eLife · doi:10.7554/elife.81154 · Cited by 78
The genetic architecture of pediatric cardiomyopathy
Ware, S. M., Bhatnagar, S., Dexheimer, P. J., Wilkinson, J. D., Sridhar, A., Fan, X., Shen, Y., Tariq, M., Schubert, J. A., Colan, S. D., et al. (2022) · The American Journal of Human Genetics · doi:10.1016/j.ajhg.2021.12.006 · Cited by 73
Self-citationLevy, H., Wang, X., Kaldunski, M. L., Jia, S., Kramer, J., Pavletich, S. J., Reske, M., Gessel, T., Yassai, M. B., Quasney, M. W., et al. (2012) · Genes and Immunity · doi:10.1038/gene.2012.41 · Cited by 72
Bioinformatics for personal genome interpretation
Capriotti, E., Nehrt, N. L., Kann, M. G., & Bromberg, Y. (2012) · Briefings in Bioinformatics · doi:10.1093/bib/bbr070 · Cited by 68
In Silico Gene Prioritization by Integrating Multiple Data Sources
Chen, Y., Wang, W., Zhou, Y., Shields, R., Chanda, S. K., Elston, R. C., & Li, J. (2011) · PLoS ONE · doi:10.1371/journal.pone.0021137 · Cited by 67
Prakash, S. K., Bondy, C. A., Maslen, C. L., Silberbach, M., Lin, A. E., Perrone, L., Limongelli, G., Michelena, H. I., Bossone, E., Citro, R., et al. (2016) · American Journal of Medical Genetics Part A · doi:10.1002/ajmg.a.37953 · Cited by 67
Chapter 15: Disease Gene Prioritization
Bromberg, Y. (2013) · PLoS Computational Biology · doi:10.1371/journal.pcbi.1002902 · Cited by 69
MECP2 directly interacts with RNA polymerase II to modulate transcription in human neurons
Liu, Y., Flamier, A., Bell, G. W., Diao, A. J., Whitfield, T. W., Wang, H., Wu, Y., Schulte, F., Friesen, M., Guo, R., et al. (2024) · Neuron · doi:10.1016/j.neuron.2024.04.007 · Cited by 64
Huff, M. L., da Silveira, W. A., Carnevali, O., Renaud, L., & Hardiman, G. (2018) · Scientific Reports · doi:10.1038/s41598-018-20266-8 · Cited by 63
SHIP-AHOY (Study of High Blood Pressure in Pediatrics: Adult Hypertension Onset in Youth)
Mendizábal, B., Urbina, E. M., Becker, R. C., Daniels, S. R., Falkner, B. E., Hamdani, G., Hanevold, C. D., Hooper, S. R., Ingelfinger, J. R., Lande, M. B., et al. (2018) · Hypertension · doi:10.1161/hypertensionaha.118.11434 · Cited by 59
Neighbor-favoring weight reinforcement to improve random walk-based disease gene prioritization
Le, D., & Kwon, Y. (2013) · Computational Biology and Chemistry · doi:10.1016/j.compbiolchem.2013.01.001 · Cited by 58
Enriched expression of genes associated with autism spectrum disorders in human inhibitory neurons
Wang, P., Zhao, D., Lachman, H. M., & Zheng, D. (2018) · Translational Psychiatry · doi:10.1038/s41398-017-0058-6 · Cited by 61
AUTS2 isoforms control neuronal differentiation
Monderer‐Rothkoff, G., Tal, N., Risman, M., Shani, O., Nissim‐Rafinia, M., Malki-Feldman, L., Medvedeva, V. P., Groszer, M., Meshorer, E., & Shifman, S. (2019) · Molecular Psychiatry · doi:10.1038/s41380-019-0409-1 · Cited by 57
Recent approaches to the prioritization of candidate disease genes
Doncheva, N. T., Kacprowski, T., & Albrecht, M. (2012) · WIREs Systems Biology and Medicine · doi:10.1002/wsbm.1177 · Cited by 56
Linking genes to diseases: it's all in the data
Tiffin, N., Andrade-Navarro, M. A., & Perez‐Iratxeta, C. (2009) · Genome Medicine · doi:10.1186/gm77 · Cited by 54
Machine learning-based approaches for disease gene prediction
Le, D. (2020) · Briefings in Functional Genomics · doi:10.1093/bfgp/elaa013 · Cited by 55
Le, D., & Kwon, Y. (2012) · Computational Biology and Chemistry · doi:10.1016/j.compbiolchem.2012.02.004 · Cited by 53
Turkowski, K. L., Tester, D. J., Bos, J. M., Haugaa, K. H., & Ackerman, M. J. (2017) · Congenital Heart Disease · doi:10.1111/chd.12462 · Cited by 52
Whole transcriptome expression profiling of mouse limb tendon development by using RNA‐seq
Liu, H., Xu, J., Liu, C., Lan, Y., Wylie, C. C., & Jiang, R. (2015) · Journal of Orthopaedic Research® · doi:10.1002/jor.22886 · Cited by 50
Noninjurious mechanical ventilation activates a proinflammatory transcriptional program in the lung
Gharib, S. A., Liles, W. C., Klaff, L. S., & Altemeier, W. A. (2009) · Physiological Genomics · doi:10.1152/physiolgenomics.00027.2009 · Cited by 50
Ontology-based disease similarity network for disease gene prediction
Le, D., & Dang, V.-T. (2016) · Vietnam Journal of Computer Science · doi:10.1007/s40595-016-0063-3 · Cited by 50
Fulford, L., Milewski, D., Ustiyan, V., Ravishankar, N., Cai, Y., Le, T. T., Masineni, S. N., Kasper, S., Aronow, B. J., Kalinichenko, V. V., et al. (2016) · Science Signaling · doi:10.1126/scisignal.aad5582 · Cited by 49
Self-citationRetractedA genome-wide scan statistic framework for whole-genome sequence data analysis
He, Z., Xu, B., Buxbaum, J. D., & Ionita‐Laza, I. (2019) · Nature Communications · doi:10.1038/s41467-019-11023-0 · Cited by 50
Khanna, P., Soh, H. J., Chen, C.-H., Saxena, R., Amin, S., Naughton, M., Joslin, P. M. N., Moore, A., Bakouny, Z., O'Callaghan, C., et al. (2021) · Science Translational Medicine · doi:10.1126/scitranslmed.abc0170 · Cited by 49
A Survey of Gene Prioritization Tools for Mendelian and Complex Human Diseases
Zolotareva, O., & Kleine, M. (2019) · Journal of Integrative Bioinformatics · doi:10.1515/jib-2018-0069 · Cited by 46
Prioritization of Candidate Genes for Periodontitis Using Multiple Computational Tools
Zhan, Y., Zhang, R., Lv, H., Song, X., Xu, X., Chai, L., Lv, W., Shang, Z., Jiang, Y., & Zhang, R. (2014) · Journal of Periodontology · doi:10.1902/jop.2014.130523 · Cited by 46
Saik, O., Сергеевич, Д. П., Ivanisenko, T., Bragina, E. Y., Freidin, M. B., Goncharova, I. A., Dosenko, V., Zolotareva, O. I., Hofestaedt, R., Lavrik, I. N., et al. (2018) · BMC Medical Genomics · doi:10.1186/s12920-018-0331-4 · Cited by 46
Zhao, Y., Zheng, D., & Cvekl, A. (2018) · Experimental Eye Research · doi:10.1016/j.exer.2018.06.004 · Cited by 49
Berto, S., Treacher, A., Caglayan, E., Luo, D., Haney, J. R., Gandal, M. J., Geschwind, D. H., Montillo, A., & Konopka, G. (2022) · Nature Communications · doi:10.1038/s41467-022-31053-5 · Cited by 48
Dissecting microregulation of a master regulatory network
Sinha, A. U., Kaimal, V., Chen, J., & Jegga, A. G. (2008) · BMC Genomics · doi:10.1186/1471-2164-9-88 · Cited by 44
Self-citationSundberg, J. P., Sundberg, B. A., & Schofield, P. N. (2008) · Mammalian Genome · doi:10.1007/s00335-008-9123-z · Cited by 44
Conserved co-expression for candidate disease gene prioritization
Oti, M., van Reeuwijk, J., Huynen, M. A., & Brunner, H. G. (2008) · BMC Bioinformatics · doi:10.1186/1471-2105-9-208 · Cited by 43
Zhang, L., Kim, S. B., Jia, G., Buhmeida, A. S., Dallol, A., Wright, W. E., Fornace, A. J., Alqahtani, M. S., & Shay, J. W. (2015) · BMC Genomics · doi:10.1186/1471-2164-16-s1-s8 · Cited by 45
Computational Disease Gene Prioritization: An Appraisal
Gill, N., Singh, S. N., & Aseri, T. C. (2014) · Journal of Computational Biology · doi:10.1089/cmb.2013.0158 · Cited by 41
Prakash, S. K., Kuang, S.-Q., GenTAC Registry Investigators, Regalado, E. S., Guo, D., & Milewicz, D. M. (2016) · PLoS ONE · doi:10.1371/journal.pone.0153543 · Cited by 40
Rev-erb regulation of cholesterologenesis
Sitaula, S., Zhang, J., Ruiz, F., & Burris, T. P. (2017) · Biochemical Pharmacology · doi:10.1016/j.bcp.2017.02.006 · Cited by 42
Gudivada, R. C., Qu, X. A., Chen, J., Jegga, A. G., Neumann, E., & Aronow, B. J. (2008) · Journal of Biomedical Informatics · doi:10.1016/j.jbi.2008.07.004 · Cited by 40
Self-citationDNA methylation and allergic sensitizations: A genome‐scale longitudinal study during adolescence
Zhang, H., Kaushal, A., Merid, S. K., Melén, E., Pershagen, G., Rezwan, F. I., Han, L., Ewart, S., Arshad, S. H., Karmaus, W., et al. (2019) · Allergy · doi:10.1111/all.13746 · Cited by 39
Somatic mutations in early onset luminal breast cancer
Encinas, G., Sabelnykova, V. Y., de Lyra, E. C., Katayama, M. L. H., Maistro, S., Valle, P. W. M. D. V., Pereira, G. F. D. L., Rodrigues, L. M., Serio, P. A. D. M. P., de Gouvêa, A. C. R. C., et al. (2018) · Oncotarget · doi:10.18632/oncotarget.25123 · Cited by 37
Integrated Pathway Clusters with Coherent Biological Themes for Target Prioritisation
Chen, Y. A., Tripathi, L. P., Dessailly, B. H., Nyström-Persson, J., Ahmad, S., & Mizuguchi, K. (2014) · PLoS ONE · doi:10.1371/journal.pone.0099030 · Cited by 36
Inferring novel gene-disease associations using Medical Subject Heading Over-representation Profiles
Cheung, W., Ouellette, B. F. F., & Wasserman, W. W. (2012) · Genome Medicine · doi:10.1186/gm376 · Cited by 35
Whole exome sequencing analysis in severe chronic obstructive pulmonary disease
Qiao, D., Ameli, A., Prokopenko, D., Chen, H., Kho, A. T., Parker, M. M., Morrow, J. D., Hobbs, B. D., Liu, Y., Beaty, T. H., et al. (2018) · Human Molecular Genetics · doi:10.1093/hmg/ddy269 · Cited by 34
Baran, N. M., & Streelman, J. T. (2020) · Genes Brain & Behavior · doi:10.1111/gbb.12657 · Cited by 36
Zhu, J., Cui, L., Wang, W., Hang, X., Xu, A., Yang, S., Dou, J., Mu, Y., Zhang, X., & Gao, J. (2013) · Familial Cancer · doi:10.1007/s10689-013-9642-y · Cited by 34
Text Mining in Cancer Gene and Pathway Prioritization
Luo, Y., Riedlinger, G., & Szolovits, P. (2014) · Cancer Informatics · doi:10.4137/cin.s13874 · Cited by 33
Kurowski, B. G., Treble‐Barna, A., Pitzer, A. J., Wade, S. L., Martin, L. J., Chima, R. S., & Jegga, A. G. (2017) · Journal of Neurotrauma · doi:10.1089/neu.2016.4856 · Cited by 35
Self-citationEguchi, R., Karim, M. B., Hu, P., Sato, T., Ono, N., Kanaya, S., & Altaf‐Ul‐Amin, M. (2018) · BMC Bioinformatics · doi:10.1186/s12859-018-2251-x · Cited by 32
Heterogeneous networks integration for disease–gene prioritization with node kernels
Tran, V. D., Sperduti, A., Backofen, R., & Costa, F. (2020) · Bioinformatics · doi:10.1093/bioinformatics/btaa008 · Cited by 32
Sgadó, P., Provenzano, G., Dassi, E., Adami, V., Zunino, G., Genovesi, S., Casarosa, S., & Bozzi, Y. (2013) · Molecular Autism · doi:10.1186/2040-2392-4-51 · Cited by 31
Lewis, E. M. A., Meganathan, K., Baldridge, D., Gontarz, P. M., Zhang, B., Bonni, A., Constantino, J. N., & Kroll, K. L. (2019) · Molecular Autism · doi:10.1186/s13229-019-0306-0 · Cited by 32
A scalable approach for statistical learning in semantic graphs
Huang, Y., Volker Tresp, C., Nickel, M., Rettinger, A., & Kriegel, H. (2014) · Semantic Web · doi:10.3233/sw-130100 · Cited by 30
Rahman, A., Nasir, M. U., Gollapalli, M. A. S., Alsaif, S. A., Almadhor, A. S., Mehmood, S., Khan, M. A., & Mosavi, A. H. (2022) · Computational Intelligence and Neuroscience · doi:10.1155/2022/2650742 · Cited by 30
miR-196b target screen reveals mechanisms maintaining leukemia stemness with therapeutic potential
Meyer, S. E., Muench, D. E., Rogers, A. M., Newkold, T. J., Orr, E., O'Brien, E. J., Perentesis, J. P., Doench, J. G., Lal, A., Morris, P. J., et al. (2018) · The Journal of Experimental Medicine · doi:10.1084/jem.20171312 · Cited by 30
Self-citationNayarisseri, A. (2020) · Current Topics in Medicinal Chemistry · doi:10.2174/156802662019200701164759 · Cited by 31
Disease gene prediction with privileged information and heteroscedastic dropout
Shu, J., Li, Y., Wang, S., Xi, B., & Ma, J. (2021) · Bioinformatics · doi:10.1093/bioinformatics/btab310 · Cited by 29
Plantier, L., Renaud, H., Respaud, R., Marchand-Adam, S., & Crestani, B. (2016) · International Journal of Molecular Sciences · doi:10.3390/ijms17122091 · Cited by 28
Wu, Y., Yuan, Y., Chen, L., Wang, M., Yang, Y., Wang, Y., Quan, C., Chen, D., Chen, Y., Huang, X., et al. (2019) · BioMed Research International · doi:10.1155/2019/2735038 · Cited by 27
Tsou, P., Palisoc, P. J., Ali, M. M., Khanna, D., & Sawalha, A. H. (2021) · Arthritis & Rheumatology · doi:10.1002/art.41694 · Cited by 27
MamPhEA: a web tool for mammalian phenotype enrichment analysis
Weng, M., & Liao, B. (2010) · Bioinformatics · doi:10.1093/bioinformatics/btq359 · Cited by 27
Integrated Genomic and Network-Based Analyses of Complex Diseases and Human Disease Network
Al‐Harazi, O., Insaif, S. A., Al-Ajlan, M., Kaya, N., Dzimiri, N., & Çolak, D. (2015) · Journal of genetics and genomics/Journal of Genetics and Genomics · doi:10.1016/j.jgg.2015.11.002 · Cited by 28
Novel phenotype–disease matching tool for rare genetic diseases
Chen, J., Xu, H. Y., Jegga, A. G., Zhang, K., White, P. S., & Zhang, G. (2018) · Genetics in Medicine · doi:10.1038/s41436-018-0050-4 · Cited by 26
Self-citationTheisen, E. R., Miller, K. R., Showpnil, I. A., Taslim, C., Pishas, K. I., & Lessnick, S. L. (2019) · Genes & Cancer · doi:10.18632/genesandcancer.188 · Cited by 26
Han, Y., Ye, X., Wang, C., Liu, Y., Zhang, S., Feng, W., Huang, K., & Zhang, J. (2019) · Biology Direct · doi:10.1186/s13062-019-0244-y · Cited by 26
Iba, M., McDevitt, R. A., Kim, C., Roy, R., Sarantopoulou, D., Tommer, E., Siegars, B., Sallin, M. A., Kwon, S., Sen, J. M., et al. (2022) · Molecular Neurodegeneration · doi:10.1186/s13024-022-00564-6 · Cited by 26
RetractedChemical-protein interactome and its application in off-target identification
Yang, L., Wang, K., Wang, L., Jegga, A. G., Qin, S., He, G., Chen, J., Xiao, Y., & He, L. (2011) · Interdisciplinary Sciences Computational Life Sciences · doi:10.1007/s12539-011-0051-8 · Cited by 27
Self-citation
Metadata
- Authors
- Chen, J., Xu, H., Aronow, B. J., & Jegga, A. G.
- Affiliations
- Cincinnati Children's Hospital Medical Center (US)
- Corresponding author
- Jegga, Anil G
- Venue
- BMC Bioinformatics
- Published
- 2007-10-16
- Volume
- 8
- Issue
- 1
- Pages
- 392-392
- ISSN
- 1471-2105 (ISSN-L)
- PMC
- PMC2194797
- OpenAlex
- W2128245545
- Cited by
- 284
- References
- 42
- Citations by year
- 2026: 7 · 2025: 14 · 2024: 13 · 2023: 21 · 2022: 18 · 2021: 15 · 2020: 13 · 2019: 18 · 2018: 22 · 2017: 7 · 2016: 20 · 2015: 9 · 2014: 19 · 2013: 11 · 2012: 21
- FWCI
- 4.63
- Type
- journal article
- Language
- en
- Open access
- gold
- doi.org
- Licence
- cc-by
- Locations
- BMC Bioinformatics (publishedVersion, cc-by)
- PubMed Central (publishedVersion, cc-by)
- PubMed (publishedVersion)
- DOAJ (DOAJ: Directory of Open Access Journals) (submittedVersion, cc-by-sa)
- Funders
- National Cancer Institute (U01 CA84291-07, UO1 CA84291-07, CA84291, U01CA084291, CA84291-07)
- Topics
- Life Sciences › Biochemistry, Genetics and Molecular Biology › Molecular Biology › Bioinformatics and Genomic Networks
- Health Sciences › Medicine › Health Informatics › Biomedical Text Mining and Ontologies
- Life Sciences › Biochemistry, Genetics and Molecular Biology › Genetics › Genomics and Rare Diseases
- Keywords
- candidate gene prioritization, human disease genes, mouse phenotypes, mouse orthologs, data integration, polygenic disease
- MeSH terms
- Algorithms, Animals, Chromosome Mapping, Humans, Phenotype, Species Specificity, Linkage Disequilibrium, Genetic Predisposition to Disease, Mice
About these checks
Registry, retraction, Cites and statistics results are computed, not judged, with one exception: a printed reference that no index lists is read once by a model before it counts as a citation error. Claims are extracted by a model and kept only when their quote appears verbatim in the text; each cited source is then checked, with a model’s help, for whether it says what the claim relies on. Those verdicts can be wrong — read the claim’s quote and the cited source before relying on one.
Statistics and arithmetic are recomputed, not judged.
Confidence bands are shown only for fields calibrated on our annotated test set. None is calibrated yet, so no band is shown.
What counts as a claim ›How we measure confidence ›How we check this ›
Are you an author, or do you see a problem with this page? Request a review
