

The DOI matches its Crossref record; 109 of the 110 references it cites were found in a registry or an index.
Phylogeography of the reef fish Cephalopholis argus (Epinephelidae) indicates Pleistocene isolation across the indo-pacific barrier with contemporary overlap in the coral triangle
Open accessAbstract
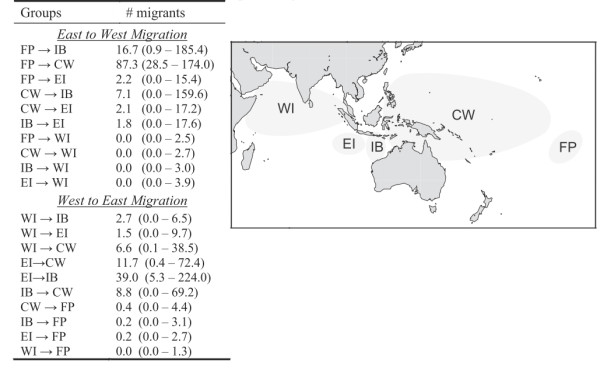
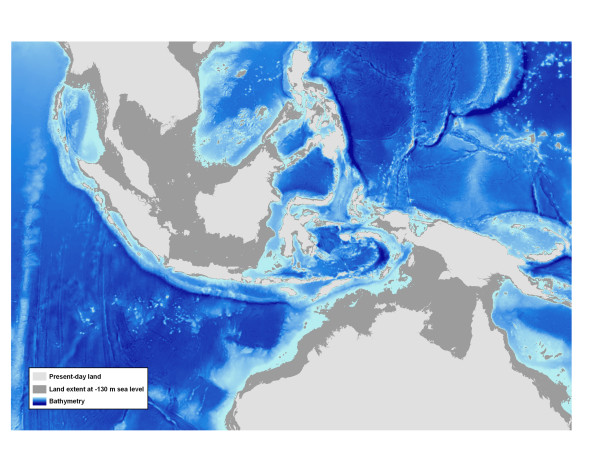
BACKGROUND: The Coral Triangle (CT), bounded by the Philippines, the Malay Peninsula, and New Guinea, is the epicenter of marine biodiversity. Hypotheses that explain the source of this rich biodiversity include 1) the center of origin, 2) the center of accumulation, and 3) the region of overlap. Here we contribute to the debate with a phylogeographic survey of a widely distributed reef fish, the Peacock Grouper (Cephalopholis argus; Epinephelidae) at 21 locations (N = 550) using DNA sequence data from mtDNA cytochrome b and two nuclear introns (gonadotropin-releasing hormone and S7 ribosomal protein). RESULTS: Population structure was significant (ΦST = 0.297, P < 0.001; FST = 0.078, P < 0.001; FST = 0.099, P < 0.001 for the three loci, respectively) among five regions: French Polynesia, the central-west Pacific (Line Islands to northeastern Australia), Indo-Pacific boundary (Bali and Rowley Shoals), eastern Indian Ocean (Cocos/Keeling and Christmas Island), and western Indian Ocean (Diego Garcia, Oman, and Seychelles). A strong signal of isolation by distance was detected in both mtDNA (r = 0.749, P = 0.001) and the combined nuclear loci (r = 0.715, P < 0.001). We detected evidence of population expansion with migration toward the CT. Two clusters of haplotypes were detected in the mtDNA data (d = 0.008), corresponding to the Pacific and Indian Oceans, with a low level of introgression observed outside a mixing zone at the Pacific-Indian boundary. CONCLUSIONS: We conclude that the Indo-Pacific Barrier, operating during low sea level associated with glaciation, defines the primary phylogeographic pattern in this species. These data support a scenario of isolation on the scale of 105 year glacial cycles, followed by population expansion toward the CT, and overlap of divergent lineages at the Pacific-Indian boundary. This pattern of isolation, divergence, and subsequent overlap likely contributes to species richness at the adjacent CT and is consistent with the region of overlap hypothesis.
Overview
The claims and statistics of this paper haven’t been checked yet.
Run the check — free, no account needed. It reads the open-access text and checks the sources it cites.
Integrity signals
Registry
Cites
Statistics
Figures
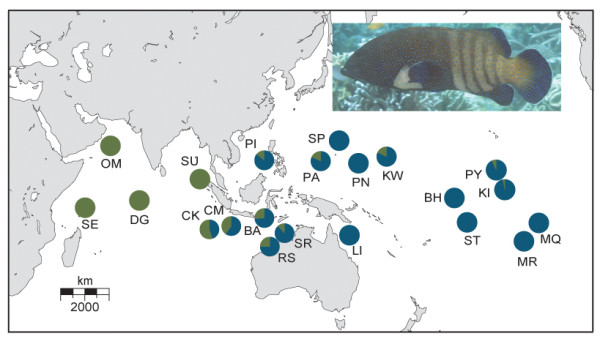
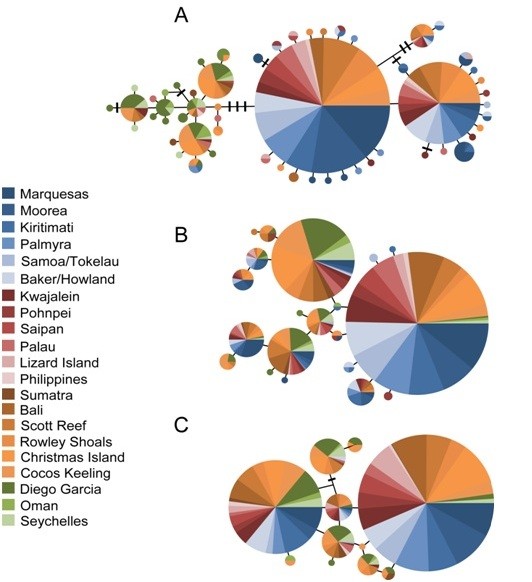
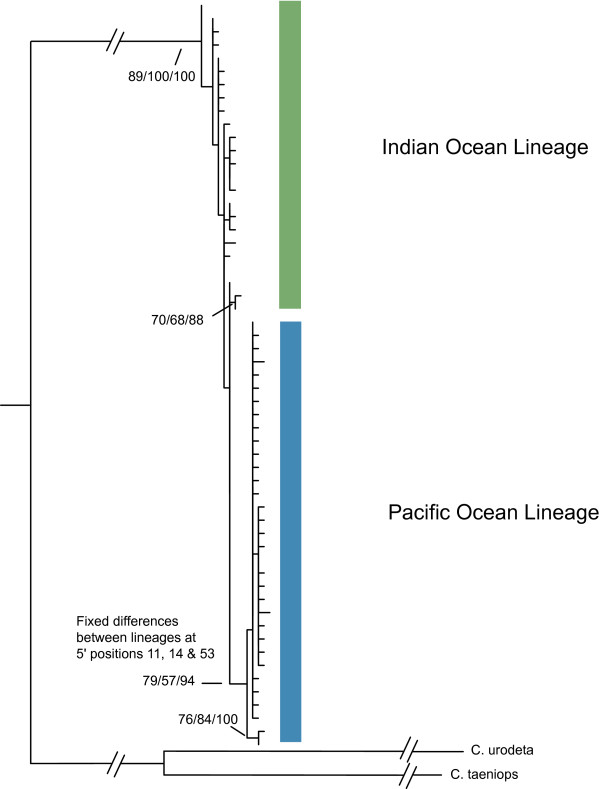
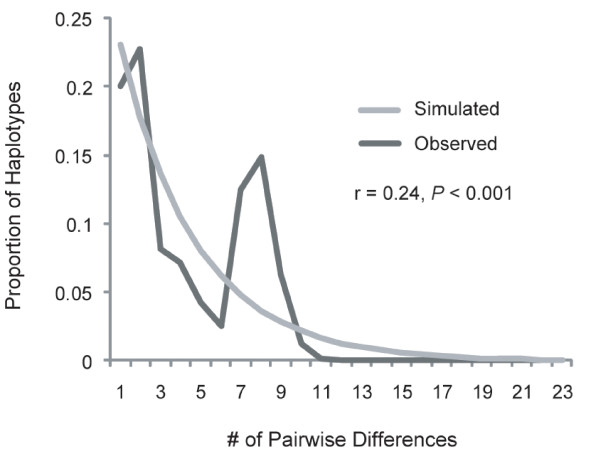
Verification
Claims the paper makes
The claims and statistics of this paper haven’t been checked yet.
Run the check — free, no account needed. It reads the open-access text and checks the sources it cites.
Claims other papers make about this one
Each is checked against this paper’s own text: does it say what the citing paper says it does?
The cited source says what the claim attributes to it.
In the citing paper
“The geographical range of C. porosus encompasses a well-known phylogeographic boundary, the Indo-Pacific Barrier, that affects many Indo-Pacific species (e.g., gastropods [56]; reef fish [57]).”
From Mitogenomic Crocodylia phylogeny and population structure of Crocodylus porosus including the extinct Seychelles crocodile (2026) · cites this paper as [57]
Self-check
Percentages, sums and reported differences re-computed from the paper’s own numbers.
The self-check needs the paper’s full text.
Citations
Cites
MEGA4: Molecular Evolutionary Genetics Analysis (MEGA) Software Version 4.0
Tamura, K., Dudley, J. T., Nei, M., & Kumar, S. (2007) · Molecular Biology and Evolution · doi:10.1093/molbev/msm092 · Cited by 28,734 · cited 1×
“05 among all pairwise tests by controlling for the false discovery [51,52].”
BackgroundMRBAYES: Bayesian inference of phylogenetic trees.
Huelsenbeck, J. P., & Ronquist, F. (2001) · Bioinformatics · doi:10.1093/bioinformatics/17.8.754 · Cited by 21,937 · cited 1×
“The ML tree topology was confirmed by neighbor-joining (NJ) and Bayesian Markov Chain Monte Carlo (MCMC) analysis using MEGA 4.0 [52] and MRBAYES 3.1.1 [ 53 ], respectively.”
MethodInfluentialA Simple, Fast, and Accurate Algorithm to Estimate Large Phylogenies by Maximum Likelihood
Guindon, S., & Gascuel, O. (2003) · Systematic Biology · doi:10.1080/10635150390235520 · Cited by 16,923 · cited 1×
“We used default priors under the HKY + G model of mutation (jMODELTEST) [61,62] and ran simulations for 10 million generations with sampling every 1000 generations.”
MethodMolecular Evolutionary Genetics
Nei, M. (1987) · Columbia University Press eBooks · doi:10.7312/nei-92038 · Cited by 16,583
Excoffier, L., & Lischer, H. E. L. (2010) · Molecular Ecology Resources · doi:10.1111/j.1755-0998.2010.02847.x · Cited by 16,266
DnaSP v5: a software for comprehensive analysis of DNA polymorphism data
Librado, P., & Rozas, J. (2009) · Bioinformatics · doi:10.1093/bioinformatics/btp187 · Cited by 16,147
RAxML-VI-HPC: maximum likelihood-based phylogenetic analyses with thousands of taxa and mixed models
Stamatakis, A. (2006) · Bioinformatics · doi:10.1093/bioinformatics/btl446 · Cited by 15,582
BEAST: Bayesian evolutionary analysis by sampling trees
Drummond, A. J., & Rambaut, A. (2007) · BMC Evolutionary Biology · doi:10.1186/1471-2148-7-214 · Cited by 13,104
Median-joining networks for inferring intraspecific phylogenies
Bandelt, H. J., Forster, P., & Rohl, A. (1999) · Molecular Biology and Evolution · doi:10.1093/oxfordjournals.molbev.a026036 · Cited by 11,742 · cited 1×
“5 with default settings [50].”
Tamura, K., & Nei, M. (1993) · Molecular Biology and Evolution · doi:10.1093/oxfordjournals.molbev.a040023 · Cited by 11,267 · cited 2×
“Because the TPM1uf+G model of sequence evolution is not implemented in ARLEQUIN, we used the most similar model available [54] with a gamma value of 0.”
Method
Research works printed but not linked: 13
- Veron JEM: Corals in space and time: The biogeography and evolution of the Scleratinia. 1995, Sydney: University of New South Wales Press
- Randall JE: Zoogeography of shorefishes of the Indo-Pacific region. Zool Studies. 1998, 37: 227-268.
- McManus JW: Marine speciation, tectonics, and sea-level changes in southeast Asia. Proceedings of the Fifth International Coral Reef Congress. Edited by: Gabrie C, Vivien MH. 1985, Moorea: Antenne Museum-Ephe, 133-138. 27 May-1 June 1985; Tahiti
- Ladd HS: Origin of the Pacific Island molluscan fauna. Am J Sci. 1960, 258A: 137-150.
- Woodland DJ: Zoogeography of the Siganidae (Pisces): an interpretation of distribution and richness patterns. Bull Mar Sci. 1983, 33: 713-717.
- Briggs JC: Marine zoogeography. 1974, New York: McGraw-Hill
- Randall JE: Reef and Shore Fishes of the South Pacific. 2005, Honolulu: Sea Grant College Program University of Hawaii
- Linderman KC, Lee TM, Wilson WD, Claro R, Ault JS: Transport of larvae originating in southwest Cuba and the Dry Tortugas: evidence for partial retention in grunts and snappers. Proc Gulf Carib Fish Inst. 2000, 52: 253-278.
- Fleminger A: The Pleistocene equatorial barrier between the Indian and Pacific Oceans and a likely cause for Wallace's line. UNESCO Technical Papers in Marine Science. 1986, 49: 84-97.
- Chappell J: Relative and average sea level changes, and endo-, epi-, and exogenic processes on the earth. Sea level, ice, and climatic change Int Ass Hydrol Sci Publ. 1981, 131: 411-430.
- Potts DC: Evolutionary disequilibrium among Indo-Pacific corals. Bull Mar Sci. 1983, 33: 619-632.
- Eble JA, Rocha LA, Craig MT, Bowen BW: Not all larvae stay close to home: Long-distance dispersal in Indo-Pacific reef fishes, with a focus on the Brown Surgeonfish (Acanthurus nigrofuscus). J Mar Bio. 2011
- Donaldson TJ: Distribution and species richness patterns of Indo-West Pacific Cirrhitidae: support for Woodland's hypothesis. Proceedings of the Second International Conference on Indo-Pacific fishes. Edited by: Uyeno T, Arai R, Taniuchi T, Matsuura K. 1986, Tokyo: Ichthyological Society of Japan, 623-628. 1986; Tokyo
Cited by
Sorted by citations
A realignment of marine biogeographic provinces with particular reference to fish distributions
Briggs, J. C., & Bowen, B. W. (2011) · Journal of Biogeography · doi:10.1111/j.1365-2699.2011.02613.x · Cited by 637
Self-citationThe origins of tropical marine biodiversity
Bowen, B. W., Rocha, L. A., Toonen, R. J., & Karl, S. A. (2013) · Trends in Ecology & Evolution · doi:10.1016/j.tree.2013.01.018 · Cited by 507
Self-citationFounder takes all: density-dependent processes structure biodiversity
Waters, J. M., Fraser, C. I., & Hewitt, G. M. (2012) · Trends in Ecology & Evolution · doi:10.1016/j.tree.2012.08.024 · Cited by 441
Comparative phylogeography of the ocean planet
Bowen, B. W., Gaither, M. R., DiBattista, J. D., Iacchei, M. J., Andrews, K. R., Grant, W. S., Toonen, R. J., & Briggs, J. C. (2016) · Proceedings of the National Academy of Sciences · doi:10.1073/pnas.1602404113 · Cited by 287
“(49), Sphyrna lewini data from Duncan et al.”
BackgroundSelf-citationThe historical biogeography of coral reef fishes: global patterns of origination and dispersal
Cowman, P. F., & Bellwood, D. R. (2012) · Journal of Biogeography · doi:10.1111/jbi.12003 · Cited by 256
“In contrast to the Indian Ocean, the island arcs that make up the Central Pacific region have been closely linked to the IAA, with gene flow between the two regions allowing the Central Pacific to easily inherit ancestral widespread ranges (and vice versa; see Craig et al., 2010; Gaither et al., 2011).”
BackgroundA review of contemporary patterns of endemism for shallow water reef fauna in the Red Sea
DiBattista, J. D., Roberts, M. B., Bouwmeester, J., Bowen, B. W., Coker, D. J., Lozano‐Cortés, D. F., Howard Choat, J., Gaither, M. R., Hobbs, J. A., Khalil, M. T., et al. (2016) · Journal of Biogeography · doi:10.1111/jbi.12649 · Cited by 252
Self-citationThe Diversity and Biogeography of Western Indian Ocean Reef-Building Corals
Obura, D. (2012) · PLoS ONE · doi:10.1371/journal.pone.0045013 · Cited by 228
“Further evidence for this pattern is synthesized in [48], including independent studies on hawksbill turtles [49], the crown of thorns starfish Acanthaster plancii [50], two reef fish species - the peacock hind (Cephalopholis argus [51]) and brown surgeonfish (Acanthurus nigrofuscus [52]), and the coconut crab Birgus…”
BackgroundMarine shelf habitat: biogeography and evolution
Briggs, J. C., & Bowen, B. W. (2013) · Journal of Biogeography · doi:10.1111/jbi.12082 · Cited by 211
“In other cases, ancient evolutionary partitions are apparent for fishes (McMillan & Palumbi, 1995; Read et al., 2006; Gaither et al., 2011a) and invertebrates (Lavery et al., 1996; Lessios et al., 2001; Kirkendale & Meyer, 2004).”
BackgroundSelf-citationGaither, M. R., & Rocha, L. A. (2013) · Journal of Biogeography · doi:10.1111/jbi.12126 · Cited by 200
Self-citationSheppard, C. R. C., Ateweberhan, M., Bowen, B. W., Carr, P., Chen, C., Clubbe, C. P., Craig, M. T., Ebinghaus, R., Eble, J. A., FitzSimmons, N. N., et al. (2012) · Aquatic Conservation Marine and Freshwater Ecosystems · doi:10.1002/aqc.1248 · Cited by 182
“Genetic surveys of reef fish species (Eble et al., 2011; Gaither et al., 2011) show an affinity with the western Indian Ocean.”
BackgroundSelf-citationCowman, P. F., & Bellwood, D. R. (2013) · Proceedings of the Royal Society B Biological Sciences · doi:10.1098/rspb.2013.1541 · Cited by 166
“population studies across the two regions, with temporal clades containing haplotypes from both regions [43,66].”
BackgroundAfter continents divide: comparative phylogeography of reef fishes from theRedSea andIndianOcean
DiBattista, J. D., Berumen, M. L., Gaither, M. R., Rocha, L. A., Eble, J. A., Choat, J. H., Craig, M. T., Skillings, D. J., & Bowen, B. W. (2013) · Journal of Biogeography · doi:10.1111/jbi.12068 · Cited by 125
“These species were chosen because they have wide Indo-Pacific distributions, are abundant, represent a diversity of taxonomic families, and can be unequivocally identified in the field.”
BackgroundInfluentialSelf-citationCompetitive exclusion: phylogeography’s ‘elephant in the room’?
Waters, J. M. (2011) · Molecular Ecology · doi:10.1111/j.1365-294x.2011.05286.x · Cited by 108
“For instance, numerous tropical marine taxa exhibit strong phylogeographic disjunction across the ‘Indo-Pacific Barrier’ (IBP), despite the lack of a contemporary physical barrier across this region (Benzie 1999; Barber et al. 2000, 2002b; Hobbs et al. 2009; Gaither et al. 2011).”
BackgroundFishes that rule the world: circumtropical distributions revisited
Gaither, M. R., Bowen, B. W., Rocha, L. A., & Briggs, J. C. (2015) · Fish and Fisheries · doi:10.1111/faf.12136 · Cited by 100
Self-citationGaither, M. R., Jones, S. A., Kelley, C., Newman, S. J., Sorenson, L., & Bowen, B. W. (2011) · PLoS ONE · doi:10.1371/journal.pone.0028913 · Cited by 97
“[4], [6], [71].”
Self-citationWee, A. K. S., Takayama, K., Asakawa, T., Thompson, B., Onrizal, O., Sungkaew, S., Tung, N. X., Nazre, M., Soe, K. K., Tan, H. T. W., et al. (2014) · Journal of Biogeography · doi:10.1111/jbi.12263 · Cited by 89
“…associated with land barriers that are similar to marine fauna – for example across the Central American Isthmus (CAI) land barrier (Dodd et al., 2002; Lessios, 2008) and the Indo-Pacific barrier (Barber et al., 2000; Tan et al., 2005; Su et al., 2007; Huang et al., 2008; Gaither et al., 2011).”
BackgroundDiBattista, J. D., Rocha, L. A., Craig, M. T., Feldheim, K. A., & Bowen, B. W. (2012) · Journal of Heredity · doi:10.1093/jhered/ess056 · Cited by 79
“…r = 0.030 p = 0.44 Muths et al. 2011 Crimson Jobfish (Pristipomoides filamentosus) Cyt b 11 10 out of 45 10 out of 45 479/417 r = 0.63 p < 0.001 Gaither et al. 2011b Black-spot sea bream (Pagellus bogaraveo) D-loop 10 5 out of 10 1 out of 10 350/350 r = 0.12 p = 0.38 Stockley et al. 2005…”
BackgroundInfluentialSelf-citationThe evolutionary history and global phylogeography of the green turtle ( Chelonia mydas )
Jensen, M. P., FitzSimmons, N. N., Bourjea, J., Hamabata, T., Reece, J. S., & Dutton, P. H. (2019) · Journal of Biogeography · doi:10.1111/jbi.13483 · Cited by 75
“The climatic fluctuations during the Pleistocene affected sea levels, sea temperature and shoreline configuration and would have impacted the distribution of green turtles and other marine organisms (e.g. Amaral et al., 2012; Blair et al., 2014; Gaither et al., 2011).”
BackgroundThe changing dynamics of coral reef science in Arabia
Vaughan, G. O., & Burt, J. A. (2015) · Marine Pollution Bulletin · doi:10.1016/j.marpolbul.2015.10.052 · Cited by 66
Keyse, J., Crandall, E. D., Toonen, R. J., Meyer, C., Treml, E. A., & Riginos, C. (2013) · Bulletin of Marine Science · doi:10.5343/bms.2012.1107 · Cited by 65
Lord, C., Lorion, J., Dettaı̈, A., Watanabe, S., Tsukamoto, K., Cruaud, C., & Keith, P. (2012) · Marine Ecology Progress Series · doi:10.3354/meps09617 · Cited by 63
“This is, for example, the case for many fish (Briggs 1974, Planes & Fauvelot 2002, Bay et al. 2004, Craig et al. 2007, Gaither et al. 2010, 2011, Winters et al. 2010) and invertebrates (Lavery et al. 1995, 1996, Lessios et al. 2001, 2003, Barber et al. 2002) across the Indo-Malay archipelago,…”
BackgroundThe historical biogeography of groupers: Clade diversification patterns and processes
Ma, K. Y., Craig, M. T., Choat, J. H., & van Herwerden, L. (2016) · Molecular Phylogenetics and Evolution · doi:10.1016/j.ympev.2016.02.012 · Cited by 66
Self-citationTenggardjaja, K. A., Bowen, B. W., & Bernardi, G. (2014) · PLoS ONE · doi:10.1371/journal.pone.0115493 · Cited by 61
“[17, 32, 54, 55] revealed little genetic structure within the Hawaiian Archipelago, but these are not really equivalent comparisons for C.”
BackgroundSelf-citationWhitney, N. M., Robbins, W. D., Schultz, J. K., Bowen, B. W., & Holland, K. N. (2011) · Journal of Biogeography · doi:10.1111/j.1365-2699.2011.02660.x · Cited by 64
“Many reef fishes exhibit strong genetic structure across this barrier (e.g. Nelson et al., 2000; Lourie & Vincent, 2004; Craig et al., 2007; Gaither et al., 2010, 2011), whereas oceanic species often do not (Castro et al., 2007; Theisen et al., 2008).”
BackgroundSelf-citationCheng, S. H., Anderson, F. E., Bergman, A. M., Mahardika, G. N., Muchlisin, Z. A., Dang, B. T., Calumpong, H. P., Mohamed, K. S., Sasikumar, G., VENKATESAN, V., et al. (2013) · Hydrobiologia · doi:10.1007/s10750-013-1778-0 · Cited by 55
“…seastars (Williams & Benzie, 1997), pelagic fishes (Fauvelot & Borsa, 2011), benthic crustaceans (Barber & Boyce, 2006; Barber et al., 2006, 2011), and neritic reef fishes (Planes & Fauvelot, 2002; Ovendon et al., 2004; Gaither et al., 2009, 2011), indicate a potential for many more cryptic taxa.”
BackgroundPatterns and drivers of species diversity in the Indo‐Pacific red seaweed Portieria
Leliaert, F., Payo, D. A., Gurgel, C. F. D., Schils, T., Draisma, S. G. A., Saunders, G. W., Kamiya, M., Sherwood, A. R., Lin, S., Huisman, J. M., et al. (2018) · Journal of Biogeography · doi:10.1111/jbi.13410 · Cited by 54
“…Palumbi, 2006; Carpenter & Springer, 2005; Tornabene, Valdez, Erdmann, & Pezold, 2015; Ukuwela et al., 2016), centre of accumulation (e.g., Drew & Barber, 2009; Eble et al., 2011; Hodge, Read, van Herwerden, & Bellwood, 2012), and region of overlap (e.g., Gaither et al., 2011; Hubert et al., 2012).”
BackgroundObura, D. O. (2015) · Journal of Biogeography · doi:10.1111/jbi.12656 · Cited by 51
“…species within what were previously thought to be Indo-Pacific-wide species of corals (Y. Chuang, unpublished data; Stefani et al., 2011) and fish (Gaither et al., 2011; Eble et al., 2011), as well as further splitting within the Indian Ocean of iconic taxa such as the coral Stylophora pistillata…”
BackgroundComparative phylogeography of the western Indian Ocean reef fauna
Borsa, P., Durand, J.-D., Chen, W., Hubert, N., Muths, D., Mou-Tham, G., & Kulbicki, M. (2015) · Acta Oecologica · doi:10.1016/j.actao.2015.10.009 · Cited by 51
Hodge, J. R., & Bellwood, D. R. (2016) · Journal of Biogeography · doi:10.1111/jbi.12729 · Cited by 50
“While such records remain elusive, phylogeographical data may provide insights into processes of genetic isolation preceding species divergence (e.g. Gaither et al., 2011a; Tornabene et al., 2015).”
BackgroundWaqairatu, S. S., Dierens, L., Cowley, J. A., Dixon, T. J., Johnson, K. N., Barnes, A. C., & Li, Y. (2012) · Ecology and Evolution · doi:10.1002/ece3.316 · Cited by 48
“…Indo-Pacific distributed species that now display a wide variety of population structures, yet all share the impact of Pliocene/Pleistocene glacial cycles (Imron et al. 2007; Dubey et al. 2010; Pavlova et al. 2010; Ravago-Gotanco and Juinio-Menez 2010; Winters et al. 2010 and Gaither et al. 2011).”
BackgroundHirai, J., Tsuda, A., & Goetze, E. (2015) · Progress In Oceanography · doi:10.1016/j.pocean.2015.09.002 · Cited by 47
Li, X., Duke, N. C., Yang, Y., Huang, L., Zhu, Y., Zhang, Z., Zhou, R., Zhong, C., Huang, Y., & Shi, S. (2016) · PLoS ONE · doi:10.1371/journal.pone.0164453 · Cited by 48
Toms, J. A., Compton, J. S., Smale, M. J., & von der Heyden, S. (2014) · Biology Letters · doi:10.1098/rsbl.2014.0330 · Cited by 48
Ackiss, A. S., Pardede, S., Crandall, E. D., Lagman, M. C. A., Ambariyanto, A., Romena, N. A., Barber, P. H., & Carpenter, K. E. (2013) · Marine Ecology Progress Series · doi:10.3354/meps10199 · Cited by 45
Population structure in the native range predicts the spread of introduced marine species
Gaither, M. R., Bowen, B. W., & Toonen, R. J. (2013) · Proceedings of the Royal Society B Biological Sciences · doi:10.1098/rspb.2013.0409 · Cited by 44
“Cephalopholis argus demonstrated an intermediate pattern [31].”
Self-citationDrew, J., & Barber, P. H. (2012) · PLoS ONE · doi:10.1371/journal.pone.0047710 · Cited by 44
“Previous studies that have assessed gene flow among reef fish population within Pacific Islands archipelagos have found substantial exchange within island groups [25–29], with only a few exceptions [30,31].”
BackgroundReid, K., Hoareau, T. B., Graves, J. E., Potts, W. M., Santos, S., Klopper, A. W., & Bloomer, P. (2016) · Heredity · doi:10.1038/hdy.2016.51 · Cited by 42
Natural Products Repertoire of the Red Sea
El‐Hossary, E. M., Abdel‐Halim, M., Ibrahim, E. S., Pimentel‐Elardo, S. M., Nodwell, J. R., Handoussa, H., Abdelwahab, M. F., Holzgrabe, U., & Abdelmohsen, U. R. (2020) · Marine Drugs · doi:10.3390/md18090457 · Cited by 43
Iacchei, M. J., Gaither, M. R., Bowen, B. W., & Toonen, R. J. (2016) · Journal of Biogeography · doi:10.1111/jbi.12689 · Cited by 41
Self-citationMessmer, V., Jones, G. P., Munday, P. L., & Planes, S. (2012) · Evolution · doi:10.1111/j.1558-5646.2012.01725.x · Cited by 41
Ludt, W. B., Bernal, M. A., Bowen, B. W., & Rocha, L. A. (2012) · PLoS ONE · doi:10.1371/journal.pone.0038042 · Cited by 40
“This pattern is consistent with previous findings where species ranges may have been sundered during sea level lows and then subsequently reconnected [8,39,40].”
ResultSelf-citationQu, M., Tang, W., Liu, Q., Wang, D., & Ding, S. (2017) · Molecular Phylogenetics and Evolution · doi:10.1016/j.ympev.2017.12.031 · Cited by 40
Waldrop, E., Hobbs, J., Randall, J. E., DiBattista, J. D., Rocha, L. A., Kosaki, R. K., Berumen, M. L., & Bowen, B. W. (2016) · Journal of Biogeography · doi:10.1111/jbi.12680 · Cited by 39
“Population differentiation between Hawai’i and other Pacific locations has been reported in many other reef fishes (Leray et al., 2010; DiBattista et al., 2011; Gaither et al., 2011; Szabo et al., 2014; Fernandez-Silva et al., 2015).”
BackgroundSelf-citationO’Brien, S. M., Gallucci, V. F., & Hauser, L. (2012) · Conservation Genetics · doi:10.1007/s10592-012-0437-8 · Cited by 38
“Keywords Chondrichthyes Bayesian demographic reconstruction Mismatch analysis Mitochondrial DNA Climate change”
Ahti, P. A., Coleman, R. R., DiBattista, J. D., Berumen, M. L., Rocha, L. A., & Bowen, B. W. (2016) · Journal of Biogeography · doi:10.1111/jbi.12712 · Cited by 39
Self-citationAndrews, K. R., Moriwake, V. N., Wilcox, C. L., Grau, E. G., Kelley, C., Pyle, R. L., & Bowen, B. W. (2014) · PLoS ONE · doi:10.1371/journal.pone.0091665 · Cited by 36
Self-citationPedrosa‐Gerasmio, I. R., Agmata, A. B., & Santos, M. D. (2014) · Fisheries Research · doi:10.1016/j.fishres.2014.10.006 · Cited by 36
O’Toole, A. C., Bottein, M. D., Danylchuk, A. J., Ramsdell, J. S., & Cooke, S. J. (2012) · The Science of The Total Environment · doi:10.1016/j.scitotenv.2011.11.053 · Cited by 35
Takeuchi, T., Masaoka, T., Aoki, H., Koyanagi, R., Fujie, M., & Satoh, N. (2019) · Evolutionary Applications · doi:10.1111/eva.12905 · Cited by 35
“The appearance of this land mass severed the genetic connection between Indian and Pacific marine populations with long-lived pelagic larvae, such as starfish and reef fish species (Benzie, 1999; Gaither et al., 2011).”
BackgroundSandoval-Huerta, E. R., Beltrán‐López, R. G., Pedraza-Marrón, C. D. R., Paz-Velásquez, M. A., Angulo, A., Robertson, D. R., Espinoza, E., & Domínguez‐Domínguez, O. (2018) · Molecular Phylogenetics and Evolution · doi:10.1016/j.ympev.2018.10.020 · Cited by 33
Gaither, M. R., Toonen, R. J., & Bowen, B. W. (2012) · Proceedings of the Royal Society B Biological Sciences · doi:10.1098/rspb.2012.1481 · Cited by 33
Self-citationEvolutionary biogeography of the reef-building coral genus Galaxea across the Indo-Pacific ocean
Wepfer, P. H., Nakajima, Y., Sutthacheep, M., Radice, V. Z., Richards, Z. T., Ang, P. O., Terraneo, T. I., Sudek, M., Fujimura, A. G., Toonen, R. J., et al. (2020) · Molecular Phylogenetics and Evolution · doi:10.1016/j.ympev.2020.106905 · Cited by 33
Castelin, M., Feutry, P., Hautecœur, M., Marquet, G., Wowor, D., Zimmermann, G., & Keith, P. (2013) · Marine Biology · doi:10.1007/s00227-013-2191-y · Cited by 32
“…separating biogeographical provinces can sporadically shape species distributions and intraspecific genetic structure over time, mainly acting on species displaying dispersal potential through the marine environment (e.g., Planes and Fauvelot 2002; Gaither et al. 2010, 2011; Lord et al. 2012).”
BackgroundBorsa, P., Arlyza, I. S., Laporte, M., & Berrebi, P. (2012) · Journal of Experimental Marine Biology and Ecology · doi:10.1016/j.jembe.2012.09.010 · Cited by 31
“…12 N Atlantic 5 140 0.012 (0.037) McCusker and Bentzen (2010) Cephalopholis argus Peacock grouper introns 2 Indo-West Pacific 18 970 0.089 (0.496) Gaither et al. (2011) Decapterus macrosoma Round scad mackerel intron 1 Indo-Malay archipelago 3 490 0.005 (0.100) Borsa (2003) Decapterus russelli…”
InfluentialColeman, R. R., Eble, J. A., DiBattista, J. D., Rocha, L. A., Randall, J. E., Berumen, M. L., & Bowen, B. W. (2016) · Molecular Phylogenetics and Evolution · doi:10.1016/j.ympev.2016.04.005 · Cited by 30
Self-citationHubert, N., Dettaı̈, A., Pruvost, P., Cruaud, C., Kulbicki, M., Myers, R.-F., & Borsa, P. (2017) · Marine Ecology Progress Series · doi:10.3354/meps12316 · Cited by 29
“…results have direct implications for the understanding of the evolutionary dynamics at play in coral reef fishes, particularly in a context of divergent interpretations about the origin of biodiversity patterns (Mora et al. 2003, Hubert et al. 2012, Gaither & Rocha 2013, Tornabene et al. 2015).”
BackgroundHybridisation among coral reef fishes at Christmas Island and the Cocos (Keeling) Islands
Hobbs, J., & Allen, G. R. (2014) · eSpace (Curtin University) · doi:10.5281/zenodo.20249681 · Cited by 28
Liu, S. V., Chang, F.-T., Borsa, P., Chen, W., & Dai, C. (2014) · Biological Journal of the Linnean Society · doi:10.1111/bij.12378 · Cited by 25
Ma, K. Y., van Herwerden, L., Newman, S. J., Berumen, M. L., Choat, J. H., Chu, K. H., & de Mitcheson, Y. S. (2018) · BMC Evolutionary Biology · doi:10.1186/s12862-018-1284-0 · Cited by 30
“In fact, such patterns of extensive population connectivity across the wide range of the WIP with isolation at the eastern margin of the Pacific range is frequently detected in reef fishes, such as the peacock grouper [75], the brown surgeonfish [80], the bluestriped snapper [79], and the flame angelfish [81].”
BackgroundSelf-citationLiggins, L., Booth, D. J., Figueira, W. F., Treml, E. A., Tonk, L., Ridgway, T. M., Harris, D. A., & Riginos, C. (2015) · Ecography · doi:10.1111/ecog.01398 · Cited by 27
Gaboriau, T., Leprieur, F., Mouillot, D., & Hubert, N. (2017) · Ecography · doi:10.1111/ecog.02589 · Cited by 24
Gray, H. W. I., Nishida, S., Welch, A. J., Moura, A. E., Tanabe, S., Kiani, M. S., Culloch, R. M., Möller, L. M., Natoli, A., Ponnampalam, L. S., et al. (2017) · Molecular Phylogenetics and Evolution · doi:10.1016/j.ympev.2017.12.027 · Cited by 26
“reef fish (Bay et al., 2004; Gaither et al., 2011; Hubert et al., 2012), gastropods (Crandall et al.”
BackgroundSimon, T., Pinheiro, H. T., Santos, S., Macieira, R. M., Ferreira, Y. S. S., Bernardi, G., Rocha, L. A., Floeter, S. R., Ferreira, C. E. L., & Joyeux, J. (2021) · Coral Reefs · doi:10.1007/s00338-021-02178-8 · Cited by 26
Self-citationHorne, J. B., & van Herwerden, L. (2013) · Journal of Evolutionary Biology · doi:10.1111/jeb.12092 · Cited by 26
Freshwater neritids (Mollusca: Gastropoda) of tropical islands: amphidromy as a life cycle, a review
Abdou, A., Keith, P., & Galzin, R. (2015) · Revue d Écologie (La Terre et La Vie) · doi:10.3406/revec.2015.1799 · Cited by 26
“These barriers mainly act on species displaying dispersal potential through the marine environment as larvae, juveniles or adults (Gaither et al., 2010, 2011).”
BackgroundDohna, T. A., Timm, J., Hamid, L., & Kochzius, M. (2015) · Ecology and Evolution · doi:10.1002/ece3.1455 · Cited by 25
Ukuwela, K. D. B., Lee, M. S. Y., Rasmussen, A. R., de Silva, A., Mumpuni, Fry, B. G., Ghezellou, P., Rezaie‐Atagholipour, M., & Sanders, K. L. (2015) · Journal of Biogeography · doi:10.1111/jbi.12636 · Cited by 26
Liu, S., Dai, C., Allen, G., & Erdmann, M. (2012) · Marine Ecology Progress Series · doi:10.3354/meps09648 · Cited by 24
Stern, N., Rinkevich, B., & Goren, M. (2016) · Journal of Fish Biology · doi:10.1111/jfb.13114 · Cited by 23
Banerjee, A. K., Guo, W., Qiao, S., Li, W., Xing, F., Lin, Y., Hou, Z., Li, S., Liu, Y., & Huang, Y. (2020) · Ecology and Evolution · doi:10.1002/ece3.6460 · Cited by 23
“…literatures which identified Pleistocene glacial vicariance as one of the important phylogeographic forces shaping the current distribution pattern of many mangroves (e.g., Duke et al., 2002; Urashi et al., 2013; Yang et al., 2017) and other marine species (e.g., Gaither et al., 2011) in the IWP.”
Menchaca, A., Arteaga, M. C., Medellín, R. A., & Jones, G. (2020) · Global Ecology and Conservation · doi:10.1016/j.gecco.2020.e01164 · Cited by 23
Mennesson, M. I., Bonillo, C., Feunteun, É., & Keith, P. (2018) · Conservation Genetics · doi:10.1007/s10592-018-1063-x · Cited by 21
Green turtles (Chelonia mydas) of the north‐western Arabian Gulf, Kuwait: the need for conservation
Al‐Mohanna, S. Y., Al-Zaidan, A. S. Y., & George, P. (2013) · Aquatic Conservation Marine and Freshwater Ecosystems · doi:10.1002/aqc.2371 · Cited by 20
Alam, M. M. M., de Croos, M. D. S. T., & Pálsson, S. (2016) · Marine Ecology · doi:10.1111/maec.12406 · Cited by 19
Matias, A. M. A., & Riginos, C. (2018) · Journal of Biogeography · doi:10.1111/jbi.13376 · Cited by 19
Daly‐Engel, T. S., Randall, J. E., & Bowen, B. W. (2012) · Marine Biology · doi:10.1007/s00227-012-1878-9 · Cited by 19
Self-citationGonzález, C. E., Goetze, E., Escribano, R., Ulloa, O., & Victoriano, P. F. (2020) · Scientific Reports · doi:10.1038/s41598-019-56935-5 · Cited by 18
Rodríguez‐Flores, P. C., Buckley, D., Macpherson, E., Corbari, L., & Machordom, A. (2020) · Zoologica Scripta · doi:10.1111/zsc.12414 · Cited by 18
“Moreover, geographic isolation due to drastic changes in sea level (for instance, after the climatic changes in the Late Pleistocene) could have had a greater impact on reef fauna (Gaither et al., 2011) than on deep-sea fauna, in which processes related to water chemistry, temperature, nutrients and dispersal method m…”
BackgroundWhite, K. N., Reimer, J. D., & Lorion, J. (2015) · Systematics and Biodiversity · doi:10.1080/14772000.2015.1078856 · Cited by 18
Rosly, H. A.-A. M., Nor, S. A. M., Yahya, K., & Naim, D. M. (2013) · Molecular Biology Reports · doi:10.1007/s11033-013-2755-4 · Cited by 18
Wong, L. L., Chun, L. C., Deris, Z. M., Zainudin, A. A., Ikhwanuddin, M., Iehata, S., Rahman, M. M., & Asaduzzaman, M. (2021) · Gene Reports · doi:10.1016/j.genrep.2021.101047 · Cited by 17
Alam, M. M. M., Westfall, K. M., & Pálsson, S. (2015) · Hydrobiologia · doi:10.1007/s10750-015-2381-3 · Cited by 17
“Several marine species in the Indo-West Pacific region are characterized by distinct eastern and western genetic lineages (Gaither et al., 2001; Keyse et al., 2014), including P. monodon (Benzie et al., 2002) and Fenneropenaeus indicus (Milne-Edwards, 1837; Alam et al., 2015).”
BackgroundTenggardjaja, K. A., Bowen, B. W., & Bernardi, G. (2016) · Journal of Marine Biology · doi:10.1155/2016/3251814 · Cited by 17
“In contrast, the widespread grouper Cephalopholis argus showed no population structure from the central Pacific (Line Islands) to northeastern Australia, a distance of about 8000 km [63].”
BackgroundSelf-citationYusoff, N. I. S. M., Jaafar, T. N. A. M., Vilasri, V., Nor, S. A. M., Seah, Y. G., Habib, A., Wong, L. L., Danish‐Daniel, M., Sung, Y. Y., Mazlan, A. G., et al. (2021) · Scientific Reports · doi:10.1038/s41598-021-92905-6 · Cited by 16
Kundu, S., Kang, H., Kim, A., Lee, S. R., Kim, E.-B., Amin, M. H. F., Andriyono, S., Kim, H., & Kang, K. (2024) · International Journal of Molecular Sciences · doi:10.3390/ijms25031822 · Cited by 16
“…species have primarily addressed aspects such as physiology and reproductive life history [18,19], ge-netic connectivity, phylogeography, evolutionary implications through Pleistocene isolation [20,21], and the assembly of chromosome-level genomes alongside transcriptome comparisons [22].”
BackgroundChloroplast DNA phylogeography of the Holly mangrove Acanthus ilicifolius in the Indo-West Pacific
Guo, W., Banerjee, A. K., Ng, W. L., Yuan, Y., Li, W., & Huang, Y. (2020) · Hydrobiologia · doi:10.1007/s10750-020-04372-1 · Cited by 16
“Similar implications have been made in studies on marine fauna in the region (Benzie, 1999; Barber et al., 2000; Gaither et al., 2011).”
BackgroundSheppard, C. R. C., Bowen, B. W., Chen, A. C., Craig, M. T., Eble, J. A., FitzSimmons, N. N., Gan, C.-H., Gaither, M. R., Gollock, M. J., Keshavmurthy, S., et al. (2013) · Coral reefs of the world · doi:10.1007/978-94-007-5965-7_17 · Cited by 15
Self-citationSwart, B., der Merwe, A. E. B., Kerwath, S., & Roodt‐Wilding, R. (2016) · African Journal of Marine Science · doi:10.2989/1814232x.2016.1238410 · Cited by 15
“…and dynamic pattern of population colonisation and expansion within and between oceans and ocean basins (e.g. Pacific Sierra mackerel Scomberomorus sierra [López et al. 2010]; dolphinfish Coryphaena hippurus [Díaz-Jaimes et al. 2010]; peacock grouper Cephalopholus argus [Gaither et al. 2011]).”
BackgroundYamamoto, T., Tsuda, Y., Takayama, K., Nagashima, R., Tateishi, Y., & Kajita, T. (2019) · Ecology and Evolution · doi:10.1002/ece3.5099 · Cited by 15
“…patterns of phylogeographic structure and genetic diversity in sev‐ eral mangroves (Duke et al., 2002; Huang et al., 2012; Urashi et al., 2013) and other marine species (Alfaro, Karns, Voris, Abernathy, & Sellins, 2004; Gaither et al., 2011) distributed in the Indo‐West Pacific (IWP) region.”
BackgroundPhylogeography of Blue Corals (Genus Heliopora) Across the Indo-West Pacific
Taninaka, H., Maggioni, D., Seveso, D., Huang, D., Townsend, A., Richards, Z. T., Tang, S., Wada, N., Kikuchi, T., Yuasa, H., et al. (2021) · Frontiers in Marine Science · doi:10.3389/fmars.2021.714662 · Cited by 16
Xie, Z., Wang, D., Jiang, S., Peng, C. Y., Wang, Q., Huang, C., Li, S., Lin, H., & Zhang, Y. (2022) · Biology · doi:10.3390/biology11071053 · Cited by 14
“Previous studies of the genus Cephalopholis have focused on fishery management, species conservation [10], behavioral biology [4], nutritional biology [11], and phylogeography [12].”
BackgroundDemographic histories shape population genomics of the common coral grouper (Plectropomus leopardus)
Payet, S. D., Pratchett, M. S., Saenz‐Agudelo, P., Berumen, M. L., DiBattista, J. D., & Harrison, H. B. (2022) · Evolutionary Applications · doi:10.1111/eva.13450 · Cited by 14
“…glacial periods have modified the distribution of shallow coral reef habitat over the last several hundred thousand years, leading to the formation and regression of physical barriers and periods of isolation often followed by secondary contact (e.g., Gaither et al., 2011; Rocha et al., 2007).”
BackgroundDurand, J.-D., Pham, H. M., Tran, T. T. V., Hoang, H. D., & Vo, Q. V. (2020) · Marine Biodiversity · doi:10.1007/s12526-020-01051-1 · Cited by 14
Klanten, O. S., Gaither, M. R., Greaves, S. E., Mills, K., O’Keeffe, K., Turnbull, J., McKinnon, R., & Booth, D. J. (2020) · PLoS ONE · doi:10.1371/journal.pone.0243446 · Cited by 14
Self-citationDiBattista, J. D., Randall, J. E., Newman, S. J., & Bowen, B. W. (2014) · Marine Biology · doi:10.1007/s00227-014-2516-5 · Cited by 14
Self-citationPayet, S. D., Hobbs, J., DiBattista, J. D., Newman, S. J., Sinclair‐Taylor, T. H., Berumen, M. L., & McIlwain, J. L. (2016) · Coral Reefs · doi:10.1007/s00338-016-1482-4 · Cited by 14
“…following secondary contact at the Cocos Islands and Christmas Island may have led to introgression and ‘‘mixing’’ of genes beyond the hybrid zone, as reported in other reef fishes (McMillan et al. 1999; Gaither et al. 2011), albeit not at the same spatial scale described here (i.e., 9000 km).”
BackgroundSelf-citationKennington, W. J., Keron, P. W., Harvey, E. S., Wakefield, C. B., Williams, A. J., Halafihi, T., & Newman, S. J. (2017) · Fisheries Research · doi:10.1016/j.fishres.2017.04.015 · Cited by 14
Self-citationHow the Central American Seaway and an Ancient Northern Passage Affected Flatfish Diversification
Byrne, L., Chapleau, F., & Aris‐Brosou, S. (2018) · Molecular Biology and Evolution · doi:10.1093/molbev/msy104 · Cited by 14
Simmonds, S. E., Fritts-Penniman, A. L., Cheng, S. H., Mahardika, G. N., & Barber, P. H. (2020) · Ecology and Evolution · doi:10.1002/ece3.5977 · Cited by 14
“…of marine biodiversity, there is a large and diverse literature on the processes shaping the Coral Triangle (Barber, Erdmann, & Palumbi, 2006; Bowen et al., 2013; Carpenter et al., 2011; Gaither et al., 2011; Hoeksema, 2007; Kochzius & Nuryanto, 2008; Tornabene, Valdez, Erdmann, & Pezold, 2015).”
BackgroundPalmerín‐Serrano, P. N., Tavera, J. J., Espinoza, E., Angulo, A., Martínez‐Gómez, J. E., González‐Acosta, A. F., & Domínguez‐Domínguez, O. (2020) · Journal of Zoological Systematics & Evolutionary Research · doi:10.1111/jzs.12392 · Cited by 14
Metadata
- Authors
- Gaither, M. R., Bowen, B. W., Bordenave, T.-R., Rocha, L. A., Newman, S. J., Gomez, J. A., van Herwerden, L., & Craig, M. T.
- Affiliations
- University of Hawaii System (US)
- University of Hawaiʻi at Mānoa (US)
- California Academy of Sciences (US)
- Government of Western Australia (AU)
- James Cook University (AU)
- University of Puerto Rico-Mayaguez (PR)
- Corresponding author
- Gaither, Michelle R
- ORCID
- Venue
- BMC Evolutionary Biology
- Published
- 2011-07-01
- Volume
- 11
- Issue
- 1
- Pages
- 189-189
- ISSN
- 1471-2148 (ISSN-L)
- PMC
- PMC3145601
- OpenAlex
- W1989413030
- Cited by
- 191
- References
- 110
- Citations by year
- 2026: 12 · 2025: 12 · 2024: 11 · 2023: 5 · 2022: 11 · 2021: 13 · 2020: 15 · 2019: 9 · 2018: 14 · 2017: 8 · 2016: 16 · 2015: 14 · 2014: 12 · 2013: 17 · 2012: 17
- FWCI
- 9.98
- Type
- journal article
- Language
- en
- Open access
- gold
- doi.org
- Licence
- Locations
- BMC Evolutionary Biology (publishedVersion, cc-by)
- Europe PMC (PubMed Central) (publishedVersion, cc-by)
- PubMed Central (publishedVersion, cc-by)
- PubMed (publishedVersion)
- ResearchOnline at James Cook University (James Cook University) (submittedVersion)
- DOAJ (DOAJ: Directory of Open Access Journals) (submittedVersion, cc-by-sa)
- eSpace (Curtin University) (submittedVersion)
- Funders
- National Science Foundation (2005-008/66882, 0554657, OCE#09‐29031, 8208-07, 0929031, 0453167)
- U.S. Department of Commerce
- National Geographic Society (0453167, 0929031, 8208-07)
- Nature Conservancy
- National Oceanic and Atmospheric Administration (09-29031, 2005-008/66882, OCE-0929031, 0453167, NA09OAR4170060)
- U.S. Fish and Wildlife Service
- Hawai'i Sea Grant, University of Hawai'i (NA09OAR4170060, 2005-008/66882)
- Topics
- Life Sciences › Biochemistry, Genetics and Molecular Biology › Genetics › Genetic diversity and population structure
- Physical Sciences › Environmental Science › Ecology › Coral and Marine Ecosystems Studies
- Life Sciences › Agricultural and Biological Sciences › Aquatic Science › Fish Biology and Ecology Studies
- Keywords
- Cephalopholis argus, phylogeography, Pleistocene isolation, Coral Triangle, reef fish, population structure, isolation by distance, population growth, introgression, center of origin, Epinephelidae, cytochrome b, nuclear introns
- MeSH terms
- Animals, Bass, DNA, Mitochondrial, Molecular Sequence Data, Pacific Ocean, Phylogeny, Evolution, Molecular, Indian Ocean, Animal Migration, Fish Proteins, Phylogeography
About these checks
Registry, retraction, Cites and statistics results are computed, not judged, with one exception: a printed reference that no index lists is read once by a model before it counts as a citation error. Claims are extracted by a model and kept only when their quote appears verbatim in the text; each cited source is then checked, with a model’s help, for whether it says what the claim relies on. Those verdicts can be wrong — read the claim’s quote and the cited source before relying on one.
Statistics and arithmetic are recomputed, not judged.
Confidence bands are shown only for fields calibrated on our annotated test set. None is calibrated yet, so no band is shown.
What counts as a claim ›How we measure confidence ›How we check this ›
Are you an author, or do you see a problem with this page? Request a review
