

The DOI matches its Crossref record; 31 of the 33 references it cites were found in a registry or an index, and 1 are not checked yet.
Comparative 454 pyrosequencing of transcripts from two olive genotypes during fruit development
Open accessAbstract
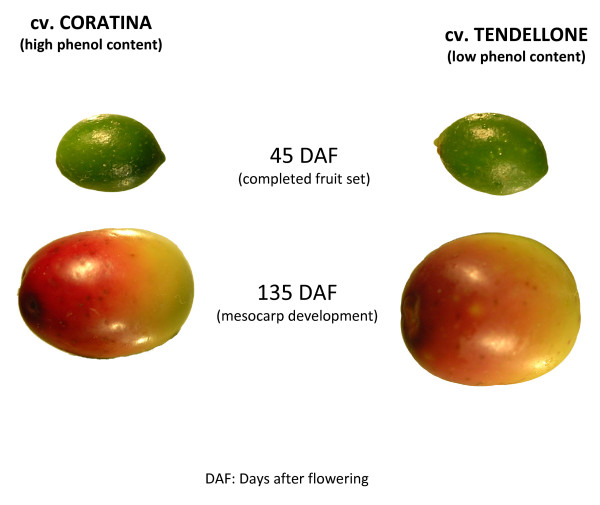
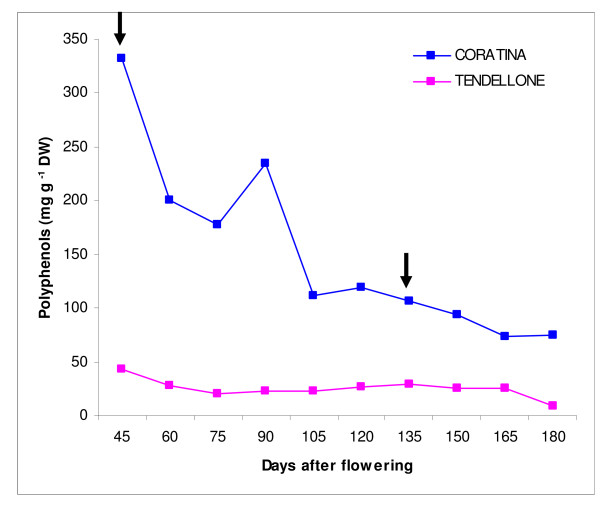
Background: Despite its primary economic importance, genomic information on olive tree is still lacking. 454 pyrosequencing was used to enrich the very few sequence data currently available for the Olea europaea species and to identify genes involved in expression of fruit quality traits. Results: Fruits of Coratina, a widely cultivated variety characterized by a very high phenolic content, and Tendellone, an oleuropein-lacking natural variant, were used as starting material for monitoring the transcriptome. Four different cDNA libraries were sequenced, respectively at the beginning and at the end of drupe development. A total of 261,485 reads were obtained, for an output of about 58 Mb. Raw sequence data were processed using a four step pipeline procedure and data were stored in a relational database with a web interface. Conclusion: Massively parallel sequencing of different fruit cDNA collections has provided large scale information about the structure and putative function of gene transcripts accumulated during fruit development. Comparative transcript profiling allowed the identification of differentially expressed genes with potential relevance in regulating the fruit metabolism and phenolic content during ripening.
Overview
The claims and statistics of this paper haven’t been checked yet.
Free: it reads the open-access text and checks the first 5 claims that cite a source we can check. Create a free account to check every claim.
Integrity signals
Registry
Cites
Statistics
Figures



Verification
Claims the paper makes
The claims and statistics of this paper haven’t been checked yet.
Free: it reads the open-access text and checks the first 5 claims that cite a source we can check. Create a free account to check every claim.
Claims other papers make about this one
Each is checked against this paper’s own text: does it say what the citing paper says it does?
The cited source says what the claim attributes to it.
In the citing paper
“Due to its long read length and appearance ahead of the other two platforms, Roche GS FLX has been the most widely used platform for de novo transcriptome sequencing in many organisms, such as chestnut [19], pine [10], olive [44], ginseng [20], A. thaliana [45,46], maize [47], Artemisia annua [48], fish [18], insects [49,50], and worms [17].”
Self-check
Percentages, sums and reported differences re-computed from the paper’s own numbers.
The self-check needs the paper’s full text.
Citations
Cites
Gene Ontology: tool for the unification of biology
Ashburner, M., Ball, C. A., Blake, J. A., Botstein, D., Butler, H., Cherry, J. M., Davis, A. P., Dolinski, K., Dwight, S. S., Eppig, J. T., et al. (2000) · Nature Genetics · doi:10.1038/75556 · Cited by 43,206
Genome sequencing in microfabricated high-density picolitre reactors
Margulies, M., Egholm, M., Altman, W. E., Attiya, S., Bader, J. S., Bemben, L. A., Berka, J., Braverman, M. S., Chen, Y.-J., Chen, Z., et al. (2005) · Nature · doi:10.1038/nature03959 · Cited by 7,693
KEGG for linking genomes to life and the environment
Kanehisa, M., Araki, M., Goto, S., Hattori, M., Hirakawa, M., Itoh, M., Katayama, T., Kawashima, S., Okuda, S., Tokimatsu, T., et al. (2007) · Nucleic Acids Research · doi:10.1093/nar/gkm882 · Cited by 6,782
The Universal Protein Resource (UniProt)
Bairoch, A. (2004) · Nucleic Acids Research · doi:10.1093/nar/gki070 · Cited by 3,774
Repbase Update, a database of eukaryotic repetitive elements
Jurka, J., Kapitonov, V. V., Pavlicek, A., Klonowski, P., Kohany, O., & Walichiewicz, J. (2005) · Cytogenetic and Genome Research · doi:10.1159/000084979 · Cited by 3,370
Bairoch, A. (2000) · Nucleic Acids Research · doi:10.1093/nar/28.1.304 · Cited by 1,129
Ibuprofen-like activity in extra-virgin olive oil
Beauchamp, G. K., Keast, R. S. J., Morel, D., Lin, J., Pika, J., Han, Q., Lee, C.-H., Smith, A. B., & Breslin, P. A. S. (2005) · Nature · doi:10.1038/437045a · Cited by 885
The Universal Protein Resource (UniProt)
The UniProt Consortium (2007) · Nucleic Acids Research · doi:10.1093/nar/gkm895 · Cited by 823
(2008) · Nutrition & Food Science · doi:10.1108/nfs.2008.01738aab.008 · Cited by 611
Servili, M., Selvaggini, R., Esposto, S., Taticchi, A., Montedoro, G., & Morozzi, G. (2004) · Journal of Chromatography A · doi:10.1016/j.chroma.2004.08.070 · Cited by 588
Self-citation
Research works printed but not linked: 1
- Sanchez J, Harwood JL: Biosynthesis of triacylglycerols and volatiles in olives. Eur J Lipid Sci Technol. 2002, 104: 564-573. 10.1002/1438-9312(200210)104:9/10<564::AID-EJLT564>3.0.CO;2-5. · doi:10.1002/1438-9312(200210)104:9/10<564::aid-ejlt564>3.0.co;2-5
Cited by
Wang, Z., Fang, B., Chen, J., Zhang, X., Luo, Z., Huang, L., Chen, X., & Li, Y. (2010) · BMC Genomics · doi:10.1186/1471-2164-11-726 · Cited by 433
Comparative deep transcriptional profiling of four developing oilseeds
Troncoso‐Ponce, M. A., Kilaru, A., Cao, X., Durrett, T. P., Fan, J., Jensen, J. K., Thrower, N. A., Pauly, M., Wilkerson, C., & Ohlrogge, J. B. (2011) · The Plant Journal · doi:10.1111/j.1365-313x.2011.04751.x · Cited by 301
Frusciante, S., Diretto, G., Bruno, M., Ferrante, P., Pietrella, M., Prado-Cabrero, A., Rubio-Moraga, A., Beyer, P., Gomez-Gomez, L., Al-Babili, S., et al. (2014) · Proceedings of the National Academy of Sciences · doi:10.1073/pnas.1404629111 · Cited by 300
Self-citationSun, C., Li, Y., Wu, Q., Luo, H., Sun, Y., Song, J., Lui, E. M., & Chen, S. (2010) · BMC Genomics · doi:10.1186/1471-2164-11-262 · Cited by 286
“Using this technology, a number of EST libraries have been successfully constructed from plants, including maize [40], chestnut [41], olive [42], the model plant A.”
Application of Genomic Tools in Plant Breeding
M. Perez-de-Castro, A., Vilanova, S., Canizares, J., Pascual, L., M. Blanca, J., J. Diez, M., Prohens, J., & Pico, B. (2012) · Current Genomics · doi:10.2174/138920212800543084 · Cited by 280
Metadata
- Authors
- Alagna, F., D'Agostino, N., Torchia, L., Servili, M., Rao, R., Pietrella, M., Giuliano, G., Chiusano, M. L., Baldoni, L., & Perrotta, G.
- Affiliations
- National Agency for New Technologies, Energy and Sustainable Economic Development (IT)
- University of Perugia (IT)
- University of Naples Federico II (IT)
- Corresponding author
- Baldoni, Luciana
- Perrotta, Gaetano
- ORCID
- Venue
- BMC Genomics
- Published
- 2009-08-26
- Volume
- 10
- Issue
- 1
- Pages
- 399-399
- ISSN
- 1471-2164 (ISSN-L)
- PMC
- PMC2748093
- OpenAlex
- W2159594972
- Cited by
- 263
- References
- 33
- Citations by year
- 2026: 1 · 2025: 1 · 2024: 7 · 2023: 8 · 2022: 5 · 2021: 13 · 2020: 21 · 2019: 14 · 2018: 13 · 2017: 14 · 2016: 23 · 2015: 28 · 2014: 21 · 2013: 24 · 2012: 30
- FWCI
- 9.40
- Type
- journal article
- Language
- en
- Open access
- gold
- doi.org
- Licence
- cc-by
- Locations
- BMC Genomics (publishedVersion, cc-by)
- PubMed Central (publishedVersion, cc-by)
- PubMed (publishedVersion)
- DOAJ (DOAJ: Directory of Open Access Journals) (submittedVersion, cc-by-sa)
- Topics
- Life Sciences › Biochemistry, Genetics and Molecular Biology › Molecular Biology › Genomics and Phylogenetic Studies
- Life Sciences › Biochemistry, Genetics and Molecular Biology › Genetics › Genetic Mapping and Diversity in Plants and Animals
- Life Sciences › Agricultural and Biological Sciences › Plant Science › Plant Molecular Biology Research
- Keywords
- olive, Olea europaea, fruit development, transcriptome, Coratina, phenolic content, oleuropein, fruit quality, differentially expressed genes, fruit metabolism, cDNA library
- MeSH terms
- Fruit, Genotype, Phenols, User-Computer Interface, Gene Library, Sequence Analysis, DNA, DNA, Complementary, Gene Expression Regulation, Plant, Gene Expression Regulation, Developmental, DNA, Plant, Genome, Plant, Expressed Sequence Tags, Gene Expression Profiling, Databases, Genetic, Olea, Lipid Metabolism, Comparative Genomic Hybridization
About these checks
Registry, retraction, Cites and statistics results are computed, not judged, with one exception: a printed reference that no index lists is read once by a model before it counts as a citation error. Claims are extracted by a model and kept only when their quote appears verbatim in the text; each cited source is then checked, with a model’s help, for whether it says what the claim relies on. Those verdicts can be wrong — read the claim’s quote and the cited source before relying on one.
Statistics and arithmetic are recomputed, not judged.
Confidence bands are shown only for fields calibrated on our annotated test set. None is calibrated yet, so no band is shown.
What counts as a claim ›How we measure confidence ›How we check this ›
Are you an author, or do you see a problem with this page? Request a review
How to cite
Cite CoChat for the checks on this page, and the paper for its own findings.
- This page
- CoChat. (2026). Citation check: Comparative 454 pyrosequencing of transcripts from two olive genotypes during fruit development. https://app.cochat.ai/papers/10.1186/1471-2164-10-399
- The paper
- Alagna, F., D'Agostino, N., Torchia, L., Servili, M., Rao, R., Pietrella, M., Giuliano, G., Chiusano, M. L., Baldoni, L., & Perrotta, G. (2009). Comparative 454 pyrosequencing of transcripts from two olive genotypes during fruit development. BMC Genomics. https://doi.org/10.1186/1471-2164-10-399
Data sources
Bibliographic data: Semantic Scholar, OpenAlex, Crossref.
Contains information from the Semantic Scholar Academic Graph Datasets, made available under the ODC Attribution License (ODC-BY 1.0).
Semantic Scholar’s data is described in: Kinney, R., et al. (2023). The Semantic Scholar Open Data Platform. arXiv:2301.10140.
