

The DOI matches its Crossref record; 23 of the 24 references it cites were found in a registry or an index; 15 of the 21 sources its claims cite were checked for support.
A data-driven approach to preprocessing Illumina 450K methylation array data
Open accessAbstract
BACKGROUND: As the most stable and experimentally accessible epigenetic mark, DNA methylation is of great interest to the research community. The landscape of DNA methylation across tissues, through development and in disease pathogenesis is not yet well characterized. Thus there is a need for rapid and cost effective methods for assessing genome-wide levels of DNA methylation. The Illumina Infinium HumanMethylation450 (450K) BeadChip is a very useful addition to the available methods for DNA methylation analysis but its complex design, incorporating two different assay methods, requires careful consideration. Accordingly, several normalization schemes have been published. We have taken advantage of known DNA methylation patterns associated with genomic imprinting and X-chromosome inactivation (XCI), in addition to the performance of SNP genotyping assays present on the array, to derive three independent metrics which we use to test alternative schemes of correction and normalization. These metrics also have potential utility as quality scores for datasets. RESULTS: The standard index of DNA methylation at any specific CpG site is β = M/(M + U + 100) where M and U are methylated and unmethylated signal intensities, respectively. Betas (βs) calculated from raw signal intensities (the default GenomeStudio behavior) perform well, but using 11 methylomic datasets we demonstrate that quantile normalization methods produce marked improvement, even in highly consistent data, by all three metrics. The commonly used procedure of normalizing betas is inferior to the separate normalization of M and U, and it is also advantageous to normalize Type I and Type II assays separately. More elaborate manipulation of quantiles proves to be counterproductive. CONCLUSIONS: Careful selection of preprocessing steps can minimize variance and thus improve statistical power, especially for the detection of the small absolute DNA methylation changes likely associated with complex disease phenotypes. For the convenience of the research community we have created a user-friendly R software package called wateRmelon, downloadable from bioConductor, compatible with the existing methylumi, minfi and IMA packages, that allows others to utilize the same normalization methods and data quality tests on 450K data.
Overview
AI snapshot
Written from the paper’s full text.
TL;DR
Using 11 Illumina 450K datasets (total n=696), the authors derive three performance metrics from imprinted DMRs, SNP probes, and X-chromosome inactivation and use them to rank 15 preprocessing/normalization methods. They find that dasen—background adjustment plus separate between-array quantile normalization of methylated and unmethylated Type I and Type II intensities—performs best overall.
Key findings
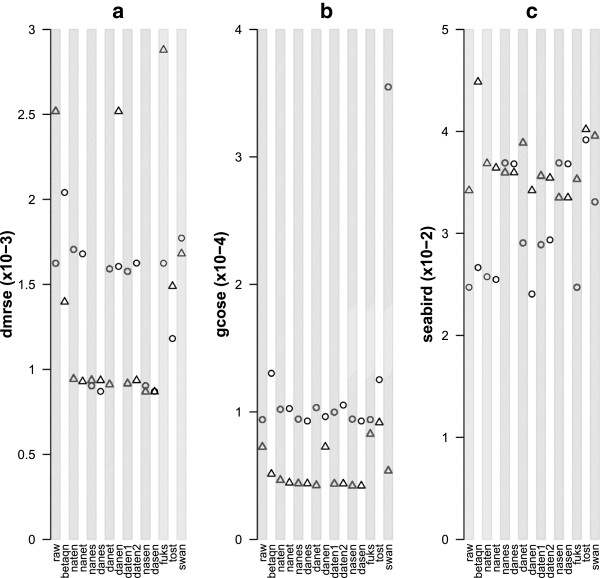
- Across 11 datasets and 15 methods, dasen had the best average rank (2; Type I 2.5, Type II 1.5), followed by danet (3.5) and daten1 (4); raw averaged 8.75, betaqn 13.5, Fuks 10.75, Tost 13.5, and SWAN 12.5.
- Normalizing M and U separately outperformed normalizing β (naten vs betaqn), and separate Type I/Type II normalization improved metrics; more elaborate segmented QN schemes (Tost, SWAN) were counterproductive.
- In Cohort 1Ai, a sex-difference t-test at Bonferroni-corrected p<0.05 yielded 9,796 significant probes, of which 8,969 were X-chromosome loci, recovering 80% of X-chromosome probes; dasen added 296 (3%) sex differences compared with raw.
- The metrics used 237 iDMR probes expected to have β=0.5, 65 SNP probes, and 11,232 X-chromosome features.
Methods
- 11 450K datasets (total n=696) from post-mortem brain regions and whole blood; 500 ng genomic DNA was bisulfite-treated, run on Illumina HumanMethylation450 BeadChips, and raw signal intensities were extracted with GenomeStudio without background correction or normalization.
- Three performance metrics were calculated: DMRSE from 237 imprinted DMR probes expected at β=0.5; GCOSE from 65 SNP probes partitioned by k-means into three genotype clusters; and Seabird = 1−AUC from ROC analysis predicting X-chromosome location using sex-difference p-values.
- Fifteen preprocessing methods were ranked by mean ranks across metrics and datasets for Type I and Type II probes separately; analyses used R 2.15.0 and Bioconductor 2.12, with functions packaged as wateRmelon, and data deposited in GEO under GSE43414.
Limitations
- The authors state that the three metrics may miss some aspect of performance; the datasets analyzed were relatively homogeneous brain or whole blood, multi-tissue datasets were not extensively addressed, and more heterogeneous datasets may require different handling.
- The authors also state that only QN-based methods were tested, and a different approach such as scaling could possibly work better.
- Evident from the text: less than 1% of individual samples were excluded as technical failures based on atypical raw intensity distribution and poor correlation with other samples, and the ranking relies on array-derived natural controls rather than external spike-in validation.
Model-written summary. Check it against the paper before relying on it.
Integrity signals
Registry
Cites
Statistics
Figures
Verification
Claims the paper makes
26 Own result · 24 Own interpretation · 7 Supported · 6 Partly supported · 4 Own method · 2 Couldn’t confirm · 2 Sources not found · 2 No full text of the sources · 2 No basis given · accuracy not yet measured
The cited sources support only part of this claim — read each source’s verdict below.
In the paper
“The β values are indeed fairly stable and the basic analysis method works well, particularly for the detection of large differences, for example between tissues or tumor-normal pairs [8].”
§ A data-driven approach to preprocessing Illumina 450K methylation array data > Background > Normalization
What the sources say
- Partly supportedcites [8] Carén H, Djos A, Nethander M, Sjöberg RM, Kogner P, Enström C, Nilsson S, Martinsson T: Identification of epigenetically regulated genes that predict patient outcome in neuroblastoma. BMC Cancer. 2011, 11: 66-10.1186/1471-2407-11-66. [http://www.pubmedcentral.nih.gov/articlerender.fcgi?artid=3045360&tool=pmcentrez&rendertype=abstract] sourceExperimental — accuracy not yet measured
The Methods define β values, and the Results (Differential methylation analysis; page unavailable) show that comparing them detected differences between neuroblastoma patient groups. The Discussion describes DNA methylation measurement as robust and stable. The paper does not establish that basic β-value analysis works particularly well for large differences between tissues or tumor–normal pairs. (LLM, conf=0.83)
plaindirect- Asserted: passes — The authors put it forward as true.
- Checkable: passes — It can be checked against evidence.
- Load-bearing: passes — The paper’s conclusions depend on it.
- Based: passes — The paper gives a reason why it holds.
- Partly supported
The cited sources support only part of this claim — read each source’s verdict below.
In the paper
“True, autosomal sex-specifically methylated loci are very small in number”
§ A data-driven approach to preprocessing Illumina 450K methylation array data > Results and discussion > Performance metrics
What the sources say
- Partly supportedcites [17] Chen Ya, Choufani S, Ferreira JC, Grafodatskaya D, Butcher DT, Weksberg R: Sequence overlap between autosomal and sex-linked probes on the Illumina HumanMethylation27 microarray. Genomics. 2011, 97 (4): 214-222. 10.1016/j.ygeno.2010.12.004. [http://www.ncbi.nlm.nih.gov/pubmed/21211562] sourceExperimental — accuracy not yet measured
Section 2.1 reports that, among 26,486 autosomal CpGs tested in blood lymphocytes, only seven of the 19 apparent sex-specific findings were not considered technical artifacts. That supports the claim that such loci were very few in this study, but not an unqualified claim about all autosomal loci or tissues. (LLM, conf=0.84)
plain- Asserted: passes — The authors put it forward as true.
- Checkable: passes — It can be checked against evidence.
- Load-bearing: passes — The paper’s conclusions depend on it.
- Based: passes — The paper gives a reason why it holds.
- Partly supported
Every source the paper cites for this claim was checked and supports it.
In the paper
“tests of distribution similarity between technical replicates(for example the Kolmogorov-Smirnov test used by Maksimovic et al[6]) are also potentially misleading because samples can be identically distributed but uncorrelated.”
§ A data-driven approach to preprocessing Illumina 450K methylation array data > Background > Performance metrics
What the sources say
- Supportedcites [6] Maksimovic J, Gordon L, Oshlack A: SWAN: Subset quantile within-array normalization for Illumina Infinium HumanMethylation450 BeadChips. Genome Biol. 2012, 13 (6): R44-10.1186/gb-2012-13-6-r44. [http://www.ncbi.nlm.nih.gov/pubmed/22703947] source
The Results section (“SWAN reduces technical variability”) says Maksimovic et al. used the Kolmogorov–Smirnov test to compare β-value distributions between pairs of technical replicates. The statement that this test can be misleading is the citing authors’ own criticism, not a finding the citation attributes to Maksimovic et al. (LLM, conf=0.94)
hedged- Asserted: passes — The authors put it forward as true.
- Checkable: passes — It can be checked against evidence.
- Load-bearing: passes — The paper’s conclusions depend on it.
- Based: passes — The paper gives a reason why it holds.
- Supported
Every source the paper cites for this claim was checked and supports it.
In the paper
“the disappearance of batch effects is a useful indicator [12], but not sufficient as a performance indicator because it does not indicate whether true differences can”
§ A data-driven approach to preprocessing Illumina 450K methylation array data > Background > Performance metrics
What the sources say
- Supportedcites [12] Sun Z, Chai HS, Wu Y, White WM, Donkena KV, Klein CJ, Garovic VD, Therneau TM, Kocher JPa: Batch effect correction for genome-wide methylation data with Illumina Infinium platform. BMC Med Genomics. 2011, 4: 84-10.1186/1755-8794-4-84. [http://www.pubmedcentral.nih.gov/articlerender.fcgi?artid=3265417&tool=pmcentrez&rendertype=abstract] source
The Results section on normalization assesses performance by reductions in batch-associated CpGs, treating batch-effect reduction as a useful indicator. The Methods section on performance evaluation separately measures biological signal detection using differentially methylated CpGs, supporting the point that batch-effect reduction alone does not establish whether true differences remain detectable. Page numbers are not available in our copy. (LLM, conf=0.88)
plain- Asserted: passes — The authors put it forward as true.
- Checkable: passes — It can be checked against evidence.
- Load-bearing: passes — The paper’s conclusions depend on it.
- Based: passes — The paper gives a reason why it holds.
- Supported
Every source the paper cites for this claim was checked and supports it.
In the paper
“and potentially represent autosomal probes mapping to sequences on the sex-chromosome [17].”
§ A data-driven approach to preprocessing Illumina 450K methylation array data > Results and discussion > Performance metrics
What the sources say
- Supportedcites [17] Chen Ya, Choufani S, Ferreira JC, Grafodatskaya D, Butcher DT, Weksberg R: Sequence overlap between autosomal and sex-linked probes on the Illumina HumanMethylation27 microarray. Genomics. 2011, 97 (4): 214-222. 10.1016/j.ygeno.2010.12.004. [http://www.ncbi.nlm.nih.gov/pubmed/21211562] source
Section 2.1 reports that 12 of 19 probes for apparently sex-specifically methylated autosomal CpGs had cross-reactive sequences on sex chromosomes. This supports the citing sentence’s qualified claim that such findings may reflect autosomal probes mapping to sex-chromosome sequences; the section also distinguishes seven findings not considered artifacts. Page numbers are not provided in our copy. (LLM, conf=0.93)
hedgedconditional- Asserted: passes — The authors put it forward as true.
- Checkable: passes — It can be checked against evidence.
- Load-bearing: passes — The paper’s conclusions depend on it.
- Based: passes — The paper gives a reason why it holds.
- Supported
The cited sources support only part of this claim — read each source’s verdict below.
In the paper
“Profile correlations are also insensitive to the potential problems of normalization because they are dominated by the majority of probes which do not show true differences”
§ A data-driven approach to preprocessing Illumina 450K methylation array data > Background > Performance metrics
What the sources say
- Partly supportedcites [14] Roessler J, Ammerpohl O, Gutwein J, Hasemeier B, Anwar SL, Kreipe H, Lehmann U: Quantitative cross-validation and content analysis of the 450k DNA methylation array from Illumina, Inc. BMC Res Notes. 2012, 5: 210-10.1186/1756-0500-5-210. [http://www.pubmedcentral.nih.gov/articlerender.fcgi?artid=3420245&tool=pmcentrez&rendertype=abstract] sourceExperimental — accuracy not yet measured
In Findings > Cross-validation of 450k methylation array and pyrosequencing (page not provided), the paper says correlations can be misleading because data points cluster near 0% and 100% methylation, masking poorer agreement in the middle range. It does not say this makes profile correlations insensitive to normalization problems, or that the dominant probes are those without true differences. (LLM, conf=0.84)
plain- Asserted: passes — The authors put it forward as true.
- Checkable: passes — It can be checked against evidence.
- Load-bearing: passes — The paper’s conclusions depend on it.
- Based: passes — The paper gives a reason why it holds.
- Partly supported
Every source the paper cites for this claim was checked and supports it.
In the paper
“Type I and Type II probes perform differently.”
§ A data-driven approach to preprocessing Illumina 450K methylation array data > Results and discussion > Preprocessing and normalization method design
What the sources say
- Supportedcites [5] Dedeurwaerder S, Defrance M, Calonne E, Sotiriou C, Fuks F: Evaluation of the Infinium Methylation 450K technology. Epigenetics. 2011, 3 (6): 771-784. source
The ‘Divergence of results obtained with the Infinium I & II assays’ section (p. 6) reports different β-value ranges and greater variance between replicates for Type II probes. The Discussion (p. 11) likewise concludes that Type II data are less accurate and reproducible than Type I data. (LLM, conf=0.95)
plaincorrelational- Asserted: passes — The authors put it forward as true.
- Checkable: passes — It can be checked against evidence.
- Load-bearing: passes — The paper’s conclusions depend on it.
- Based: passes — The paper gives a reason why it holds.
- Supported
The cited sources support only part of this claim — read each source’s verdict below.
In the paper
“where array features overlap these, we would expect monoallelic (therefore 50% (β=0.5)) methylation.”
§ A data-driven approach to preprocessing Illumina 450K methylation array data > Background > Performance metrics
What the sources say
- Partly supportedcites [15] Schulz R, Woodfine K, Menheniott TR, Bourc’his D, Bestor T, Oakey RJ: WAMIDEX: a web atlas of murine genomic imprinting and differential expression. Epigenetics. 2008, 3 (2): 89-96. 10.4161/epi.3.2.5900. [http://www.landesbioscience.com/journals/epi/article/5900/] sourceExperimental — accuracy not yet measured
The Introduction describes methylation differences between maternal and paternal alleles at imprinting control regions, and the Methods say most such regions are methylated on the maternal allele. That supports the monoallelic premise, but the paper does not give an expected 50% methylation value or β=0.5 reading for array features overlapping iDMRs; its described microarrays measure gene expression. (LLM, conf=0.82)
- Not matchedcites [16] Schulz R: Wamidex, accessed 26 Jan2012. [https://atlas.genetics.kcl.ac.uk/]
Couldn’t be matched to a paper in Crossref, so it can’t be checked.
hedged- Asserted: passes — The authors put it forward as true.
- Checkable: passes — It can be checked against evidence.
- Load-bearing: passes — The paper’s conclusions depend on it.
- Based: passes — The paper gives a reason why it holds.
- Partly supported
The cited sources support only part of this claim — read each source’s verdict below.
In the paper
“it may be advantageous to minimize the differences so that the ranking of potential differentially methylated loci is more accurate [5].”
§ A data-driven approach to preprocessing Illumina 450K methylation array data > Results and discussion > Preprocessing and normalization method design
What the sources say
- Partly supportedcites [5] Dedeurwaerder S, Defrance M, Calonne E, Sotiriou C, Fuks F: Evaluation of the Infinium Methylation 450K technology. Epigenetics. 2011, 3 (6): 771-784. sourceExperimental — accuracy not yet measured
The Discussion (p. 11) says correcting differences between Type I and Type II data improves accuracy and facilitates detection of differentially methylated cytosines. The paper does not assess whether correction makes the ranking of candidate loci more accurate. (LLM, conf=0.84)
hedgedconditional- Asserted: passes — The authors put it forward as true.
- Checkable: passes — It can be checked against evidence.
- Load-bearing: passes — The paper’s conclusions depend on it.
- Based: passes — The paper gives a reason why it holds.
- Partly supported
Every source the paper cites for this claim was checked and supports it.
In the paper
“Previous DNA methylation data analysis methods have been assessed using the DNA methylaton differences between experimental groups verified using an independent method [5].”
§ A data-driven approach to preprocessing Illumina 450K methylation array data > Background > Performance metrics
What the sources say
- Supportedcites [5] Dedeurwaerder S, Defrance M, Calonne E, Sotiriou C, Fuks F: Evaluation of the Infinium Methylation 450K technology. Epigenetics. 2011, 3 (6): 771-784. source
The section on improving detection of differentially methylated cytosines (p. 10) compares methylation differences between HCT116 wild-type and double-knockout samples using raw and corrected Infinium data. It reports that an independent method, bisulfite pyrosequencing, confirmed two sites identified as differentially methylated by the corrected data. (LLM, conf=0.91)
plain- Asserted: passes — The authors put it forward as true.
- Checkable: passes — It can be checked against evidence.
- Load-bearing: passes — The paper’s conclusions depend on it.
- Based: passes — The paper gives a reason why it holds.
- Supported
- Probably not a substantial claim. 14
- It may state two separate claims as one. 6
Every source the paper cites for this claim was checked and supports it.
In the paper
“Dedeurwaerder et al[5] found that this reflected a difference in performance between the two probe types and devised a custom transformation of the Type II β values to accommodate it”
§ A data-driven approach to preprocessing Illumina 450K methylation array data > Background
What the sources say
- Supportedcites [5] Dedeurwaerder S, Defrance M, Calonne E, Sotiriou C, Fuks F: Evaluation of the Infinium Methylation 450K technology. Epigenetics. 2011, 3 (6): 771-784. source
The Divergence section (p. 6) reports shifted β-value distributions and finds that Infinium II probes detect methylation levels less efficiently than Infinium I probes. The Peak-based correction method (p. 3) describes rescaling Infinium II values, and the Discussion (p. 11) identifies this as a method developed to make the two datasets comparable. (LLM, conf=0.94)
plaindirect- Asserted: passes — The authors put it forward as true.
- Checkable: passes — It can be checked against evidence.
- Load-bearing: passes — The paper’s conclusions depend on it.
- Based: passes — The paper gives a reason why it holds.
Probably not a substantial claim. It may state two separate claims as one.
- Supported
The cited sources that could be checked couldn’t confirm or dispute this claim.
In the paper
“the majority of CpG sites assayed are in a fully methylated or fully unmethylated state and would change little after normalization”
§ A data-driven approach to preprocessing Illumina 450K methylation array data > Background > Performance metrics
What the sources say
- Could not verifycites [14] Roessler J, Ammerpohl O, Gutwein J, Hasemeier B, Anwar SL, Kreipe H, Lehmann U: Quantitative cross-validation and content analysis of the 450k DNA methylation array from Illumina, Inc. BMC Res Notes. 2012, 5: 210-10.1186/1756-0500-5-210. [http://www.pubmedcentral.nih.gov/articlerender.fcgi?artid=3420245&tool=pmcentrez&rendertype=abstract] sourceExperimental — accuracy not yet measured
The Conclusion says that β-values are a good measure of methylation status for most CpG sites, but it does not say most sites are fully methylated or fully unmethylated. The Findings discuss agreement with pyrosequencing, not changes after normalization. Searches for extreme methylation states and normalization found no passage addressing the claim. (LLM, conf=0.72)
plain- Asserted: passes — The authors put it forward as true.
- Checkable: passes — It can be checked against evidence.
- Load-bearing: passes — The paper’s conclusions depend on it.
- Based: passes — The paper gives a reason why it holds.
It may state two separate claims as one.
- Could not verify
Every source the paper cites for this claim was checked and supports it.
In the paper
“Currently the DNA methylation field resembles gene expression studies of a decade ago: it is technology-limited and characterized by small sample sizes, diverse techniques and variable statistical standards [22].”
§ A data-driven approach to preprocessing Illumina 450K methylation array data > Conclusions
What the sources say
- Supportedcites [22] Heijmans BT, Mill J: Commentary: The seven plagues of epigenetic epidemiology. Int J Epidemiol. 2012, 41: 74-78. 10.1093/ije/dyr225. [http://www.ncbi.nlm.nih.gov/pubmed/22269254] source
The sections on imperfect technology and sample sizes describe trade-offs between methylation methods, difficulty comparing platforms, and a study of only 40 individuals when much larger samples may be needed. The section on genome-wide data says EWAS analytical methods are still under construction and calls for common analysis and significance guidelines. These passages support the characteristics attributed to the source; the comparison with gene-expression studies a decade earlier is the citing authors’ framing. (LLM, conf=0.92)
plain- Asserted: passes — The authors put it forward as true.
- Checkable: passes — It can be checked against evidence.
- Load-bearing: passes — The paper’s conclusions depend on it.
- Based: passes — The paper gives a reason why it holds.
Probably not a substantial claim. It may state two separate claims as one.
- Supported
The cited sources support only part of this claim — read each source’s verdict below.
In the paper
“the minority of intermediate methylation values would be susceptible to far greater changes after normalization but would be overlooked by a correlation test [14]”
§ A data-driven approach to preprocessing Illumina 450K methylation array data > Background > Performance metrics
What the sources say
- Partly supportedcites [14] Roessler J, Ammerpohl O, Gutwein J, Hasemeier B, Anwar SL, Kreipe H, Lehmann U: Quantitative cross-validation and content analysis of the 450k DNA methylation array from Illumina, Inc. BMC Res Notes. 2012, 5: 210-10.1186/1756-0500-5-210. [http://www.pubmedcentral.nih.gov/articlerender.fcgi?artid=3420245&tool=pmcentrez&rendertype=abstract] sourceExperimental — accuracy not yet measured
In Findings > Cross-validation of 450k methylation array and pyrosequencing (page not specified), the paper says correlation coefficients can be misleading because values near 0% and 100% dominate, masking poorer agreement at intermediate methylation levels. It compares array measurements with pyrosequencing; it does not say that intermediate values undergo greater changes after normalization. (LLM, conf=0.87)
hedgeddirect- Asserted: passes — The authors put it forward as true.
- Checkable: passes — It can be checked against evidence.
- Load-bearing: passes — The paper’s conclusions depend on it.
- Based: passes — The paper gives a reason why it holds.
It may state two separate claims as one.
- Partly supported
A result the paper reports from its own data — it cites no other source for it, so there is none to check. The quote shows it is in the paper.
In the paper
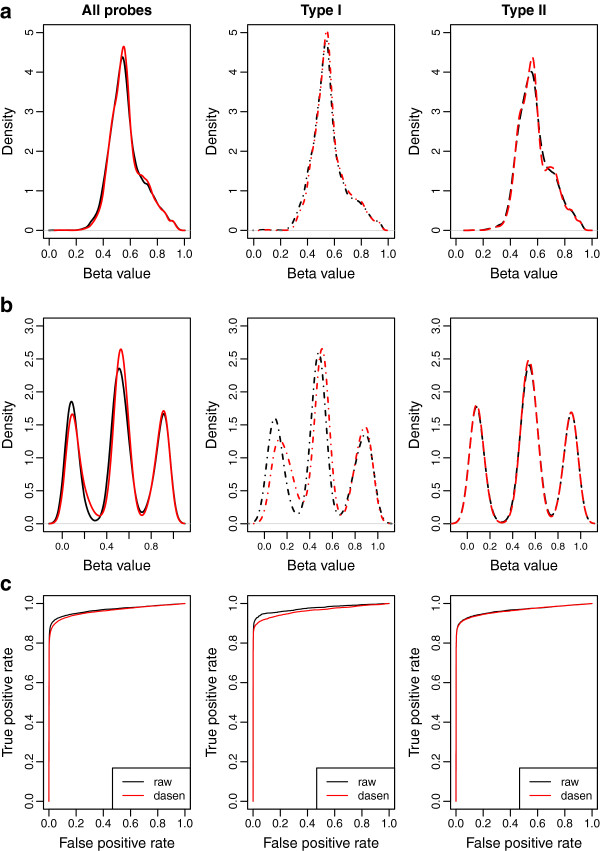
“While the difference in peak width is not readily visible at this scale, the effect of background adjustment on Type I probes is clearly visible.”
§ A data-driven approach to preprocessing Illumina 450K methylation array data > Results and discussion > Systematic ranking of methods based on metrics
boosteddirect- Asserted: passes — The authors put it forward as true.
- Checkable: passes — It can be checked against evidence.
- Load-bearing: fails — The paper’s conclusions may not depend on it.
- Based: passes — The paper gives a reason why it holds.
Probably not a substantial claim. The paper’s conclusions may not depend on it.
A conclusion the paper draws from its own results — it cites no other source for it, so there is none to check. The quote shows it is in the paper.
In the paper
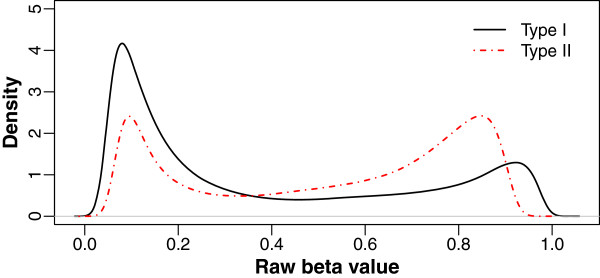
“Our insight is that a higher background in the Type II assays would explain such a difference in distribution of β values, because it inflates both M and U”
§ A data-driven approach to preprocessing Illumina 450K methylation array data > Background
hedgeddirect- Asserted: passes — The authors put it forward as true.
- Checkable: passes — It can be checked against evidence.
- Load-bearing: passes — The paper’s conclusions depend on it.
- Based: passes — The paper gives a reason why it holds.
It may state two separate claims as one.
A conclusion the paper draws from its own results — it cites no other source for it, so there is none to check. The quote shows it is in the paper.
In the paper
“A potential weakness of QN is that in parts of the distribution with few values (and therefore relatively large interquantile differences), it may introduce considerable changes.”
§ A data-driven approach to preprocessing Illumina 450K methylation array data > Background > Normalization
hedgedconditional- Asserted: passes — The authors put it forward as true.
- Checkable: passes — It can be checked against evidence.
- Load-bearing: fails — The paper’s conclusions may not depend on it.
- Based: passes — The paper gives a reason why it holds.
Probably not a substantial claim. The paper’s conclusions may not depend on it.
In the paper
“Quantile normalization (QN) is a well established technique in gene expression analysis, where it has been shown to perform well [13].”
§ A data-driven approach to preprocessing Illumina 450K methylation array data > Background > Normalization
What the sources say
- Not checked — no full text of the sourcecites [13] Irizarry Ra, Hobbs B, Collin F, Beazer-Barclay YD, Antonellis KJ, Scherf U, Speed TP: Exploration, normalization, and summaries of high density oligonucleotide array probe level data. Biostatistics (Oxford, England). 2003, 4 (2): 249-264. 10.1093/biostatistics/4.2.249. [http://www.ncbi.nlm.nih.gov/pubmed/12925520] source
boosted- Asserted: passes — The authors put it forward as true.
- Checkable: passes — It can be checked against evidence.
- Load-bearing: fails — The paper’s conclusions may not depend on it.
- Based: passes — The paper gives a reason why it holds.
Probably not a substantial claim. The paper’s conclusions may not depend on it. It may state two separate claims as one.
A conclusion the paper draws from its own results — it cites no other source for it, so there is none to check. The quote shows it is in the paper.
In the paper
“Although these are not DNA methylation signals, they could be used to provide an indication of the degree of technical variance between samples.”
§ A data-driven approach to preprocessing Illumina 450K methylation array data > Background > Performance metrics
hedgedcorrelational- Asserted: passes — The authors put it forward as true.
- Checkable: passes — It can be checked against evidence.
- Load-bearing: fails — The paper’s conclusions may not depend on it.
- Based: passes — The paper gives a reason why it holds.
Probably not a substantial claim. The paper’s conclusions may not depend on it.
- Rests on an assumption: The 450K BeadChip contains 65 control probes that assay highly polymorphic SNPs rather than DNA methylation.
What the paper did — it cites no source for this, so there is none to check. The quote shows it is in the paper.
In the paper
“Initial quality control checks were performed using functions in the methylumi package to assess concordance between reported and genotyped gender.”
§ A data-driven approach to preprocessing Illumina 450K methylation array data > Methods > Statistical analysis
plain- Asserted: passes — The authors put it forward as true.
- Checkable: passes — It can be checked against evidence.
- Load-bearing: fails — The paper’s conclusions may not depend on it.
- Based: passes — The paper gives a reason why it holds.
Probably not a substantial claim. The paper’s conclusions may not depend on it.
What the paper did — it cites no source for this, so there is none to check. The quote shows it is in the paper.
In the paper
“Non-CpG SNP probes on the array were also used to confirm that multiple tissues were sourced from the same individual where expected.”
§ A data-driven approach to preprocessing Illumina 450K methylation array data > Methods > Statistical analysis
plaindirect- Asserted: passes — The authors put it forward as true.
- Checkable: passes — It can be checked against evidence.
- Load-bearing: fails — The paper’s conclusions may not depend on it.
- Based: passes — The paper gives a reason why it holds.
Probably not a substantial claim. The paper’s conclusions may not depend on it.
A conclusion the paper draws from its own results — it cites no other source for it, so there is none to check. The quote shows it is in the paper.
In the paper
“The danger is that these large changes could increase the variance across samples for individual features, rather than reducing it as desired.”
§ A data-driven approach to preprocessing Illumina 450K methylation array data > Background > Normalization
hedgedconditional- Asserted: passes — The authors put it forward as true.
- Checkable: passes — It can be checked against evidence.
- Load-bearing: passes — The paper’s conclusions depend on it.
- Based: passes — The paper gives a reason why it holds.
Probably not a substantial claim.
A conclusion the paper draws from its own results — it cites no other source for it, so there is none to check. The quote shows it is in the paper.
In the paper
“and it should directly predict sensitivity to detect true differences between groups.”
§ A data-driven approach to preprocessing Illumina 450K methylation array data > Results and discussion > Performance metrics
plaindirect- Asserted: passes — The authors put it forward as true.
- Checkable: passes — It can be checked against evidence.
- Load-bearing: passes — The paper’s conclusions depend on it.
- Based: fails — The paper may give no reason why it holds.
Probably not a substantial claim. The paper may give no reason why it holds.
A conclusion the paper draws from its own results — it cites no other source for it, so there is none to check. The quote shows it is in the paper.
In the paper
“This measure was chosen because it is reasonably independent of the size of the dataset”
§ A data-driven approach to preprocessing Illumina 450K methylation array data > Results and discussion > Performance metrics
plain- Asserted: passes — The authors put it forward as true.
- Checkable: passes — It can be checked against evidence.
- Load-bearing: passes — The paper’s conclusions depend on it.
- Based: fails — The paper may give no reason why it holds.
Probably not a substantial claim. The paper may give no reason why it holds.
A conclusion the paper draws from its own results — it cites no other source for it, so there is none to check. The quote shows it is in the paper.
In the paper
“where effects may be complicated by their interaction.”
§ A data-driven approach to preprocessing Illumina 450K methylation array data > Results and discussion > Preprocessing and normalization method design
hedgedconditional- Asserted: passes — The authors put it forward as true.
- Checkable: passes — It can be checked against evidence.
- Load-bearing: passes — The paper’s conclusions depend on it.
- Based: passes — The paper gives a reason why it holds.
Probably not a substantial claim.
A conclusion the paper draws from its own results — it cites no other source for it, so there is none to check. The quote shows it is in the paper.
In the paper
“The signal from these probes is expected to cluster into three distinct groups (representing the heterozygous and two homozygous groups).”
§ A data-driven approach to preprocessing Illumina 450K methylation array data > Background > Performance metrics
plain- Asserted: passes — The authors put it forward as true.
- Checkable: passes — It can be checked against evidence.
- Load-bearing: fails — The paper’s conclusions may not depend on it.
- Based: fails — The paper may give no reason why it holds.
Probably not a substantial claim. The paper’s conclusions may not depend on it. The paper may give no reason why it holds.
- Rests on an assumption: The 450K BeadChip contains 65 control probes that assay highly polymorphic SNPs rather than DNA methylation.
A conclusion the paper draws from its own results — it cites no other source for it, so there is none to check. The quote shows it is in the paper.
In the paper
“Finally we have only tested methods based on QN.”
§ A data-driven approach to preprocessing Illumina 450K methylation array data > Results and discussion > Limitations
plain- Asserted: passes — The authors put it forward as true.
- Checkable: passes — It can be checked against evidence.
- Load-bearing: fails — The paper’s conclusions may not depend on it.
- Based: passes — The paper gives a reason why it holds.
Probably not a substantial claim. The paper’s conclusions may not depend on it.
The paper relies on this without support.
Small absolute DNA methylation changes are likely associated with complex disease phenotypes.
“especially for the detection of the small absolute DNA methylation changes likely associated with complex disease phenotypes”
The paper relies on this without support.
Attempts to correct background by subtracting estimates derived from control probes introduce another source of variance.
“attempts to correct them, for example by subtraction of estimates derived from control probes, are undesirable because they introduce another source of variance”
The paper relies on this without support.
The suitability of quantile normalization for DNA methylation data has been assumed from gene expression experience, but there has been little systematic testing.
“The suitability of QN for DNA methylation data has been assumed based on experience in the analysis of gene expression data, but there has been little systematic testing.”
The paper relies on this without support.
The 450K BeadChip contains 65 control probes that assay highly polymorphic SNPs rather than DNA methylation.
“The 450K BeadChip also features 65 control probes which assay highly-polymorphic single nucleotide polymorphisms (SNPs) rather than DNA methylation.”
The paper relies on this without support.
GenomeStudio default settings perform no normalization.
“the manufacturer’s GenomeStudio software calculates βs from raw intensities and under default settings performs no normalization”
The paper relies on this without support.
In females, one copy of the X chromosome is predominantly inactivated and largely methylated.
“In females, one copy of the X-chromosome is predominantly inactivated and largely methylated.”
The paper relies on this without support.
65 probes on the 450K BeadChip assay highly polymorphic SNPs rather than CpG sites.
“There are 65 probes on the 450K BeadChip which assay highly polymorphic SNPs rather than CpG sites.”
The paper relies on this without support.
QN has the potential to impose large changes in parts of a distribution with few members.
“the known potential of QN to impose large changes in those parts of a distribution with few members”
The paper relies on this without support.
M and U distributions differ.
“M and U distributions differ”
The paper relies on this without support.
Dye bias variation is a potential problem with Type II assays.
“which is a potential problem with Type II assays”
The paper relies on this without support.
The inactive X-chromosome in females is hypermethylated.
“The inactive X-chromosome in females is hypermethylated”
The paper relies on this without support.
The 11,232 X-chromosome features annotated for the array show a distinctive β distribution centred on approximately 0.5, compared with the biphasic distribution of autosomal probes.
“the 11,232 X-chromosome features annotated for the array show a distinctive β value distribution, once again centred on approximately 0.5, compared to the biphasic distribution of autosomal probes.”
The paper relies on this without support.
The three performance metrics (DMRSE, GCOSE, Seabird) are valid indicators of preprocessing method performance.
“The test metrics were subsequently used to quantitatively determine the best performing preprocessing method”
The paper relies on this without support.
Type II probes represent 72% of the probes on the array.
“which represent 72% of the probes on the array”
The paper relies on this without support.
The array features that assay known sites of differential methylation or genotype are valid indicators of normalization performance.
“We then evaluated each method using features on the array that assay known sites of differential methylation or genotype.”
The paper relies on this without support.
Quantile normalization is strongly favoured by consensus in the field.
“Although there is a strong consensus in favour of this method, it is possible that a different approach based, for example, on scaling, could possibly work better.”
Claims other papers make about this one
Each is checked against this paper’s own text: does it say what the citing paper says it does?
The cited source doesn’t support the claim as written.
In the citing paper
“SWAN normalisation removed technical differences between MINFI package Infinium I and Infinium II probes (Maksimovic, Gordon & Oshlack, 2012;Pidsley et al., 2013).”
From DNA methylation of NR3C1 and FKBP5 is associated with posttraumatic stress disorder, posttraumatic growth, and resilience. (2020) · cites this paper as Pidsley et al., 2013
Checked by a reasoning model — may be wrong.
Experimental — accuracy not yet measured
Self-check
Percentages, sums and reported differences re-computed from the paper’s own numbers.
Each contradiction between two passages listed here was confirmed by an independent check.
Rated minor: it would not touch a result — a value no result rests on, a p-value that stays on the same side of the significance level, or a conflict that is clerical, resolved elsewhere in the paper, or outside its own findings.
In the paper
§ A data-driven approach to preprocessing Illumina 450K methylation array data > Methods > Samples
“Seven of the datasets were obtained from one cohort of post-mortem brain samples”
§ A data-driven approach to preprocessing Illumina 450K methylation array data > Methods > Samples
“cerebellum (1Ai) (n=91), rescan of cerebellum data (1Aii) (n=36), frontal cortex (1B) (n=89), entorhinal cortex (1C) (n=93), superior temporal gyrus (1D) (n=94), whole blood (1E) (n=95), frontal cortex and entorhinal cortex (1BC) (n=46), cerebellum and superior temporal gyrus (1AD) (n=47).”
Citations
Cites
Bioconductor: open software development for computational biology and bioinformatics
Gentleman, R. C., Carey, V. J., Bates, D. M., Bolstad, B., Dettling, M., Dudoit, S., Ellis, B., Gautier, L., Ge, Y., Gentry, J., et al. (2004) · Genome biology · doi:10.1186/gb-2004-5-10-r80 · Cited by 12,082 · cited 1×
“12 [24].”
Exploration, normalization, and summaries of high density oligonucleotide array probe level data
Irizarry, R. A. (2003) · Biostatistics · doi:10.1093/biostatistics/4.2.249 · Cited by 10,603 · cited 2×
“Standard, specially constructed control datasets produced by spiking samples have been influential in the gene expression field [13], but would not be as suitable for analysis of DNA methylation.”
BackgroundMethodlimma: Linear Models for Microarray Data
Smyth, G. K. (2005) · Statistics for Biology and Health · doi:10.1007/0-387-29362-0_23 · Cited by 5,796
Bioinformatics and Computational Biology Solutions Using R and Bioconductor
Gentleman, R. C., Carey, V. J., Huber, W. K., Irizarry, R. A., & Dudoit, S. (2005) · Statistics in the health sciences · doi:10.1007/0-387-29362-0 · Cited by 3,470
ROCR: visualizing classifier performance in R
Sing, T., Sander, O., Beerenwinkel, N., & Lengauer, T. (2005) · Computer applications in the biosciences · doi:10.1093/bioinformatics/bti623 · Cited by 3,172
Du, P., Zhang, X., Huang, C.-C., Jafari, N., Kibbe, W. A., Hou, L., & Lin, S. M. (2010) · BMC Bioinformatics · doi:10.1186/1471-2105-11-587 · Cited by 2,136 · cited 1×
“An alternative index not bounded by 0 and 1 is M = log2((M + α)/(U + α)), which is essentially equivalent to a logit transformation of β [4].”
BackgroundHigh density DNA methylation array with single CpG site resolution
Bibikova, M., Barnes, B., Tsan, C., Ho, V., Klotzle, B., Le, J. M., Delano, D., Zhang, L., Schroth, G. P., Gunderson, K. L., et al. (2011) · Genomics · doi:10.1016/j.ygeno.2011.07.007 · Cited by 1,727 · cited 9×
“The 450K BeadChip [2,3] achieves increased coverage by utilising two different probe types on each array: Infinium I (n=135,501) and Infinium II (n=350,076) probes.”
BackgroundMethodInfluentialTeschendorff, A. E., Marabita, F., Lechner, M., Bartlett, T. E., Tegner, J. N., Gómez-Cabrero, D., & Beck, S. (2012) · Bioinformatics · doi:10.1093/bioinformatics/bts680 · Cited by 1,686
Validation of a DNA methylation microarray for 450,000 CpG sites in the human genome
Sandoval, J., Heyn, H., Moran, S., Serra-Musach, J., Pujana, M. A., Bibikova, M., & Esteller, M. (2011) · Epigenetics · doi:10.4161/epi.6.6.16196 · Cited by 990 · cited 9×
“The 450K BeadChip [2,3] achieves increased coverage by utilising two different probe types on each array: Infinium I (n=135,501) and Infinium II (n=350,076) probes.”
BackgroundMethodInfluentialSWAN: Subset-quantile Within Array Normalization for Illumina Infinium HumanMethylation450 BeadChips
Maksimovic, J., Gordon, L., & Oshlack, A. (2012) · Genome Biology · doi:10.1186/gb-2012-13-6-r44 · Cited by 826
Research works printed but not linked: 1
- Davis S, Du P, Bilke S, Triche JrT, Bootwalla M: Methylumi: Handle Illumina Methylation Data. 2012, R package version 2.2.0, .
Cited by
Sorted by citations
Items 801–900 of 1,208
Andersen, A. M., Lei, M., Philibert, R. A., & Beach, S. R. H. (2018) · Frontiers in Genetics · doi:10.3389/fgene.2018.00622 · Cited by 3
Serum cholesterol, MTHFR methylation, and symptoms of depression in children.
Mesirow, M. S. C., Roberts, S., Cecil, C. A. M., Maughan, B., Jacka, F. N., Relton, C. L., & Barker, E. D. (2019) · Developmental Psychology · doi:10.1037/dev0000831 · Cited by 3
Fetal gastroschisis: Maternal and fetal methylation profile
de Freitas, A. B., Francisco, R. P. V., Centofanti, S. F., Damasceno, J. G., Chehimi, S. N., Osmundo, G. D. S., Kulikowski, L. D., & Brizot, M. D. L. (2020) · Prenatal Diagnosis · doi:10.1002/pd.5881 · Cited by 3
Huerta, A. E., Riezu‐Boj, J. I., Milagro, F. I., Guruceaga, E., Moreno-Aliaga, M. J., & Martínez, J. A. (2017) · Journal of Functional Foods · doi:10.1016/j.jff.2017.07.002 · Cited by 3
Zannas, A. S., Jia, M., Hafner, K., Baumert, J. J., Wiechmann, T., Pape, J. C., Arloth, J., Ködel, M., Martinelli, S., Roitman, M., et al. (2018) · bioRxiv (Cold Spring Harbor Laboratory) · doi:10.1101/484709 · Cited by 3
Steg, L. C., Shireby, G. L., Imm, J. L., Davies, J. P., Franklin, A., Flynn, R. J., Namboori, S. C., Bhinge, A., Jeffries, A. R., Burrage, J., et al. (2020) · bioRxiv (Cold Spring Harbor Laboratory) · doi:10.1101/2020.10.14.339093 · Cited by 3
Self-citationTiane, A., Schepers, M., Reijnders, R. A., et al. (2023) · bioRxiv (Cold Spring Harbor Laboratory) · doi:10.1101/2023.01.12.523740 · Cited by 3
Hannon, E. J., Dempster, E. L., Chioza, B. A., Davies, J. P., Blake, G. E. T., Burrage, J., Policicchio, S. S. S., Franklin, A., Walker, E., Bamford, R. A., et al. (2023) · bioRxiv (Cold Spring Harbor Laboratory) · doi:10.1101/2023.06.23.545974 · Cited by 3
Self-citationHuman reproduction comes at the expense of faster aging and a shorter lifePreprint
Hukkanen, M., Kankaanpää, A., Heikkinen, A., Kaprio, J. A., Cristofari, R., & Ollikainen, M. (2024) · bioRxiv (Cold Spring Harbor Laboratory) · doi:10.1101/2024.07.18.603826 · Cited by 3
Jhun, M. A. (2015) · Deep Blue (University of Michigan) · Cited by 3
The Circulating Methylome in Childhood-Onset Inflammatory Bowel Disease
Noble, A. J., Adams, A., Nowak, J. K., Cheng, G., Nayak, K., Quinn, A., Kristiansen, M., Kalla, R., Ventham, N. T., Giachero, F., et al. (2024) · Journal of Crohn s and Colitis · doi:10.1093/ecco-jcc/jjae157 · Cited by 2
From aging to Alzheimer’s disease: concordant brain DNA methylation changes in late life
Lukacsovich, D., Young, J. I., Gomez, L., Schmidt, M. A., Zhang, W. Y., Kunkle, B. W., Chen, X. S., Martin, E. R., Wang, L., & Initiative, A. D. N. (2026) · Genome Medicine · doi:10.1186/s13073-026-01698-8 · Cited by 2
Rambarack, N., Fodder, K., Murthy, M. N., Toomey, C. E., de Silva, R., Heutink, P., Humphrey, J., Raj, T., Lashley, T., & Bettencourt, C. (2025) · Acta Neuropathologica Communications · doi:10.1186/s40478-025-02071-3 · Cited by 3
Fu, M. P., Sharma, M., Yousefi, P., Merrill, S. M., Tan, R., Samra, S., Setiadi, A., Golding, L., Modi, B. P., Bel, K. L. D., et al. (2025) · The Journal of Experimental Medicine · doi:10.1084/jem.20240945 · Cited by 2
Accelerated biological aging and midlife frailty among U.S. military veterans
Bourassa, K. J., Dillon, K. H., Rodriguez, R. L., Garrett, M. E., Anderson, L., Dennis, P. A., Moffitt, T. E., Caspi, A., Cohen, H. J., Hall, K. S. M., et al. (2025) · The Journals of Gerontology Series A · doi:10.1093/gerona/glaf255 · Cited by 2
Epigenetic signatures, age acceleration, and injury risk in elite female and male soccer players
Pérez, R. F., Lecumberri-Arteta, J., Kulis, M., Botta‐Orfila, T., Rodrı́guez-Vilarrupla, A., Yangüas, X., Ferrer, E., Rodas, G., & Martín-Subero, J. I. (2025) · Scientific Reports · doi:10.1038/s41598-025-25784-w · Cited by 3
Clinical description and epigenetic profiling of a new Danish OCD case-control cohort
Staunstrup, N. H., Starnawska, A., Bybjerg‐Grauholm, J., & Nissen, J. B. (2025) · Journal of Psychiatric Research · doi:10.1016/j.jpsychires.2025.12.003 · Cited by 2
Characterizing placental dysfunction with DNA methylation profiling and placental histopathology
Illing, H. J., Freedman, A. A., Beraldo, E. O., Keenan‐Devlin, L. S., Miller, G. E., Borders, A. E. B., Robinson, W. P., & Ernst, L. M. (2026) · Placenta · doi:10.1016/j.placenta.2026.02.008 · Cited by 2
Janssen, F. W., Gillis, A. J. M., Gouswaart, P. B., Kester, L. A., Takami, H., Ichimura, K., Eleveld, T. F., & Looijenga, L. H. J. (2026) · Communications Medicine · doi:10.1038/s43856-026-01587-6 · Cited by 2
DNA methylation in the placenta and household socioeconomic status: the SPAH study
Beraldo, E. O., Borders, A. E. B., Inkster, A. M., Ernst, L. M., Freedman, A. A., Kim, J., Keenan‐Devlin, L. S., Peñaherrera, M. S., Robinson, W. P., & Miller, G. E. (2026) · Clinical Epigenetics · doi:10.1186/s13148-026-02136-7 · Cited by 2
Peripheral blood DNA methylation profile and immune checkpoint inhibitor response in cancer patients
Kleinberger, M., Sunder-Plassmann, V., Starzer, A. M., Tomasich, E., Zierfuss, C., Niederdorfer, B., Berger, J. M., Gottmann, L., Henao, I. S., Korpan, M. I., et al. (2026) · ESMO Open · doi:10.1016/j.esmoop.2026.106940 · Cited by 2
Pfeiffer, J., Bustamante, A. C., Kim, G. S., Armstrong, D. L., Knodt, A. R., Koenen, K. C., Hariri, A. R., & Uddin, M. (2021) · Clinical Epigenetics · doi:10.1186/s13148-021-01056-y · Cited by 2
Mulvaney, R., Pan, Y., Zhao, N., Teles, F., Lu, J., Platz, E. A., Kelsey, K. T., & Michaud, D. S. (2024) · Cancer Epidemiology Biomarkers & Prevention · doi:10.1158/1055-9965.epi-24-0279 · Cited by 3
Grodstein, F., Lemos, B., Yang, J., Lopes, K. D. P., Vialle, R. A., Seyfried, N. T., Wang, Y., Shireby, G. L., Hannon, E. J., Thomas, A. J., et al. (2024) · Epigenetics · doi:10.1080/15592294.2024.2392050 · Cited by 2
Self-citationKristjansson, D., Lee, Y., Page, C. M., Gjessing, H. K., Magnus, M. C., Jugessur, A., Lyle, R., & Håberg, S. E. (2024) · Scientific Reports · doi:10.1038/s41598-024-73845-3 · Cited by 2
Profiling Genome-Wide Methylation Patterns in Cattle Infected with Ostertagia ostertagi
Boschiero, C., Beshah, E., Zhu, X., Tuo, W., & Liu, G. E. (2024) · International Journal of Molecular Sciences · doi:10.3390/ijms26010089 · Cited by 2
Exploring Differentially Methylated Genes among Preterm Birth and Full-Term Birth
Razzaq, A., Elkahlout, R., Nasrallah, G. K., et al. (2025) · Lifestyle Genomics · doi:10.1159/000543372 · Cited by 2
The Landscape of Prostate Tumor Methylation
Arbet, J., Yamaguchi, T. N., Shiah, Y.-J., Hugh-White, R., Wiggins, A., Oh, J., Zeltser, N., Gebo, T., Foucal, A., Lesurf, R., et al. (2026) · Cancer Discovery · doi:10.1158/2159-8290.cd-25-0761 · Cited by 2
Ota, V., Spíndola, L., Stavrum, A.-K., Costa, G. O., Bugiga, A., Noto, M. N., Carvalho, C. M., Lee, S. H., Lokmer, A., Goud, A. C., et al. (2025) · Progress in Neuro-Psychopharmacology and Biological Psychiatry · doi:10.1016/j.pnpbp.2025.111402 · Cited by 2
Cohen, N. J., Lesseur, C., Cardenas, A., Ward-Caviness, C. K., Spring, A. C., Rager, J. E., Fry, R. C., & Eaves, L. A. (2025) · Epigenomics · doi:10.1080/17501911.2025.2533115 · Cited by 2
Guidance for the design and analysis of cell-type-specific DNA methylation epidemiology studies
Walker, E., Dempster, E. L., Franklin, A., Klokkaris, A., Chioza, B. A., Davies, J. P., Blake, G. E. T., Burrage, J., Policicchio, S. S. S., Bamford, R. A., et al. (2025) · Briefings in Bioinformatics · doi:10.1093/bib/bbaf427 · Cited by 4
Self-citationA cell type enrichment analysis tool for brain DNA methylation data (CEAM)
Müller, J., Laroche, V., Imm, J. L., Weymouth, L. S., Harvey, J., Reijnders, R. A., Smith, A. R., van den Hove, D., Lunnon, K., Cavill, R., et al. (2025) · Epigenetics · doi:10.1080/15592294.2025.2604360 · Cited by 1
Self-citationAn Integrated Approach for Efficient Multi-Omics Joint Analysis
Tagliamonte, M. S., Waugh, S. G., Prosperi, M., & Mai, V. (2019) · ACM International Conference on Bioinformatics, Computational Biology, and Health Informatics (ACM-BCB) · doi:10.1145/3307339.3343476 · Cited by 2
Introduction to Data Types in Epigenomics
Marabita, F., Tegner, J. N., & Gómez-Cabrero, D. (2015) · Translational bioinformatics · doi:10.1007/978-94-017-9927-0_1 · Cited by 2
Report on the 2nd Annual Infinium Humanmethylation450 Array Workshop
Lowe, R., & Morris, T. J. (2013) · Epigenetics · doi:10.4161/epi.26073 · Cited by 2
Bioinformatics Tools in Epigenomics Studies
Bayón, G. F., Fernández, A. F., & Fraga, M. F. (2015) · Elsevier eBooks · doi:10.1016/b978-0-12-800140-0.00004-2 · Cited by 2
Evaluation and measurement of epigenetic modifications in population-based studies
Stirzaker, C., & Armstrong, N. J. (2021) · Elsevier eBooks · doi:10.1016/b978-0-12-820951-6.00014-4 · Cited by 2
Liu, Y., Wang, B., Shi, S., et al. (2021) · Future Oncology · doi:10.2217/fon-2020-1270 · Cited by 2
DNA methylation profiles unique to Kalahari KhoeSan individuals
Goncearenco, A., LaBarre, B. A., Petrykowska, H. M., Jaratlerdsiri, W., Bornman, R. M. S., Turner, S., Hayes, V. M., & Elnitski, L. L. (2020) · Epigenetics · doi:10.1080/15592294.2020.1809852 · Cited by 2
Innate fear responses are reflected in the blood epigenome of rhesus macaquesPreprint
Bravo-Rivera, H., Lardenoije, R., Merced, D., Mas‐Rivera, A., Ayala, J. E., Gonçalves, J. P., Seligowski, A. V., Jovanović, T., Ressler, K. J., Klengel, T., et al. (2020) · bioRxiv (Cold Spring Harbor Laboratory) · doi:10.1101/2020.11.05.369538 · Cited by 2
Foox, J., Nordlund, J., Lalancette, C., Gong, T., Lacey, M. R., Lent, S., Langhorst, B. W., Ponnaluri, V. K. C., Williams, L., Padmanabhan, K. R., et al. (2020) · bioRxiv (Cold Spring Harbor Laboratory) · doi:10.1101/2020.12.14.421529 · Cited by 2
DFT21: Discrete Fourier Transform in the 21st centuryPreprint
Pal, P., Banerjee, S., Ghosh, A., et al. (2021) · doi:10.36227/techrxiv.16543521.v1 · Cited by 2
The application of epiphenotyping approaches to DNA methylation array studies of the human placentaPreprint
Khan, A., Inkster, A. M., Peñaherrera, M. S., King, S., Kildea, S. V., Oberlander, T. F., Olson, D. M., Vaillancourt, C., Brain, U. M., Beraldo, E. O., et al. (2023) · Research Square · doi:10.21203/rs.3.rs-3069705/v1 · Cited by 2
Antidepressant Exposure and DNA Methylation: Insights from a Methylome-Wide Association StudyPreprint
Davyson, E., Shen, X., Huider, F., Adams, M. J., Borges, K., McCartney, D. L., Barker, L., van Dongen, J., Boomsma, D. I., Weihs, A., et al. (2024) · medRxiv · doi:10.1101/2024.05.01.24306640 · Cited by 2
Self-citationLeveraging epigenetic signatures to determine the cell-type of origin from long read sequencing dataPreprint
Hannon, E. J., & Mill, J. S. (2024) · bioRxiv (Cold Spring Harbor Laboratory) · doi:10.1101/2024.06.03.597114 · Cited by 2
Self-citationModelling medulloblastoma pathogenesis and treatment in human cerebellar organoidsPreprint
Willott, T., Nicholson, J. G., Xiao, Y., Ogunbiyi, O. K., Draper, B., Mistry, T., Donovan, L., Zabet, N. R., Merve, A., Badodi, S., et al. (2024) · bioRxiv (Cold Spring Harbor Laboratory) · doi:10.1101/2024.08.14.607977 · Cited by 2
Wang, Z., Wallace, D. A., Spitzer, B., Huang, T.-Y., Taylor, K., Rotter, J., Rich, S. S., Liu, P. Y., Daviglus, M., Hou, L.-F., et al. (2024) · medRxiv · doi:10.1101/2024.09.04.24313008 · Cited by 2
Guidance for the design and analysis of cell-type specific epigenetic epidemiology studiesPreprint
Walker, E., Dempster, E. L., Franklin, A., Klokkaris, A., Chioza, B. A., Davies, J. P., Blake, G. E. T., Burrage, J., Policicchio, S. S. S., Bamford, R. A., et al. (2024) · bioRxiv (Cold Spring Harbor Laboratory) · doi:10.1101/2024.11.06.621949 · Cited by 2
Self-citationUnraveling the Single-Cell Spatial Landscapes of Melanoma Brain MetastasesPreprint
Manukyan, A., Peters, K., Radbruch, H., Roßner, F., Geserick, F., Roßner, F., Lehmann, A., Altmüller, J., Conrad, T., Altmüller, J., et al. (2025) · SSRN Electronic Journal · doi:10.1101/2025.08.29.25334740 · Cited by 2
Porter, T., Armstrong, A. M., Milicic, L., Vacher, M. A., Fernandez, S., O’Brien, E. K., Doré, V., Bourgeat, P., Shishegar, R., Xia, Y., et al. (2025) · Research Square · doi:10.21203/rs.3.rs-7540786/v1 · Cited by 2
Modeling medulloblastoma pathogenesis and treatment in human cerebellar organoidsPreprint
Willott, T., Nicholson, J. G., Zhang, X., Xiao, Y., Ogunbiyi, O. K., Draper, B., Mistry, T., Donovan, L., Merve, A., Zabet, N. R., et al. (2026) · Genes & Development · doi:10.1101/gad.353292.125 · Cited by 2
Ruiz-Arenas, C., Abarrategui, L., Hernández-Ferrer, C., Escribà-Montagut, X., Pelegrí-Sisó, D., Ryser-Welch, P., Vrijheid, M., Bustamante, M., Gražulevičienė, R., Lepeule, J., et al. (2023) · Epigenetics · doi:10.1080/15592294.2023.2230670 · Cited by 1
El-Hossary, N., El-Desouky, M. A., Sabry, G. M., Omar, M. F., Ali, M. Y., Elzayat, M. G., Hassan, R. E., Mohamed, R. H., & Rashidi, F. B. (2024) · Forensic Science International · doi:10.1016/j.forsciint.2024.112247 · Cited by 2
Baldrighi, G. N., Cavagnola, R., Sacco, D., Costantino, L., Bernardinelli, L., & Gentilini, D. (2024) · Multiple Sclerosis Journal - Experimental, Translational and Clinical · doi:10.1177/20552173241296726 · Cited by 2
Lie, I. H., Tan, M. M. X., Andersen, M. S., Toft, M., & Pihlstrøm, L. (2025) · Annals of Clinical and Translational Neurology · doi:10.1002/acn3.52292 · Cited by 1
Navarro-Delgado, E. I., Czamara, D., Edwards, K., Fu, M. P., Merrill, S., Konwar, C., MacIsaac, J., Lin, D. T. S., Mandhane, P., Simons, E., et al. (2025) · bioRxiv · doi:10.1186/s13059-025-03864-4 · Cited by 1
Posttraumatic Stress Disorder, Obesity, and Epigenetic Aging: A Replication Study in 1828 Veterans
Bourassa, K. J., Garrett, M. E., Workgroup, V. M.-A. M., Ashley‐Koch, A. E., Beckham, J. C., & Kimbrel, N. A. (2025) · Psychosomatic Medicine · doi:10.1097/psy.0000000000001397 · Cited by 2
Immune DNA methylation in depression: cross-sectional and longitudinal study
Herrera-Rivero, M., Nauck, M., Berger, K., & Baune, B. T. (2025) · BJPsych Open · doi:10.1192/bjo.2025.10065 · Cited by 2
Epigenetic and Structural Brain Aging and Their Associations With Major Depressive Disorder
Xu, E. Y., Green, C., McCartney, D. L., Han, L. K. M., Evans, K. L., Walker, R. M., Gadd, D. A., Steele, J. D., Waiter, G. D., Campbell, A., et al. (2025) · Biological Psychiatry Global Open Science · doi:10.1016/j.bpsgos.2025.100577 · Cited by 1
Liu, Y., Vukić, M., Hannon, E. J., Mei, H., Walker, E., Sinke, L., Mill, J. S., Daxinger, L., & Heijmans, B. T. (2025) · Molecular Psychiatry · doi:10.1038/s41380-025-03283-8 · Cited by 1
Self-citationPalmer, A. S., García-Domínguez, E., Taylor, M. F., et al. (2025) · Skeletal Muscle · doi:10.1186/s13395-025-00396-0 · Cited by 1
Jiang, X., Mahroo, O. A., Khawaja, A. P., Skowronska‐Krawczyk, D., Mackey, D. A., Wiggs, J. L., Hammond, C. J., Hysi, P. G., & Bell, C. G. (2025) · Epigenetics · doi:10.1080/15592294.2025.2566496 · Cited by 1
Ross, J. P., Varley, B. J., Wells, J., Yeh, R. P. L., Pickett, H. A., Vasireddy, R. S., Roberts, L., Davis, G. K., Henry, A., Craig, M. E., et al. (2025) · Clinical Epigenetics · doi:10.1186/s13148-025-02029-1 · Cited by 2
DNA methylation-mediated extracellular matrix gene silencing in colorectal cancer
Menyhárt, O., Müller, D., & Győrffy, B. (2026) · Seminars in Oncology · doi:10.1016/j.seminoncol.2026.152469 · Cited by 1
Genetic regulation of methylation across East Asian and European populations
Liu, R.-Z., Chen, T.-T., Xia, Y., Lin, S.-C., Ge, T., Chen, C.-Y., Feng, Y. A., Huang, H.-L., & Lin, Y.-F. (2026) · Nature Communications · doi:10.1038/s41467-026-69372-6 · Cited by 1
Epigenetic age acceleration in young adults with congenital heart disease
Jain, P., Zhuang, B. C., Whitehead, J., MacIsaac, J. L., Dever, K., Gahm, M., Ermis, P. R., McDade, T. W., Kobor, M. S., & Checchia, P. A. (2026) · Clinical Epigenetics · doi:10.1186/s13148-026-02049-5 · Cited by 1
Guo, Y., You, Y., Guan, X., Yin, Y., Yin, Z., Zhong, G., Jia, C., Wen, Y., Li, W., Zhao, H., et al. (2026) · Journal of Hazardous Materials · doi:10.1016/j.jhazmat.2026.141727 · Cited by 1
Ontology-aware DNA methylation classification with a curated atlas of human tissues and cell types
Kim, M., Dannenfelser, R., Cui, Y., Allen, G. I., & Yao, V. (2026) · Cell Reports Methods · doi:10.1016/j.crmeth.2026.101328 · Cited by 1
Accelerated Epigenetic Aging in Veterans Exposed to Blast
Martindale, S. L., Bourassa, K. J., Kimbrel, N. A., Beckham, J. C., Garrett, M. E., Ashley‐Koch, A. E., & Rowland, J. A. (2026) · Journal of Head Trauma Rehabilitation · doi:10.1097/htr.0000000000001159 · Cited by 1
Differences in heart DNA methylation between sudden infant death syndrome and other sudden deaths
Aldridge, C., Normeshie, C. A., Hauck, F. R., et al. (2026) · Clinical Epigenetics · doi:10.1186/s13148-026-02103-2 · Cited by 1
Bruellman, R., Evans, D., Smolen, A., Evans, L. M., & Reynolds, C. A. (2026) · Epigenetics · doi:10.1080/15592294.2026.2653960 · Cited by 1
Liu, T., Loo, L. W. M., Huang, B. Z., Quon, B. K., Guillermo, C., Siegmund, K. D., Wilkens, L. R., Maunakea, A. K., Hecht, S. S., Murphy, S. E., et al. (2026) · Clinical Epigenetics · doi:10.1186/s13148-026-02137-6 · Cited by 1
DNA methylation profiling in Huntington’s disease reveals disease associated changes in the striatum
Wheildon, G., Smith, A. R., Weymouth, L. S., Harvey, J., Kouhsar, M. P., MacBean, L. F., Troakes, C., Pishva, E., Smith, R. G., & Lunnon, K. (2026) · Clinical Epigenetics · doi:10.1186/s13148-026-02082-4 · Cited by 2
Self-citationProtein epigenetic scores derived in neonatal saliva as biomarkers of childhood cognition
Smikle, R., McKinnon, K. I. M., Vaher, K., Turner, H. L., Cruickshank, H., Amir, R., Chua, Y. W., Conole, E. L. S., Reynolds, R. M., Batty, G. D., et al. (2026) · Molecular Psychiatry · doi:10.1038/s41380-026-03702-4 · Cited by 2
Optimised fluorescence-activated nuclei sorting for epigenomic analysis of cortical cell types
Chioza, B. A., Policicchio, S. S. S., Burrage, J., Blake, G. E. T., Bamford, R. A., Franklin, A., Soanes, D. M., Wells, P. M., Babtie, A. C., Payan, M. F., et al. (2026) · PLoS ONE · doi:10.1371/journal.pone.0359643 · Cited by 6
Self-citationIdentifying microRNAs related to Alzheimer's disease from differential methylation signatures
Roy, A., & Bhattacharyya, M. (2016) · Gene Reports · doi:10.1016/j.genrep.2016.04.006 · Cited by 1
Pfeiffer, J., van Rooij, S. J. H., Mekawi, Y., Fani, N., Jovanović, T., Michopoulos, V., Smith, A. K., Stevens, J. S., & Uddin, M. (2022) · Frontiers in Psychiatry · doi:10.3389/fpsyt.2022.892302 · Cited by 1
Louise, J., Deussen, A. R., & Dodd, J. M. (2023) · PeerJ · doi:10.7717/peerj.14786 · Cited by 1
Wei, X., Hu, W., & Mao, K. (2023) · Medicine · doi:10.1097/md.0000000000032766 · Cited by 1
Ma, Z., Han, H., Zhou, Z., et al. (2023) · IUBMB Life · doi:10.1002/iub.2768 · Cited by 1
Ng, J. W. Y., Felix, J. F., & Olson, D. M. (2023) · BMC Medicine · doi:10.1186/s12916-023-03168-z · Cited by 1
García-Carmona, S., Falfán‐Valencia, R., Fernández-López, J. C., Ramírez‐Venegas, A., Morales‐González, F., Ramírez-Díaz, M. E., Cruz-Vicente, F., Martínez-Gómez, M. D. L., Hernández-Zenteno, R. D. J., Fricke-Galindo, I., et al. (2025) · Epigenomics · doi:10.1080/17501911.2025.2535966 · Cited by 1
Sex-Specific Factors Influencing GrimAge Acceleration in Middle-Aged Korean Adults
Kim, S., & Park, J. (2025) · Biological Research For Nursing · doi:10.1177/10998004251370671 · Cited by 1
Delineating blood DNA methylation biomarkers for Alzheimer's disease
Pishva, E., Bertram, L., & Lunnon, K. (2025) · Alzheimer s & Dementia · doi:10.1002/alz.70646
Self-citationFornage, M., Tarraf, W., Xia, R., Ordonez, A., Sofer, T., Márquez, F., Thyagarajan, B., Talavera, G. A., Gallo, L. C., DeCarli, C. S., et al. (2025) · Aging · doi:10.18632/aging.206317 · Cited by 1
5-Methycytosine and 5-Hydroxymethylcytosine in Psychiatric Epigenetics
Grayson, D. R., & Guidotti, A. (2014) · Elsevier eBooks · doi:10.1016/b978-0-12-417114-5.00010-3 · Cited by 1
Beach, S. R. H., Lei, M., Simons, R. L., Dogan, M. V., Gibbons, F. X., & Philibert, R. A. (2018) · American Journal of Medical Genetics Part B Neuropsychiatric Genetics · doi:10.1002/ajmg.b.32624 · Cited by 1
Krishnan, N. M., Mohanraj, I., Hariharan, J., et al. (2018) · JCO Clinical Cancer Informatics · doi:10.1200/cci.17.00045 · Cited by 1
Methods to study exercise and sports epigenetics
Khoury, L. Y. E. (2021) · Elsevier eBooks · doi:10.1016/b978-0-12-820682-9.00001-3 · Cited by 1
Epigenetics in mental and neurodegenerative disorders
Iatrou (2018) · Research Publications (Maastricht University) · doi:10.26481/dis.20180712ai · Cited by 1
An Unsupervised Learning Method for Disease Classification Based on DNA Methylation SignaturesPreprint
Firouzi, M., Turinsky, A. L., Choufani, S., Siu, M. T., Weksberg, R., & Brudno, M. (2018) · bioRxiv (Cold Spring Harbor Laboratory) · doi:10.1101/492926 · Cited by 1
Are methylation beta-values simplex distributed?Preprint
Nonell, L., & González, J. R. (2019) · bioRxiv (Cold Spring Harbor Laboratory) · doi:10.1101/753459 · Cited by 1
Hannon, E. J., Dempster, E. L., Mansell, G., Burrage, J., Bass, N. J., Bohlken, M. M., Corvin, A. P., Curtis, C. J. C., Dempster, D. W., Forta, M. D., et al. (2020) · bioRxiv (Cold Spring Harbor Laboratory) · doi:10.1101/2020.04.05.026211 · Cited by 1
Self-citationMethionine stress induces a ferroptotic gene signature in methionine dependent cancer cellsPreprint
Wallis, K., Bird, J. T., Gies, A. J., Mackintosh, S. G., Tackett, A. J., Byrum, S. D., & Miousse, I. R. (2020) · bioRxiv (Cold Spring Harbor Laboratory) · doi:10.1101/2020.08.18.254490 · Cited by 1
The Telomere Length Landscape of Prostate CancerPreprint
Livingstone, J. M., Shiah, Y.-J., Yamaguchi, T. N., Heisler, L. E., Huang, V., Lesurf, R., Gebo, T., Carlin, B., Eng, S. E., Drysdale, E., et al. (2021) · bioRxiv (Cold Spring Harbor Laboratory) · doi:10.1101/2021.05.22.445239 · Cited by 1
Alpha-synuclein induces epigenomic dysregulation of glutamate signaling and locomotor pathwaysPreprint
Schaffner, S. L., Wassouf, Z., Lázaro, D. F., Xylaki, M., Gladish, N., Lin, D. T. S., MacIsaac, J. L., Ramadori, K. E., Schulze-Hentrich, J. M., Outeiro, T. F., et al. (2021) · bioRxiv (Cold Spring Harbor Laboratory) · doi:10.1101/2021.06.12.448150 · Cited by 1
Shen, X., Caramaschi, D., Adams, M. J., Walker, R. M., Min, J. L., Kwong, A. S. F., Hemani, G., Barbu, M. C., Whalley, H. C., Harris, S. E., et al. (2021) · medRxiv · doi:10.1101/2021.06.30.21259731 · Cited by 1
Suggestions for Assessing Economic and Demographic Effects of Income Maintenance Programs
DaVanzo, J., & Greenberg, D. H. (1973) · Cited by 1
DFT21: Discrete Fourier Transform in the 21st centuryPreprint
Pal, P., Banerjee, S., Ghosh, A., et al. (2021) · doi:10.36227/techrxiv.16543521 · Cited by 1
Decoding molecular programs in melanoma brain metastasesPreprint
Radke, J., Schumann, E., Onken, J., Koll, R., Acker, G., Bodnar, B., Senger, C., Tierling, S., Möbs, M., Vajkoczy, P., et al. (2022) · medRxiv · doi:10.1101/2022.02.06.22270509 · Cited by 1
Metadata
- Authors
- Pidsley, R., Y Wong, C. C., Volta, M., Lunnon, K., Mill, J., & Schalkwyk, L. C.
- Affiliations
- King's College London (GB)
- Corresponding author
- Schalkwyk, Leonard C
- Venue
- BMC Genomics
- Published
- 2013-05-01
- Volume
- 14
- Issue
- 1
- Pages
- 293-293
- ISSN
- 1471-2164 (ISSN-L)
- PMC
- PMC3769145
- OpenAlex
- W2119883345
- Semantic Scholar
- d6780662d62ce843992ea64f68c71fc50c1a2c37
- Cited by
- 1,143
- References
- 24
- Citations by year
- 2026: 74 · 2025: 97 · 2024: 102 · 2023: 109 · 2022: 112 · 2021: 141 · 2020: 94 · 2019: 70 · 2018: 76 · 2017: 94 · 2016: 71 · 2015: 60 · 2014: 33 · 2013: 7
- FWCI
- 22.99
- Type
- journal article
- Language
- en
- Open access
- gold
- doi.org
- Licence
- cc-by
- Locations
- BMC Genomics (publishedVersion, cc-by)
- PubMed (publishedVersion)
- Open Access at Essex (University of Essex) (acceptedVersion, cc-by)
- Europe PMC (PubMed Central) (submittedVersion, cc-by)
- PubMed Central (submittedVersion, cc-by)
- Figshare (submittedVersion)
- Research Portal (King's College London) (submittedVersion, other-oa)
- Open Research Exeter (University of Exeter) (submittedVersion, cc-by)
- Funders
- American Asthma Foundation
- National Institutes of Health
- Medical Research Council
- National Institute on Aging (R01AG036039)
- Topics
- Life Sciences › Biochemistry, Genetics and Molecular Biology › Molecular Biology › Epigenetics and DNA Methylation
- Life Sciences › Biochemistry, Genetics and Molecular Biology › Molecular Biology › Gene expression and cancer classification
- Life Sciences › Biochemistry, Genetics and Molecular Biology › Genetics › Genetic Syndromes and Imprinting
- Keywords
- DNA methylation, quantile normalization, genomic imprinting, X chromosome inactivation, data quality metrics, watermelon, R package, statistical power
- MeSH terms
- Humans, Statistics as Topic, Genomic Imprinting, DNA Methylation, Computational Biology, Oligonucleotide Array Sequence Analysis, Polymorphism, Single Nucleotide, Chromosomes, Human, X
About these checks
Registry, retraction, Cites and statistics results are computed, not judged, with one exception: a printed reference that no index lists is read once by a model before it counts as a citation error. Claims are extracted by a model and kept only when their quote appears verbatim in the text; each cited source is then checked, with a model’s help, for whether it says what the claim relies on. Those verdicts can be wrong — read the claim’s quote and the cited source before relying on one.
A language model drew the claims from the paper on 2026-10-18, under version 3 of the claim definition (model deepseek-v4.1-flash, prompt extract-v3).
A second model labelled each claim on 2026-10-18 (model jev-1.13-20260917, definition revision gold-guideline-v0.2).
Cited sources are checked with a language model’s help (gpt-6-sol).
Statistics and arithmetic are recomputed, not judged.
Confidence bands are shown only for fields calibrated on our annotated test set. None is calibrated yet, so no band is shown.
What counts as a claim ›How we measure confidence ›How we check this ›
Are you an author, or do you see a problem with this page? Request a review
