

The DOI matches its Crossref record; 35 of the 35 references it cites were found in a registry or an index.
Age-dependent alterations of monocyte subsets and monocyte-related chemokine pathways in healthy adults
Open accessAbstract
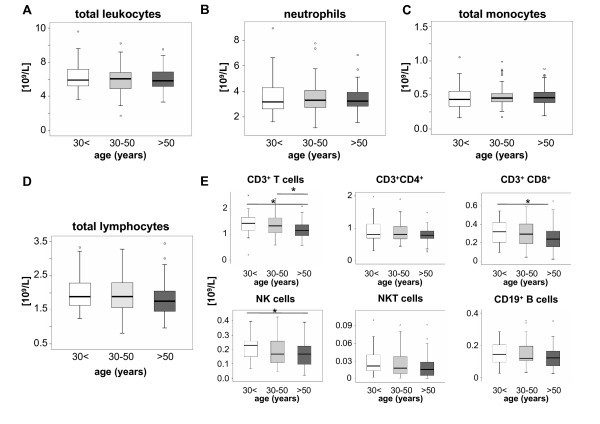
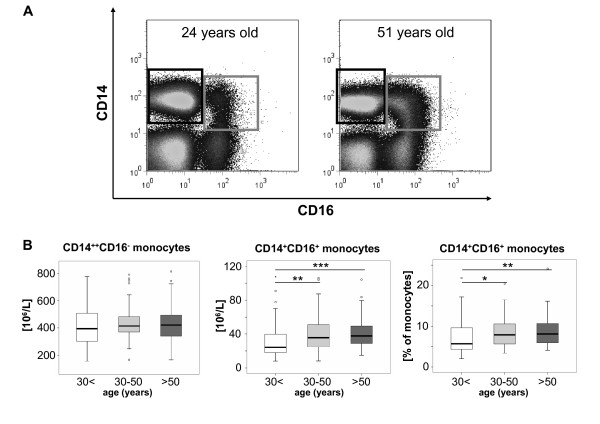
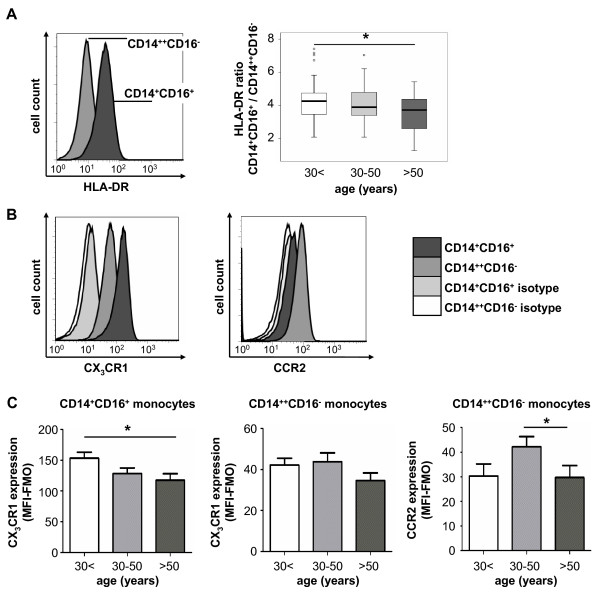
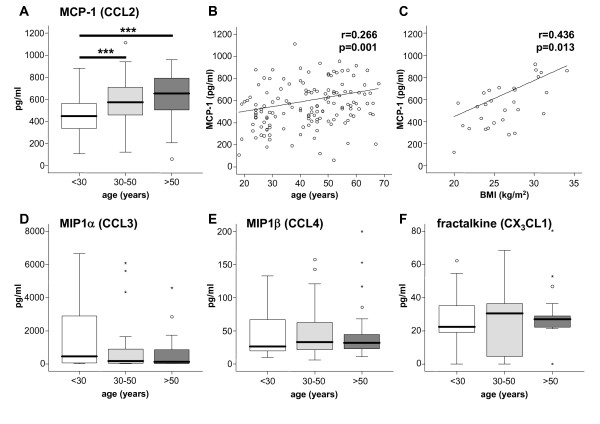
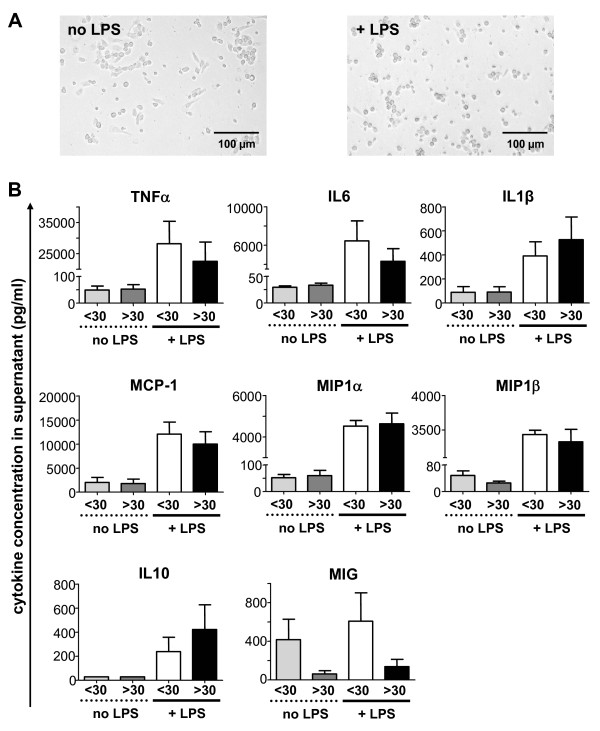
Background: Recent experimental approaches have unraveled essential migratory and functional differences of monocyte subpopulations in mice. In order to possibly translate these findings into human physiology and pathophysiology, human monocyte subsets need to be carefully revisited in health and disease. In analogy to murine studies, we hypothesized that human monocyte subsets dynamically change during ageing, potentially influencing their functionality and contributing to immunosenescence. Results: Circulating monocyte subsets, surface marker and chemokine receptor expression were analyzed in 181 healthy volunteers (median age 42, range 18-88). Unlike the unaffected total leukocyte or total monocyte counts, non-classical CD14 + CD16 + monocytes significantly increased with age, but displayed reduced HLA-DR and CX 3 CR1 surface expression in the elderly. Classical CD14 ++ CD16 - monocyte counts did not vary dependent on age. Serum MCP-1 (CCL2), but not MIP1α (CCL3), MIP1β (CCL4) or fractalkine (CX 3 CL1) concentrations increased with age. Monocyte-derived macrophages from old or young individuals did not differ with respect to cytokine release in vitro at steady state or upon LPS stimulation. Conclusions: Our study demonstrates dynamic changes of circulating monocytes during ageing in humans. The expansion of the non-classical CD14 + CD16 + subtype, alterations of surface protein and chemokine receptor expression as well as circulating monocyte-related chemokines possibly contribute to the preserved functionality of the monocyte pool throughout adulthood.
Overview
The claims and statistics of this paper haven’t been checked yet.
Run the check — free, no account needed. It reads the open-access text and checks the sources it cites.
Integrity signals
Registry
Cites
Statistics
Figures
Verification
Claims the paper makes
The claims and statistics of this paper haven’t been checked yet.
Run the check — free, no account needed. It reads the open-access text and checks the sources it cites.
Claims other papers make about this one
Each is checked against this paper’s own text: does it say what the citing paper says it does?
In the citing paper
“Monocyte populations shift in the elderly, and there is an accumulation of non-classical monocytes that significantly downregulate HLA-DR123.”
From SARS-CoV-2, COVID-19 and the aging immune system (2021) · cites this paper as [123]
Self-check
Percentages, sums and reported differences re-computed from the paper’s own numbers.
The self-check needs the paper’s full text.
Citations
Cites
Blood Monocytes Consist of Two Principal Subsets with Distinct Migratory Properties
Geissmann, F., Jung, S., & Littman, D. R. (2003) · Immunity · doi:10.1016/s1074-7613(03)00174-2 · Cited by 3,504
Development of Monocytes, Macrophages, and Dendritic Cells
Geissmann, F., Manz, M. G., Jung, S., Sieweke, M. H., Merad, M., & Ley, K. (2010) · Science · doi:10.1126/science.1178331 · Cited by 3,049
Kanda, H. (2006) · Journal of Clinical Investigation · doi:10.1172/jci26498 · Cited by 2,682
Nahrendorf, M., Swirski, F. K., Aikawa, E., Stangenberg, L., Wurdinger, T., Figueiredo, J.-L., Libby, P., Weissleder, R., & Pittet, M. J. (2007) · The Journal of Experimental Medicine · doi:10.1084/jem.20070885 · Cited by 2,300
Identification of splenic reservoir monocytes and their deployment to inflammatory sites
Swirski, F. K., Nahrendorf, M., Etzrodt, M., Wildgruber, M., Cortez-Retamozo, V., Panizzi, P., Figueiredo, J.-L., Kohler, R. H., Chudnovskiy, A., Waterman, P., et al. (2009) · Science · doi:10.1126/science.1175202 · Cited by 2,221
Monitoring of Blood Vessels and Tissues by a Population of Monocytes with Patrolling Behavior
Auffray, C., Fogg, D., Garfa, M., Elain, G., Join-Lambert, O., Kayal, S., Sarnacki, S., Cumano, A., Lauvau, G., & Geissmann, F. (2007) · Science · doi:10.1126/science.1142883 · Cited by 1,973
Blood Monocytes: Development, Heterogeneity, and Relationship with Dendritic Cells
Auffray, C., Sieweke, M. H., & Geissmann, F. (2009) · Annual Review of Immunology · doi:10.1146/annurev.immunol.021908.132557 · Cited by 1,745
Serbina, N. V., & Pamer, E. G. (2006) · Nature Immunology · doi:10.1038/ni1309 · Cited by 1,658
Tacke, F., Alvarez, D., Kaplan, T. J., Jakubzick, C., Spanbroek, R., Llodra, J., Garin, A., Liu, J., Mack, M., van Rooijen, N., et al. (2007) · Journal of Clinical Investigation · doi:10.1172/jci28549 · Cited by 1,323
Self-citationTsou, C.-L., Peters, W., Si, Y., Slaymaker, S., Aslanian, A. M., Weisberg, S. P., Mack, M., & Charo, I. F. (2007) · Journal of Clinical Investigation · doi:10.1172/jci29919 · Cited by 1,152
Cited by
Sorted by citations
Items 301–388 of 388
Djuanda, S. D., Lembar, S., Hidajat, I. J., & Djuanda, D. (2021) · Journal Of The Indonesian Medical Association · doi:10.47830/jinma-vol.70.12-2020-305 · Cited by 2
Torres, A., Marchioro, S. B., Ribeiro, M. B., de Morais, I. R. B., Freire, S. M., & Nascimento, R. J. M. (2021) · Critical Reviews in Immunology · doi:10.1615/critrevimmunol.2021039675 · Cited by 2
Lu, C., Donners, M. M. P. C., de Baaij, J. B. J., Jin, H., Otten, J. J. T., Manca, M., van Zonneveld, A. J., Jukema, J. W., Kraaijeveld, A. O., Kuiper, J., et al. (2024) · Frontiers in Immunology · doi:10.3389/fimmu.2024.1286382 · Cited by 2
Herishanu, Y., Kay, S., Deutsch, V. R., Ben‐Ezra, J. M., Naparstek, E., Perry, C., & Katz, B. (2013) · Blood · doi:10.1182/blood.v122.21.4724.4724 · Cited by 2
Environmental Influences on the Immune System: The Aging Immune System
Mälzer, J. N., Schulz, A. R., & Thiel, A. (2016) · Springer eBooks · doi:10.1007/978-3-7091-1890-0_3 · Cited by 2
Innate Immunosenescence and Its Impact on Health in Old Age
Tariq, M. A., Hazeldine, J., & Lord, J. M. (2016) · Springer eBooks · doi:10.1007/978-3-319-43365-3_1 · Cited by 2
Cheng, N., & Weng, N. (2019) · Springer eBooks · doi:10.1007/978-3-319-99375-1_108 · Cited by 2
Phenotypic and Functional Changes of Circulating Monocytes in Elderly
Ginaldi, L., & Martinis, M. D. (2019) · Springer eBooks · doi:10.1007/978-3-319-99375-1_26 · Cited by 2
Rahmani, E., Jordan, M. I., & Yosef, N. (2022) · Lecture notes in computer science · doi:10.1007/978-3-031-04749-7_32 · Cited by 2
Hematopoietic Aging Biomarkers in Peromyscus leucopus Mice
Lin, Z., Kajigaya, S., Feng, X., Chen, J., & Young, N. S. (2017) · Journal of Aging Science · doi:10.4172/2329-8847.1000169 · Cited by 2
Frailty in Old Age Is Associated with Altered Cytokine Production in Response to TLR Ligation
Compté, N., Pepersack, T., & Goriely, S. (2019) · Springer eBooks · doi:10.1007/978-3-319-99375-1_152 · Cited by 2
Rink, L., & Weßels, I. (2021) · Elsevier eBooks · doi:10.1016/b978-0-12-818731-9.00072-0 · Cited by 2
Ageing and its role in modulating healthy and tumour-associated macrophages
Duong, L., Jackaman, C., & Nelson, D. J. (2024) · Ageing and Cancer Research & Treatment · doi:10.37155/2972-4759-2024-02-01-1 · Cited by 1
Zhang, L., Chen, X., Xing, R., & Lu, Y. (2025) · BMC Immunology · doi:10.1186/s12865-025-00731-6 · Cited by 1
Matsui, H., Cervantes, M., Khalid, M. M., Tomusiak, A., Dwaraka, V. B., Landgrave-Gómez, J., Kumaar, P. V. A., Chen, Q. J. X., Lasky-Su, J. A., Stone, J., et al. (2026) · Aging Cell · doi:10.1111/acel.70393 · Cited by 1
Komaravolu, R. K., Chatterjee, N., Kumar, S., Allen, J. L., Durant, C. P., Wu, R., Valentin-Guillama, G. A., McSkimming, C. C., Drago, F., Taylor, A. M., et al. (2026) · Frontiers in Immunology · doi:10.3389/fimmu.2026.1749366 · Cited by 1
Bone biology in aging periodontal and peri‐implant tissues
Issa, D. R., Intini, G., & Clark, D. (2026) · Periodontology 2000 · doi:10.1111/prd.70035 · Cited by 1
Nummelin, J., Mattila, J., Middelkamp, V., Saramäki, J., Heikkilä, N., & Arstila, T. P. (2026) · The Journal of Immunology · doi:10.1093/jimmun/vkag214 · Cited by 1
Brain Aging and Cellular Senescence Trigger Neuroimmunological Dysregulation and Neurodegeneration
Vega-García, A., Apolinar, L. M., Feria-Romero, I. A., Campos‐Bedolla, P., Alberto, G.-G. C., Luna‐Munguía, H., Sofía, R.-H., & Orozco-Suárez, S. A. (2026) · Brain Sciences · doi:10.3390/brainsci16101019 · Cited by 1
Polymorphism rs7023923 and monocyte count in blood donors and coronary artery disease patients
Świrta, J. S., Krzemień-Grandys, M., Totoń‐Żurańska, J., Kuś, K., Olszanecki, R., Jawień, J., Wnuk, M. A., Słowik, A., Godlewski, J., Zmudka, K. F., et al. (2015) · Kardiologia Polska · doi:10.5603/kp.a2014.0238 · Cited by 1
Fibrocytes and Collagen-Producing Cells of the Peripheral Blood
Gomer, R. H., & Pilling, D. (2011) · WORLD SCIENTIFIC eBooks · doi:10.1142/9789814343725_0002 · Cited by 1
Minote, M., Sato, W., Kimura, K., Kimura, A., Lin, Y., Okamoto, T., Takahashi, R., & Yamamura, T. (2024) · Immunological Medicine · doi:10.1080/25785826.2024.2331271 · Cited by 1
Blood Monocytes and Their Subsets in Health and Disease
Ziegler‐Heitbrock, L. (2014) · Springer eBooks · doi:10.1007/978-1-4939-1311-4_1 · Cited by 1
Nanoparticles and their Current Potential Use to Detect Monocyte Subsets in Vivo
Lopez, M. R. (2019) · doi:10.31546/bbab.1002 · Cited by 1
Molecular and Cellular Aspects of Macrophage Aging
Lloberas, J., Tur, J., Vico, T., & Celada, A. (2017) · Springer eBooks · doi:10.1007/978-3-319-64597-1_46-1 · Cited by 1
Age- and Race-Related Changes in Subpopulations of Peripheral Blood Lymphocytes in Humans
Hooten, N. N., Longo, D. L., & Evans, M. K. (2019) · Springer eBooks · doi:10.1007/978-3-319-99375-1_85 · Cited by 1
Phenotypic and Functional Changes of Circulating Monocytes in Elderly
Ginaldi, L., & Martinis, M. D. (2018) · Springer eBooks · doi:10.1007/978-3-319-64597-1_26-1 · Cited by 1
Loots, S. (2013) · SUNScholar (Stellenbosch University) · Cited by 1
Macrophages: the overlooked target for pulmonary fibrosis and COPD
Boorsma, C. E. (2016) · University of Groningen research database (University of Groningen / Centre for Information Technology) · Cited by 1
Greenwood, H. L. (2014) · University of Birmingham Institutional Research Archive (University of Birmingham) · Cited by 1
Human Cytomegalovirus as a driving force towards Immunosenescence
Zadražil, Z. (2018) · doi:10.32657/10356/73417 · Cited by 1
Hereditary angioedema: modification of clinical manifestations with androgens.
Davis, P. J., Davis, F. B., & Charache, P. (1976) · PubMed · Cited by 1
Hackenhaar, F. S., Josefsson, M., Adolfsson, A. N., Landfors, M., Kauppi, K., Porter, T., Milicic, L., Laws, S. M., Hultdin, M., Adolfsson, R., et al. (2022) · Research Square · doi:10.21203/rs.3.rs-2276882/v2 · Cited by 1
Relation of CMV and Brain Atrophy to Trajectories of Immunosenescence in Diverse PopulationsPreprint
Touil, H., Luquez, T., Comandante-Lou, N., Lee, A., Fujita, M., Habeck, C. G., Kroshilina, A., Hegewisch-Solloa, E., McInvale, J. J., Zuroff, L. R., et al. (2024) · SSRN Electronic Journal · doi:10.1101/2024.10.07.614568 · Cited by 1
Produção de citocinas pelos monócitos de idosos com estomatite protética associada a Candida
Faria, P. F. (2011) · Digital Library of Theses and Dissertations (Universidade de São Paulo) · doi:10.11606/t.25.2011.tde-13122011-170926
Mechanisms underlying innate immunesenescence
Hazeldine, J. (2013) · University of Birmingham Institutional Research Archive (University of Birmingham)
The role of innate immune cells in ocular ageing and pathological neovascularisation
Robbie, S. J. (2012) · UCL Discovery (University College London)
Innate Immune Responses in the Geriatric Population
Compt, N., & Goriely, S. (2012) · InTech eBooks · doi:10.5772/37878
Sampangi, S. (2015) · QUT ePrints (Queensland University of Technology)
The Aging Immune System, Vaccine Efficacy, and the Lung
Bartley, J. M., & Haynes, L. (2015) · WORLD SCIENTIFIC eBooks · doi:10.1142/9789814635011_0009
The aging immune system and nutritional interventions
van Beek, A. A. (2017) · doi:10.18174/392235
Monocytes and Macrophages in the Aged Lung and Heart
Thoman, M. L., Bray, W., & Linton, P. (2017) · Springer eBooks · doi:10.1007/978-3-319-64597-1_94-1
Frailty in Old Age is Associated with Altered Cytokine Production in Response to TLR Ligation
Compté, N., Pepersack, T., & Goriely, S. (2017) · Springer eBooks · doi:10.1007/978-3-319-64597-1_152-1
Cheng, N., & Weng, N. (2018) · Springer eBooks · doi:10.1007/978-3-319-64597-1_108-1
Dias, R. (2013) · Portuguese National Funding Agency for Science, Research and Technology (RCAAP Project by FCT) · doi:10.34626/1gc0-6d43
A Study of Macrophages in the Aging Liver and in the Host Response to Engineered Lung Scaffolds
Stahl, E. C. (2019) · D-Scholarship@Pitt (University of Pittsburgh)
Moura, R. A., Oliveira‐Ramos, F., Marques, C., Brito, A., Teixeira, R. L., Romão, V. C., Campanilho‐Marques, R., Teixeira, V. S., Saavedra, M. J., Ponte, C., et al. (2019) · Annals of the Rheumatic Diseases · doi:10.1136/annrheumdis-2019-eular.7201
AGED MUSCLE ECM RECAPITULATES ALTERED HOST RESPONSE OBSERVED IN AGED MUSCLE INJURY
LoPresti, S. T. (2019) · D-Scholarship@Pitt (University of Pittsburgh)
Thromboembolic disease: a geriatric syndrome
Galdi, F., Pedone, C., & Incalzi, R. A. (2020) · Journal of Gerontology and Geriatrics · doi:10.36150/2499-6564-437
Rodríguez, R., & Johanna, I. (2021)
Relationship between red blood cell aging and intracellular chemokine storage
Ogasawara, S., Saito, N., Minakawa, S., Akasaki, T., & Kayaba, H. (2021) · Institutional Repositories DataBase (IRDB) · doi:10.32216/hirosakiigaku.71.2-4_113
Impact of physical activity on immune function and inflammation in the elderly
Bartlett, D. B. (2014) · University of Birmingham Institutional Research Archive (University of Birmingham)
Aging does not affect calcium response to CCL2 and LPS in human monocytes
Arellano-Cruz, B. D. J., Vázquez-Prieto, M. D. L. Á., Fernández-Eufrasio, N. B., Montiel-Condado, D., Patiño‐López, G., Garibay‐Escobar, A., & Sumoza‐Toledo, A. (2021) · Human Immunology · doi:10.1016/j.humimm.2021.11.004
Altern messen – Biomarker des Alterungsprozesses
Weber, B., Heddergott, C., Juchem, N., & Menzel, A. (2022) · Springer eBooks · doi:10.1007/978-3-662-61417-4_2
Rensing, L., & Rippe, V. (2013) · Springer eBooks · doi:10.1007/978-3-642-37733-4_7
Ageing and Mild Cognitive Impairment (MCI)
Crichton, R. R., & Ward, R. J. (2013) · Wiley eBooks · doi:10.1002/9781118553480.ch05
Monocytes and Macrophages in the Aged Lung and Heart
Thoman, M. L., Bray, W., & Linton, P. (2019) · Springer eBooks · doi:10.1007/978-3-319-99375-1_94
The Immunological Epigenetic Landscape of the Human Life Trajectory
Juříčková, I., Hudec, M., Votava, F., Vosáhlo, J., Ovsepian, S. V., Černá, M., & O’Leary, V. B. (2022) · Biomedicines · doi:10.3390/biomedicines10112894
Hackenhaar, F. S., Josefsson, M., Adolfsson, A. N., Landfors, M., Kauppi, K., Porter, T., Milicic, L., Laws, S. M., Hultdin, M., Adolfsson, R., et al. (2022) · Research Square · doi:10.21203/rs.3.rs-2276882/v1
Hackenhaar, F. S., Josefsson, M., Adolfsson, A. N., Landfors, M., Kauppi, K., Porter, T., Milicic, L., Laws, S. M., Hultdin, M., Adolfsson, R., et al. (2023) · Research Square · doi:10.21203/rs.3.rs-2276882/v4
Sundaram, K. R. M., Alwar, T., Prakash, A., Murugan, G., Mahesh Kumar, K., & Silambanan, S. (2023) · Journal of Research in Clinical Medicine · doi:10.34172/jrcm.2023.33294 · Cited by 1
Rosandy, M. G., Kalim, H., Wahono, C. S., & Handono, K. (2023) · Syntax Literate Jurnal Ilmiah Indonesia · doi:10.36418/syntax-literate.v8i12.14584
Causal role of immune cells in ovarian dysfunction :a mendelian randomization studyPreprint
Weng, R., Ling, S., Dai, Y., Li, Y., Zhou, Z., Wu, W., Ren, C., Zhang, L., Wu, H., Bai, M., et al. (2024) · Research Square · doi:10.21203/rs.3.rs-3991335/v1
Investigation and description of the New Brain and New Mind hypotheses
Klinedinst, B. S. (2021) · doi:10.31274/td-20240329-457
Laboratory parameters in male and female older people
Scola, L., Bellia, C., & Lio, D. (2025) · Elsevier eBooks · doi:10.1016/b978-0-443-27398-8.00010-1
Peng, C., Wang, W., Yan, D., Yang, L., You, T., Jiang, Y., & Li, D. X. (2025) · Research Square · doi:10.21203/rs.3.rs-7719179/v1
Snodgrass, R. G., Jiang, X., & Stephensen, C. B. (2022) · Figshare · doi:10.6084/m9.figshare.21117419
Additional file 2 of Monocyte-driven inflamm-aging reduces intestinal barrier function in females
Quin, C., Breznik, J. A., Kennedy, A. E., DeJong, E. N., Andary, C. M., Ermolina, S., Davidson, D. J., Ma, J., Surette, M. G., & Bowdish, D. M. E. (2024) · Figshare · doi:10.6084/m9.figshare.27140613
Additional file 3 of Phenotypic and functional alterations of monocyte subsets with aging
Cao, Y., Fan, Y., Li, F., Hao, Y., Kong, Y., Chen, C., Hao, X., Han, D., Li, G., Wang, Z., et al. (2024) · Figshare · doi:10.6084/m9.figshare.26553689
Additional file 1 of Phenotypic and functional alterations of monocyte subsets with aging
Cao, Y., Fan, Y., Li, F., Hao, Y., Kong, Y., Chen, C., Hao, X., Han, D., Li, G., Wang, Z., et al. (2024) · Figshare · doi:10.6084/m9.figshare.26553683
Additional file 3 of Monocyte-driven inflamm-aging reduces intestinal barrier function in females
Quin, C., Breznik, J. A., Kennedy, A. E., DeJong, E. N., Andary, C. M., Ermolina, S., Davidson, D. J., Ma, J., Surette, M. G., & Bowdish, D. M. E. (2024) · Figshare · doi:10.6084/m9.figshare.27140616
Additional file 1 of Monocyte-driven inflamm-aging reduces intestinal barrier function in females
Quin, C., Breznik, J. A., Kennedy, A. E., DeJong, E. N., Andary, C. M., Ermolina, S., Davidson, D. J., Ma, J., Surette, M. G., & Bowdish, D. M. E. (2024) · Figshare · doi:10.6084/m9.figshare.27140610
Additional file 2 of Phenotypic and functional alterations of monocyte subsets with aging
Cao, Y., Fan, Y., Li, F., Hao, Y., Kong, Y., Chen, C., Hao, X., Han, D., Li, G., Wang, Z., et al. (2024) · Figshare · doi:10.6084/m9.figshare.26553686
Additional file 4 of Monocyte-driven inflamm-aging reduces intestinal barrier function in females
Quin, C., Breznik, J. A., Kennedy, A. E., DeJong, E. N., Andary, C. M., Ermolina, S., Davidson, D. J., Ma, J., Surette, M. G., & Bowdish, D. M. E. (2024) · Figshare · doi:10.6084/m9.figshare.27140619
Respiratory virus immune response in the aged host
Parks, O. B., Kalavacharla, A., & Williams, J. V. (2026) · Immunity & Ageing · doi:10.1186/s12979-026-00559-7
Tampé, J., Monni, E., Shen, Y.-P., Palma-Tortosa, S., Brogårdh, E., Lindgren, A. G., & Kokaia, Z. (2026) · Research Square · doi:10.21203/rs.3.rs-8980124/v1
Cambria, D., Cannizzaro, M. T., Parrinello, N. L., Marino, S., Dulcamare, I., Puccio, N., Torricelli, F., Lionetti, M., Calvo, D., Khosropoor, M., et al. (2026) · Cancers · doi:10.3390/cancers18071084
Teissier, T. (2019) · theses.fr (ABES) · doi:10.70675/f49bc069z5ee6z4c49zb46fz0a1413dbba95
Kupffer Cell Maintenance in Tissue Repair and Ageing
Adé, K. (2021) · theses.fr (ABES) · doi:10.70675/911ea1ffz0d8bz4037z9e5fza165f892d49e
Early expression of PD-L1 on monocyte is a predictor for severity in older adult sepsisPreprint
Gao, Q., Liu, B., Yang, L., Yang, T., & Guo, S. (2026) · Research Square · doi:10.21203/rs.3.rs-8975708/v1
Association of monocyte count with rapid renal function decline in nondialysis CKD
Wu, T.-J., Chou, Y., & Lin, S. (2026) · Journal of the Formosan Medical Association · doi:10.1016/j.jfma.2026.07.018
A transitional senescence program drives inflammatory monocyte state expansion in aging humansPreprint
Vasilopoulos, T., Turano, P. S., Garza‐Martinez, L., Akbulut, E., Konda, M., Herbig, U., Fitzgerald-Bocarsly, P. A., & Martínez‐Zamudio, R. I. (2026) · bioRxiv (Cold Spring Harbor Laboratory) · doi:10.64898/2026.09.09.750459
Protein expression derived from scRNA-seq reveals lupus-induced acceleration of immune aging
Leung, H. Y., & Qiu, P. (2026) · npj Systems Biology and Applications · doi:10.1038/s41540-026-00832-x
Oses, M., Torres, M. A. G., del Castillo, C. S., Moraga, A., Navas, I., Guillán, M., Zamarbide, I., Mora, V., Peña-Martinez, C., Ostos, F., et al. (2026) · Frontiers in Neuroscience · doi:10.3389/fnins.2026.1889912
Gao, Q., Liu, B., Yang, L., Guo, S., & 杨铁城 (2026) · Research Square · doi:10.21203/rs.3.rs-11180912/v1
Immunophenotypic Profiles of General Chinese Population during Natural Aging
Li, Y., Wang, B., Han, X., Dang, J., Qiu, J., Liu, B., Wang, W., Zhou, F., Zhao, Y., Zhang, X., et al. (2026) · Analytical Chemistry · doi:10.1021/acs.analchem.6c03408
Ageing and Platelet-Rich Therapies: Biological Determinants of Regenerative Potential
Anitua, E., Tierno, R., & Alkhraisat, M. H. (2026) · Mechanisms of Ageing and Development · doi:10.1016/j.mad.2026.112270
Metadata
- Authors
- Seidler, S., Zimmermann, H. W., Bartneck, M., Trautwein, C., & Tacke, F.
- Affiliations
- Universitätsklinikum Aachen (DE)
- Corresponding author
- Tacke, Frank
- Venue
- BMC Immunology
- Published
- 2010-06-21
- Volume
- 11
- Issue
- 1
- Pages
- 30-30
- ISSN
- 1471-2172 (ISSN-L)
- PMC
- PMC2910032
- OpenAlex
- W2058743791
- Cited by
- 390
- References
- 35
- Citations by year
- 2026: 17 · 2025: 23 · 2024: 32 · 2023: 32 · 2022: 30 · 2021: 40 · 2020: 33 · 2019: 27 · 2018: 21 · 2017: 17 · 2016: 22 · 2015: 26 · 2014: 20 · 2013: 22 · 2012: 16
- FWCI
- 6.45
- Type
- journal article
- Language
- en
- Open access
- gold
- doi.org
- Licence
- cc-by
- Locations
- BMC Immunology (publishedVersion, cc-by)
- PubMed Central (publishedVersion, cc-by)
- PubMed (publishedVersion)
- DOAJ (DOAJ: Directory of Open Access Journals) (submittedVersion, cc-by-sa)
- RWTH Publications (RWTH Aachen) (submittedVersion, cc-by)
- RWTH Publications (RWTH Aachen)
- Funders
- Deutsche Forschungsgemeinschaft (GRK 1035, DFG Ta434/2–1, SFB‐TRR57, Ta434/2-1, DFG: SFB/TRR57)
- RWTH Aachen University
- Topics
- Life Sciences › Immunology and Microbiology › Immunology › Immune cells in cancer
- Life Sciences › Immunology and Microbiology › Immunology › Immune Response and Inflammation
- Life Sciences › Immunology and Microbiology › Immunology › Atherosclerosis and Cardiovascular Diseases
- Keywords
- monocyte subsets, aging, immunosenescence, CD14+CD16+ monocytes, classical monocytes, CX3CR1, HLA-DR, chemokine receptors, MCP-1, monocyte-derived macrophages, cytokine production, lipopolysaccharide stimulation, healthy adults
- MeSH terms
- Adolescent, Adult, Aged, Aged, 80 and over, Aging, Cell Movement, Female, Health, HLA-DR Antigens, Humans, Macrophages, Male, Middle Aged, Monocytes, Cohort Studies, Signal Transduction, Receptors, IgG, Chemokines, Chemokine CCL2, Lipopolysaccharide Receptors, Receptors, Chemokine, Young Adult
About these checks
Registry, retraction, Cites and statistics results are computed, not judged, with one exception: a printed reference that no index lists is read once by a model before it counts as a citation error. Claims are extracted by a model and kept only when their quote appears verbatim in the text; each cited source is then checked, with a model’s help, for whether it says what the claim relies on. Those verdicts can be wrong — read the claim’s quote and the cited source before relying on one.
Statistics and arithmetic are recomputed, not judged.
Confidence bands are shown only for fields calibrated on our annotated test set. None is calibrated yet, so no band is shown.
What counts as a claim ›How we measure confidence ›How we check this ›
Are you an author, or do you see a problem with this page? Request a review
