

The DOI matches its Crossref record; 82 of the 82 references it cites were found in a registry or an index.
Binding of PFOS to serum albumin and DNA: insight into the molecular toxicity of perfluorochemicals
Open accessAbstract
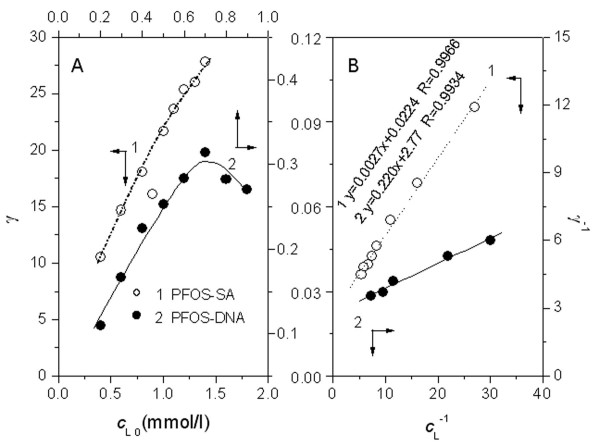
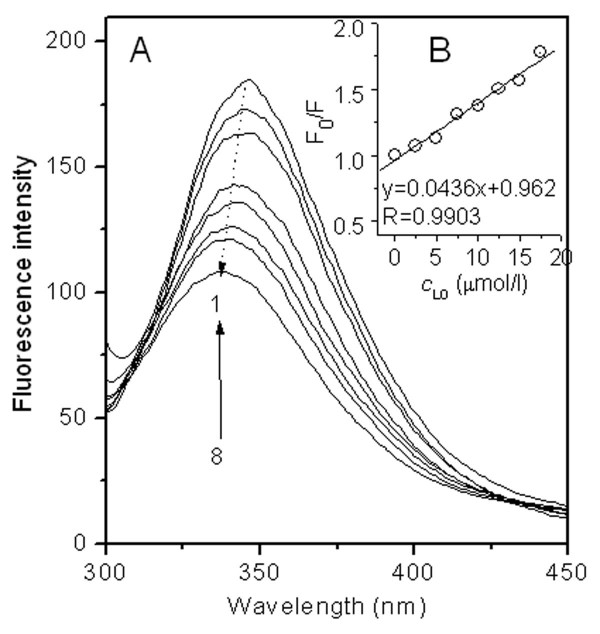
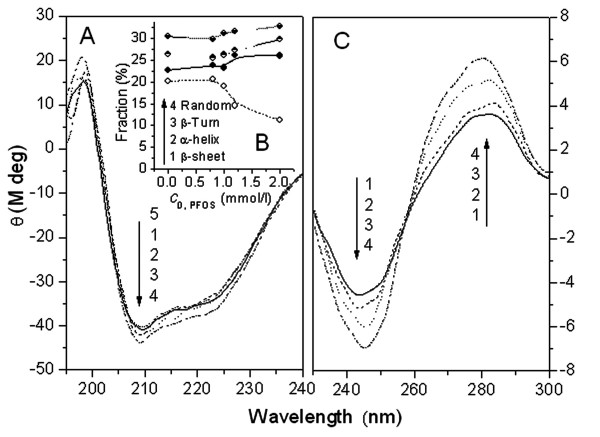
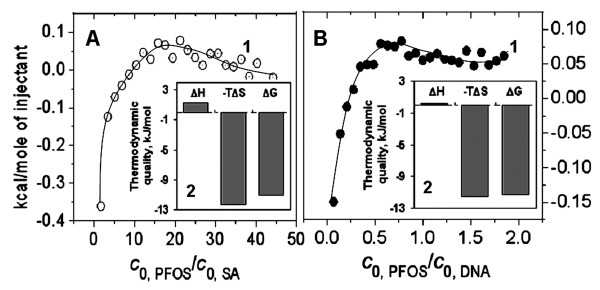
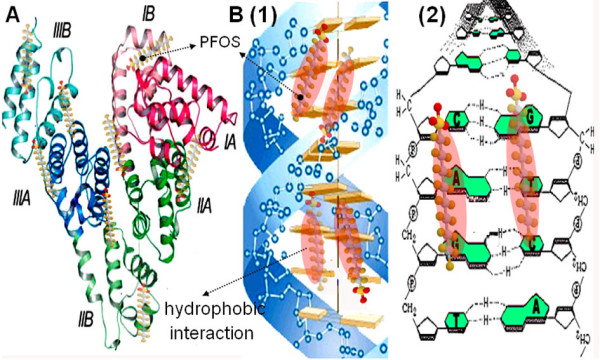
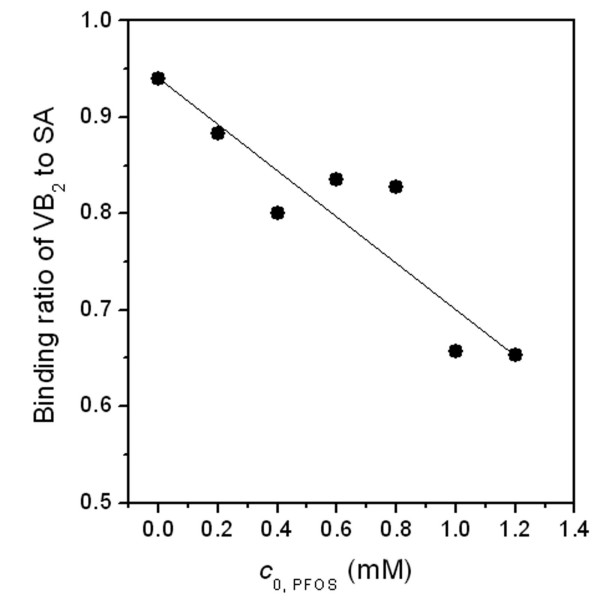
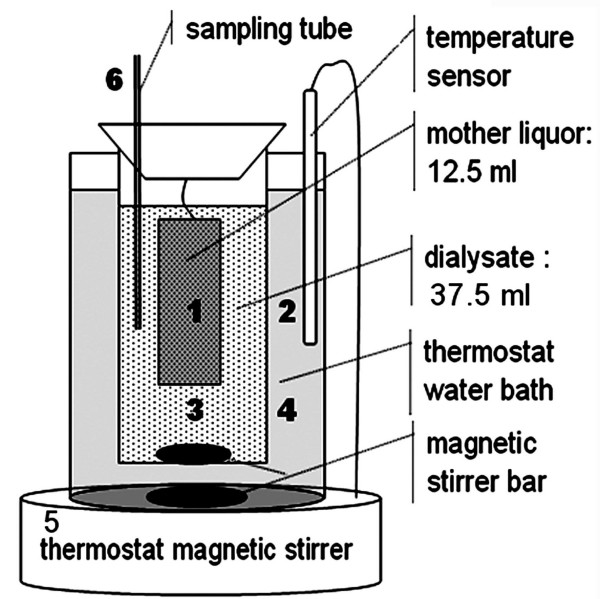
BACKGROUND: Health risk from exposure of perfluorochemicals (PFCs) to wildlife and human has been a subject of great interest for understanding their molecular mechanism of toxicity. Although much work has been done, the toxigenicity of PFCs remains largely unknown. In this work, the non-covalent interactions between perfluorooctane sulfonate (PFOS) and serum albumin (SA) and DNA were investigated under normal physiological conditions, aiming to elucidate the toxigenicity of PFCs. RESULTS: In equilibrium dialysis assay, the bindings of PFOS to SA correspond to the Langmuir isothermal model with two-step sequence model. The saturation binding number of PFOS was 45 per molecule of SA and 1 per three base-pairs of DNA, respectively. ITC results showed that all the interactions were spontaneous driven by entropy change. Static quenching of the fluorescence of SA was observed when interacting with PFOS, indicating PFOS bound Trp residue of SA. CD spectra of SA and DNA changed obviously in the presence of PFOS. At normal physiological conditions, 1.2 mmol/l PFOS reduces the binding ratio of Vitamin B2 to SA by more than 30%. CONCLUSION: The ion bond, van der Waals force and hydrophobic interaction contributed to PFOS binding to peptide chain of SA and to the groove bases of DNA duplex. The non-covalent interactions of PFOS with SA and DNA alter their secondary conformations, with the physiological function of SA to transport Vitamin B2 being inhibited consequently. This work provides a useful experimental method for further studying the toxigenicity of PFCs.
Overview
The claims and statistics of this paper haven’t been checked yet.
Run the check — free, no account needed. It reads the open-access text and checks the sources it cites.
Integrity signals
Registry
Cites
Statistics
Figures
Verification
Claims the paper makes
The claims and statistics of this paper haven’t been checked yet.
Run the check — free, no account needed. It reads the open-access text and checks the sources it cites.
Claims other papers make about this one
Each is checked against this paper’s own text: does it say what the citing paper says it does?
The source backs part of the claim, not all of it — or backs it for a different population, condition or comparison.
In the citing paper
“Consistent with previous studies of PFAS-protein associations, PFAS were highly bound to HSA [24,25,41].”
From In-Vitro and In-Silico Assessment of Per- and Polyfluoroalkyl Substances (PFAS) in Aqueous Film-Forming Foam (AFFF) Binding to Human Serum Albumin (2021) · cites this paper as [41]
Experimental — accuracy not yet measured
Self-check
Percentages, sums and reported differences re-computed from the paper’s own numbers.
The self-check needs the paper’s full text.
Citations
Cites
Carter, D. C., & Ho, J. X. (1994) · Advances in protein chemistry · doi:10.1016/s0065-3233(08)60640-3 · Cited by 3,184
Global Distribution of Perfluorooctane Sulfonate in Wildlife
Giesy, J. P., & Kannan, K. (2001) · Environmental Science & Technology · doi:10.1021/es001834k · Cited by 2,750
Rhule, J. T., Hill, C. L., Judd, D. A., & Schinazi, R. F. (1998) · Chemical Reviews · doi:10.1021/cr960396q · Cited by 1,894
Perfluorooctanesulfonate and related fluorochemicals in human blood from several countries
Kannan, K., Corsolini, S., Falandysz, J., Fillmann, G., Kumar, K. S., Loganathan, B. G., Mohd, M. A., Olivero, J., Wouwe, N. V., Yang, J. H., et al. (2004) · Environmental Science & Technology · doi:10.1021/es0493446 · Cited by 1,056
Food WebSpecific Biomagnification of Persistent Organic Pollutants
Kelly, B. C., Ikonomou, M. G., Blair, J. D., Morin, A. E., & Gobas, F. A. P. C. (2007) · Science · doi:10.1126/science.1138275 · Cited by 1,055
The Developmental Toxicity of Perfluoroalkyl Acids and Their Derivatives
Lau, C., Butenhoff, J. L., & Rogers, J. M. (2004) · Toxicology and Applied Pharmacology · doi:10.1016/j.taap.2003.11.031 · Cited by 867
Crystal Structure Analysis of Warfarin Binding to Human Serum Albumin
Petitpas, I., Bhattacharya, A. A., Twine, S., Malcolm, E. A. S. T., & Curry, S. (2001) · Journal of Biological Chemistry · doi:10.1074/jbc.m100575200 · Cited by 827
The toxicology of perfluorooctanoate
Kennedy, G. L., Butenhoff, J. L., Olsen, G. W., O'Connor, J. C., Seacat, A. M., Perkins, R. G., Biegel, L. B., Murphy, S. R., & Farrar, D. G. (2004) · Critical Reviews in Toxicology · doi:10.1080/10408440490464705 · Cited by 742
A global survey of perfluorinated acids in oceans
Yamashita, N., Kannan, K., Taniyasu, S., Horii, Y., Petrick, G., & Gamo, T. (2005) · Marine Pollution Bulletin · doi:10.1016/j.marpolbul.2005.04.026 · Cited by 651
Apelberg, B. J., Witter, F. R., Herbstman, J. B., Calafat, A. M., Halden, R. U., Needham, L. L., & Goldman, L. R. (2007) · Environmental Health Perspectives · doi:10.1289/ehp.10334 · Cited by 630
Research works printed but not linked: 1
- Yi PG, Yu QS, Shang ZC, Guo M: Study on the interaction between chlortetracycline and bovine serum albumin. Chinese Journal Chemical Physics. 2003, 16: 420-425.
Cited by
Sorted by citations
(CONTAM), E. P. O. C. I. T. F. C., Knutsen, H. K., Alexander, J., Barregård, L., Bignami, M., Brüschweiler, B. J., Ceccatelli, S., Cottrill, B., Dinovi, M., Edler, L., et al. (2018) · EFSA Journal · doi:10.2903/j.efsa.2018.5194 · Cited by 549
Bioaccumulation of Perfluorinated Alkyl Acids: Observations and Models
Ng, C. A., & Hungerbühler, K. (2014) · Environmental Science & Technology · doi:10.1021/es404008g · Cited by 393
Shi, Y., Vestergren, R., Zhou, Z., Song, X., Xu, L., Liang, Y., & Cai, Y. (2015) · Environmental Science & Technology · doi:10.1021/acs.est.5b04299 · Cited by 258
Menger, R. F., Funk, E., Henry, C. S., & Borch, T. (2021) · Chemical Engineering Journal · doi:10.1016/j.cej.2021.129133 · Cited by 224
Determinants of plasma concentrations of perfluoroalkyl substances in pregnant Norwegian women
Brantsæter, A. L., Whitworth, K. W., Ydersbond, T. A., Haug, L. S., Haugen, M. A., Knutsen, H. K., Thomsen, C., Meltzer, H. M., Becher, G., Sabaredzovic, A., et al. (2013) · Environment International · doi:10.1016/j.envint.2012.12.014 · Cited by 199
Metadata
- Authors
- Zhang, X., Chen, L., Fei, X.-C., Ma, Y.-S., & Gao, H.-W.
- Affiliations
- Tongji University (CN)
- Nanjing Forestry University (CN)
- Venue
- BMC Molecular Biology
- Published
- 2009-02-25
- Volume
- 10
- Issue
- 1
- Pages
- 16-16
- ISSN
- 1471-2199 (ISSN-L)
- PMC
- PMC2656506
- OpenAlex
- W2101872249
- Semantic Scholar
- 1e21dbc36a772a1385895e7e1c28276e014b4919
- Cited by
- 119
- References
- 82
- Citations by year
- 2026: 7 · 2025: 10 · 2024: 9 · 2023: 3 · 2022: 4 · 2021: 9 · 2020: 10 · 2019: 6 · 2018: 3 · 2017: 1 · 2016: 4 · 2015: 6 · 2014: 12 · 2013: 4 · 2012: 11
- FWCI
- 7.85
- Type
- journal article
- Language
- en
- Open access
- hybrid
- doi.org
- Licence
- cc-by
- Locations
- BMC Molecular Biology (publishedVersion, cc-by)
- PubMed Central (publishedVersion, cc-by)
- PubMed (publishedVersion)
- DOAJ (DOAJ: Directory of Open Access Journals) (submittedVersion)
- Topics
- Physical Sciences › Environmental Science › Environmental Chemistry › Per- and polyfluoroalkyl substances research
- Life Sciences › Biochemistry, Genetics and Molecular Biology › Molecular Biology › Protein Interaction Studies and Fluorescence Analysis
- Life Sciences › Biochemistry, Genetics and Molecular Biology › Molecular Biology › Protein Structure and Dynamics
- Keywords
- PFOS, perfluorochemicals, serum albumin, DNA binding, molecular toxicity, non-covalent interactions, binding isotherms, entropy-driven binding, tryptophan binding, protein secondary structure, hydrophobic interactions, van der Waals interactions
- MeSH terms
- Animals, Binding Sites, Biological Transport, DNA, Electrolytes, Fluorescence, Fluorocarbons, Humans, Hydrogen-Ion Concentration, Models, Molecular, Protein Binding, Riboflavin, Serum Albumin, Temperature, Thermodynamics, Tryptophan, Protein Structure, Tertiary, Alkanesulfonic Acids
About these checks
Registry, retraction, Cites and statistics results are computed, not judged, with one exception: a printed reference that no index lists is read once by a model before it counts as a citation error. Claims are extracted by a model and kept only when their quote appears verbatim in the text; each cited source is then checked, with a model’s help, for whether it says what the claim relies on. Those verdicts can be wrong — read the claim’s quote and the cited source before relying on one.
Statistics and arithmetic are recomputed, not judged.
Confidence bands are shown only for fields calibrated on our annotated test set. None is calibrated yet, so no band is shown.
What counts as a claim ›How we measure confidence ›How we check this ›
Are you an author, or do you see a problem with this page? Request a review
