

The DOI matches its Crossref record; 18 of the 18 references it cites were found in a registry or an index.
The RIN: an RNA integrity number for assigning integrity values to RNA measurements
Open accessAbstract
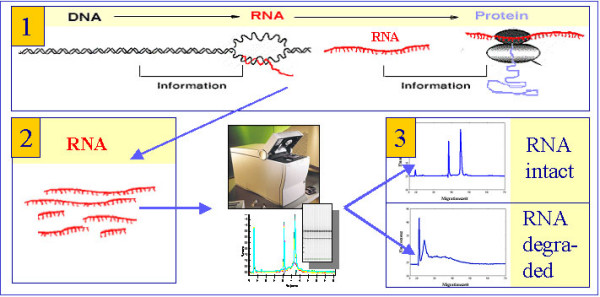
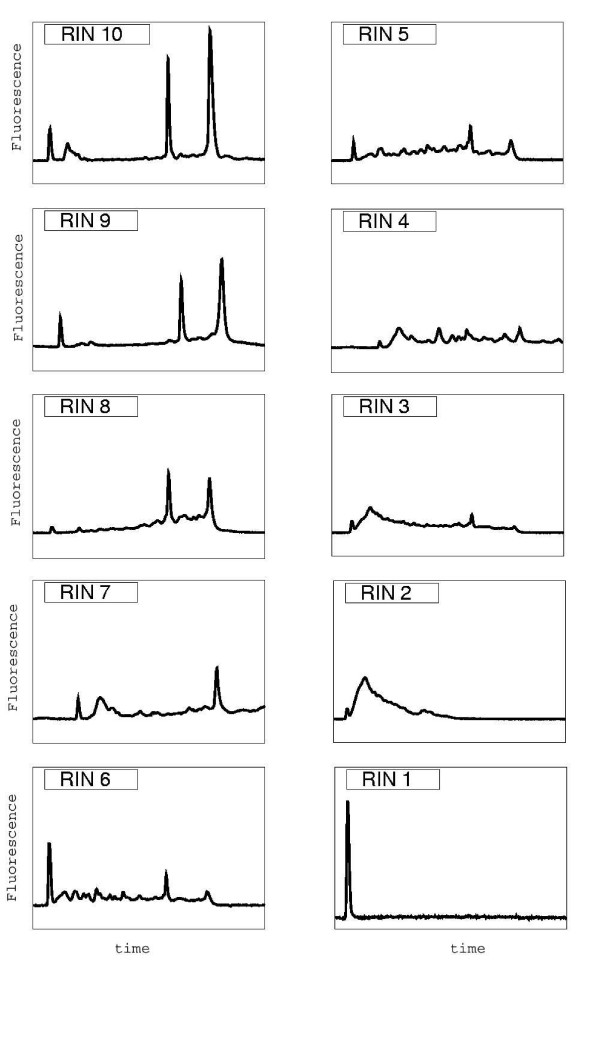
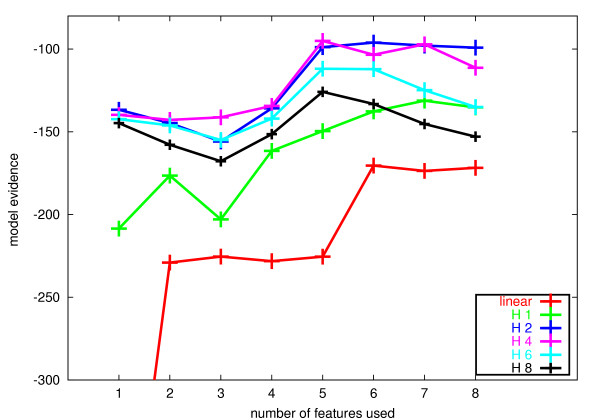
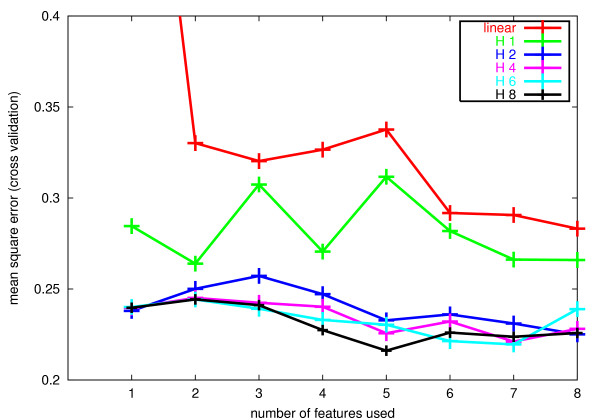
Background: The integrity of RNA molecules is of paramount importance for experiments that try to reflect the snapshot of gene expression at the moment of RNA extraction. Until recently, there has been no reliable standard for estimating the integrity of RNA samples and the ratio of 28S:18S ribosomal RNA, the common measure for this purpose, has been shown to be inconsistent. The advent of microcapillary electrophoretic RNA separation provides the basis for an automated high-throughput approach, in order to estimate the integrity of RNA samples in an unambiguous way. Methods: A method is introduced that automatically selects features from signal measurements and constructs regression models based on a Bayesian learning technique. Feature spaces of different dimensionality are compared in the Bayesian framework, which allows selecting a final feature combination corresponding to models with high posterior probability. Results: This approach is applied to a large collection of electrophoretic RNA measurements recorded with an Agilent 2100 bioanalyzer to extract an algorithm that describes RNA integrity. The resulting algorithm is a user-independent, automated and reliable procedure for standardization of RNA quality control that allows the calculation of an RNA integrity number (RIN). Conclusion: Our results show the importance of taking characteristics of several regions of the recorded electropherogram into account in order to get a robust and reliable prediction of RNA integrity, especially if compared to traditional methods.
Overview
The claims and statistics of this paper haven’t been checked yet.
Run the check — free, no account needed. It reads the open-access text and checks the sources it cites.
Integrity signals
Registry
Cites
Statistics
Figures
Verification
Claims the paper makes
The claims and statistics of this paper haven’t been checked yet.
Run the check — free, no account needed. It reads the open-access text and checks the sources it cites.
Claims other papers make about this one
Each is checked against this paper’s own text: does it say what the citing paper says it does?
The cited source says what the claim attributes to it.
In the citing paper
“In this study, we also excluded 9 cortex and 15 cerebellum samples that had an RNA Integrity Number (RIN)63 less than 7.”
From Pathogenic tau-induced piRNA depletion promotes neuronal death through transposable element dysregulation in neurodegenerative tauopathies (2018) · cites this paper as [63]
Self-check
Percentages, sums and reported differences re-computed from the paper’s own numbers.
The self-check needs the paper’s full text.
Citations
Cites
Molecular Cloning: A Laboratory Manual
Sambrook, J., Fritsch, E., & Maniatis, T. (1989) · UCLA - Biblioteca de Ciencias de la Salud · Cited by 133,589
Molecular cloning: A laboratory manual
Deininger, P. L. (1990) · Analytical Biochemistry · doi:10.1016/0003-2697(90)90595-z · Cited by 84,684
Elements of Information Theory
Cover, T. M., & Thomas, J. A. (2001) · Wiley eBooks · doi:10.1002/0471200611 · Cited by 37,139
Neural networks for pattern recognition
Bishop, C. (1994) · Choice Reviews Online · doi:10.5860/choice.31-5500 · Cited by 18,537
Density Estimation for Statistics and Data Analysis
Silverman, B. W. (2018) · Routledge eBooks · doi:10.1201/9781315140919 · Cited by 15,938
Neural Networks for Pattern Recognition
Bishop, C. M. (1995) · doi:10.1093/oso/9780198538493.001.0001 · Cited by 12,287
Density Estimation for Statistics and Data Analysis
(1986) · Springer eBooks · doi:10.1007/978-1-4899-3324-9 · Cited by 8,569
A practical Bayesian framework for backpropagation networks
MacKay, D. J. C. (1992) · Neural Computation · doi:10.1162/neco.1992.4.3.448 · Cited by 2,917
(1982) · Cited by 1,288
Elements of Information Theory, Wiley Series in Telecommunications
Cover, T. M., & Allen, T. (1991) · Cited by 625
Research works printed but not linked: 3
- Mueller O, Lightfoot S, Schröder A: RNA Integrity Number (RIN) Standardization of RNA Quality Control. Tech. Rep. 5989-1165EN, Agilent Technologies, Application Note. 2004, http://www.agilent.com/chem/labonachip
- Schröder A: Qualitätsbestimmung von RNA-Proben mittels adaptiver Verfahren. Diplomarbeit Universität Karlsruhe. 2003
- Agilent : 2100 expert software. Tech. Rep. 5989-0112EN, Agilent Technologies, Software Data Sheet. 2004, http://www.agilent.com/chem/labonachip
Cited by
Sorted by citations
Items 201–300 of 1,001
Altered miRNA expression network in locus coeruleus of depressed suicide subjects
Roy, B., Wang, Q., Palkovits, M., Faludi, G., & Dwivedi, Y. (2017) · Scientific Reports · doi:10.1038/s41598-017-04300-9 · Cited by 86
Lost in Translation: Physiological Roles of Stored mRNAs in Seed Germination
Sano, N., Rajjou, L., & North, H. (2020) · Plants · doi:10.3390/plants9030347 · Cited by 94
Crist, A. M., Hinkle, K. M., Wang, X., Moloney, C. M., Matchett, B. J., Labuzan, S. A., Frankenhauser, I., Azu, N. O., Liesinger, A. M., Lesser, E. R., et al. (2021) · Nature Communications · doi:10.1038/s41467-021-22399-3 · Cited by 93
A Platform for Discovery and Quantification of Modified Ribonucleosides in RNA
Cai, W. M., Chionh, Y. H., Hia, F., Gu, C., Kellner, S. M., McBee, M. E., Ng, C. S., Pang, Y. L. J., Prestwich, E. G., Lim, K. S., et al. (2015) · Methods in enzymology on CD-ROM/Methods in enzymology · doi:10.1016/bs.mie.2015.03.004 · Cited by 89
Saint‐Marcoux, D., Proust, H., Dolan, L., & Langdale, J. A. (2015) · PLoS ONE · doi:10.1371/journal.pone.0118678 · Cited by 89
Microarray analysis in rat liver slices correctly predicts in vivo hepatotoxicity
Elferink, M. G. L., Olinga, P., Draaisma, A. L., Merema, M. T., Bauerschmidt, S., Polman, J. E. M., Schoonen, W. G. E. J., & Groothuis, G. M. M. (2008) · Toxicology and Applied Pharmacology · doi:10.1016/j.taap.2008.01.037 · Cited by 89
DNA Repair and Cell Cycle Biomarkers of Radiation Exposure and Inflammation Stress in Human Blood
Budworth, H., Snijders, A. M., Marchetti, F., Mannion, B. J., Bhatnagar, S., Kwoh, E. E., Tan, Y.-D., Wang, S. X., Blakely, W. F., Coleman, M. A., et al. (2012) · PLoS ONE · doi:10.1371/journal.pone.0048619 · Cited by 89
Ayturk, U. M., Jacobsen, C. M., Christodoulou, D. C., Gorham, J., Seidman, J. G., Seidman, C. E., Robling, A. G., & Warman, M. L. (2013) · Journal of Bone and Mineral Research · doi:10.1002/jbmr.1946 · Cited by 84
Mori, Y., Saito, T., Chang, S. H., Kobayashi, H., Ladel, C. H., Guehring, H., Chung, U., & Kawaguchi, H. (2014) · Journal of Biological Chemistry · doi:10.1074/jbc.m113.524090 · Cited by 88
Kirschneck, C., Batschkus, S., Proff, P., Köstler, J., Spanier, G., & Schröder, A. (2017) · Scientific Reports · doi:10.1038/s41598-017-15281-0 · Cited by 88
Role of miR-19b and its target mRNAs in 5-fluorouracil resistance in colon cancer cells
Kurokawa, K., Tanahashi, T., Iima, T., Yamamoto, Y., Akaike, Y., Nishida, K., Masuda, K., Kuwano, Y., Murakami, Y., Fukushima, M., et al. (2012) · Journal of Gastroenterology · doi:10.1007/s00535-012-0547-6 · Cited by 91
Blood-Based Gene Expression Signatures of Infants and Toddlers With Autism
Glatt, S. J., Tsuang, M. T., Winn, M. E., Chandler, S. D., Collins, M., Lopez, L., Weinfeld, M., Carter, C., Schork, N. J., Pierce, K., et al. (2012) · Journal of the American Academy of Child & Adolescent Psychiatry · doi:10.1016/j.jaac.2012.07.007 · Cited by 88
Thompson, K. L., Pine, P. S., Rosenzweig, B. A., Turpaz, Y., & Retief, J. (2007) · BMC Biotechnology · doi:10.1186/1472-6750-7-57 · Cited by 88
Christodoulou, D. C., Gorham, J., Herman, D. S., & Seidman, J. G. (2011) · Current Protocols in Molecular Biology · doi:10.1002/0471142727.mb0412s94 · Cited by 91
Identification of RNA-binding Proteins in Macrophages by Interactome Capture
Liepelt, A., Vries, I. S. N., Simons, N., Eichelbaum, K., Föehr, S., Archer, S. K., Castelló, A., Usadel, B., Krijgsveld, J., Preiß, T., et al. (2016) · Molecular & Cellular Proteomics · doi:10.1074/mcp.m115.056564 · Cited by 86
Decline in RNA integrity of dry-stored soybean seeds correlates with loss of germination potential
Fleming, M. B., Richards, C. M., & Walters, C. (2017) · Journal of Experimental Botany · doi:10.1093/jxb/erx100 · Cited by 86
Mutation in POLR3K causes hypomyelinating leukodystrophy and abnormal ribosomal RNA regulation
Dorboz, I., Dumay‐Odelot, H., Boussaid, K., Bouyacoub, Y., Barreau, P., Samaan, S., Jmel, H., Eymard-Pierre, É., Cancès, C., Bar, C., et al. (2018) · Neurology Genetics · doi:10.1212/nxg.0000000000000289 · Cited by 86
Biobanking of Human Pancreas Cancer Tissue: Impact of Ex-Vivo Procurement Times on RNA Quality
Rudloff, U., Bhanot, U. K., Gerald, W. L., Klimstra, D. S., Jarnagin, W. R., Brennan, M. F., & Allen, P. J. (2010) · Annals of Surgical Oncology · doi:10.1245/s10434-010-0959-6 · Cited by 88
Huang, X. Y., Hao, C., Shen, X., Zhang, Y., & Liu, X. (2013) · Reproductive Biology and Endocrinology · doi:10.1186/1477-7827-11-109 · Cited by 86
Kumagai, K., Yamamoto, N., Miyashiro, I., Tomita, Y., Katai, H., Kushima, R., Tsuda, H., Kitagawa, Y., Takeuchi, H., Mukai, M., et al. (2013) · Gastric Cancer · doi:10.1007/s10120-013-0271-9 · Cited by 85
Winter, A. D., Weir, W., Hunt, M., Berriman, M., Gilleard, J. S., Devaney, E., & Britton, C. (2012) · BMC Genomics · doi:10.1186/1471-2164-13-4 · Cited by 89
Technical Variations in Low-Input RNA-seq Methodologies
Bhargava, V., Head, S. R., Ordoukhanian, P. T., Mercola, M. A., & Subramaniam, S. (2014) · Scientific Reports · doi:10.1038/srep03678 · Cited by 86
French, P. J., Peeters, J. K., Horsman, S., Duijm, E. J., Siccama, I., van den Bent, M. J., Luider, T. M., Kros, J. M., van der Spek, P. J., & Smitt, P. A. E. S. (2007) · Cancer Research · doi:10.1158/0008-5472.can-06-2869 · Cited by 87
Trascriptome analysis of the Pacific white shrimp Litopenaeus vannamei exposed to nitrite by RNA-seq
Guo, H., Ye, C., Wang, A., Xian, J.-A., Liao, S., Miao, Y.-T., & Zhang, S. (2013) · Fish & Shellfish Immunology · doi:10.1016/j.fsi.2013.09.019 · Cited by 84
Kabakchiev, B., & Silverberg, M. S. (2013) · Gastroenterology · doi:10.1053/j.gastro.2013.03.001 · Cited by 87
RNA extraction from cheese for analysis ofin situgene expression ofLactococcus lactis
Ulvé, V. M., Monnet, C., Valence, F., Fauquant, J., Falentin, H., & Lortal, S. (2008) · Journal of Applied Microbiology · doi:10.1111/j.1365-2672.2008.03869.x · Cited by 84
Weber, D. G., Casjens, S., Rozynek, P., Lehnert, M., Zilch-Schöneweis, S., Bryk, O., Taeger, D., Gomolka, M., Kreuzer, M., Otten, H., et al. (2010) · Biomarker Insights · doi:10.4137/bmi.s5522 · Cited by 84
The sex-biased brain: sexual dimorphism in gene expression in two species of songbirds
Naurin, S., Hansson, B., Hasselquist, D., Kim, Y., & Bensch, S. (2011) · BMC Genomics · doi:10.1186/1471-2164-12-37 · Cited by 82
Depot‐specific steroidogenic gene transcription in human adipose tissue
MacKenzie, S. M., Huda, S. S., Sattar, N. A., Fraser, R., Connell, J., & Davies, E. (2008) · Clinical Endocrinology · doi:10.1111/j.1365-2265.2008.03262.x · Cited by 83
Dong, X., Zhang, W., Wang, H.-X., Stradtman, G. G., & Gao, W. (2009) · The International Journal of Neuropsychopharmacology · doi:10.1017/s146114570900042x · Cited by 84
Clément‐Ziza, M., Münnich, A., Lyonnet, S., Jaubert, F., & Besmond, C. (2008) · RNA · doi:10.1261/rna.1261708 · Cited by 83
Kitamoto, T., Kitamoto, A., Ogawa, Y., Honda, Y., Imajo, K., Saito, S., Yoneda, M., Nakamura, T., Nakajima, A., & Hotta, K. (2015) · Journal of Hepatology · doi:10.1016/j.jhep.2015.02.049 · Cited by 83
Ravo, M., Mutarelli, M., Ferraro, L., Grober, O. M. V., Paris, O., Tarallo, R., Vigilante, A., Cimino, D., Bortoli, M. D., Nola, E., et al. (2008) · Laboratory Investigation · doi:10.1038/labinvest.2008.11 · Cited by 81
Glatt, S. J., Tylee, D. S., Chandler, S. D., Pazol, J., Nievergelt, C. M., Woelk, C. H., Baker, D. G., Lohr, J. B., Kremen, W. S., Litz, B. T., et al. (2013) · American Journal of Medical Genetics Part B: Neuropsychiatric Genetics · doi:10.1002/ajmg.b.32167 · Cited by 80
Villa-Rodríguez, E., Ibarra‐Gámez, J. C., & Santos‐Villalobos, S. D. L. (2018) · Journal of Microbiological Methods · doi:10.1016/j.mimet.2018.02.011 · Cited by 82
HIV-1 Vpu is a potent transcriptional suppressor of NF-κB-elicited antiviral immune responses
Langer, S., Hammer, C., Hopfensperger, K., Klein, L., Hotter, D., Jesus, P. D. D., Herbert, K. M., Pache, L., Smith, N., van der Merwe, J. A., et al. (2019) · eLife · doi:10.7554/elife.41930 · Cited by 82
Honaas, L. A., Wafula, E. K., Yang, Z., Der, J. P., Wickett, N. J., Altman, N., Taylor, C. G., Yoder, J. I., Timko, M. P., Westwood, J. H., et al. (2013) · BMC Plant Biology · doi:10.1186/1471-2229-13-9 · Cited by 82
White, K., Yang, P., Li, L., Farshori, A., Medina, A. E., & Zielke, H. R. (2018) · Biopreservation and Biobanking · doi:10.1089/bio.2017.0099 · Cited by 83
Kis, Z. (2022) · Pharmaceutics · doi:10.3390/pharmaceutics14020430 · Cited by 84
Prognostic stromal gene signatures in breast cancer
Winslow, S., Leandersson, K., Edsjö, A., & Larsson, C. (2015) · Breast Cancer Research · doi:10.1186/s13058-015-0530-2 · Cited by 81
ADAM9 is highly expressed in renal cell cancer and is associated with tumour progression
Fritzsche, F. R., Wassermann, K., Jung, M., Tölle, A., Kristiansen, I., Lein, M., Johannsen, M., Dietel, M., Jung, K., & Kristiansen, G. (2008) · BMC Cancer · doi:10.1186/1471-2407-8-179 · Cited by 83
Koppelkamm, A., Vennemann, B., Fracasso, T., Lutz‐Bonengel, S., Schmidt, U. G., & Vennemann, M. (2010) · International Journal of Legal Medicine · doi:10.1007/s00414-010-0433-9 · Cited by 80
Jeffries, M. K. S., Kiss, A. J., Smith, A. W., & Oris, J. T. (2014) · BMC Biotechnology · doi:10.1186/s12896-014-0094-8 · Cited by 80
Transcriptional effects of PFOS in isolated hepatocytes from Atlantic salmon Salmo salar L.
Krøvel, A. V., Søfteland, L., Torstensen, B. E., & Olsvik, P. A. (2008) · Comparative Biochemistry and Physiology Part C Toxicology & Pharmacology · doi:10.1016/j.cbpc.2008.03.001 · Cited by 80
Silver, N., Cotroneo, E., Proctor, G., Osailan, S. M., Paterson, K. L., & Carpenter, G. H. (2008) · BMC Molecular Biology · doi:10.1186/1471-2199-9-64 · Cited by 80
CB1 Expression Is Attenuated in Fallopian Tube and Decidua of Women with Ectopic Pregnancy
Horne, A. W., Phillips, J. A., Kane, N., Lourenco, P. C., McDonald, S. E., Williams, A. R. W., Simón, C., Dey, S. K., & Critchley, H. (2008) · PLoS ONE · doi:10.1371/journal.pone.0003969 · Cited by 80
Yaffe, H., Buxdorf, K., Shapira, I., Ein-Gedi, S., Zvi, M. M. B., Fridman, E., Moshelion, M., & Levy, M. (2012) · BMC Research Notes · doi:10.1186/1756-0500-5-45 · Cited by 80
Effects of Formalin, Methacarn, and FineFIX Fixatives on RNA Preservation
Dotti, I., Bonin, S., Basili, G., Nardon, E., Balani, A., Siracusano, S., Zanconati, F., Palmisano, S., de Manzini, N., & Stanta, G. (2010) · Diagnostic Molecular Pathology · doi:10.1097/pdm.0b013e3181b520f8 · Cited by 79
Popova, M., Martin, C., Eugène, M., Mialon, M., Doreau, M., & Morgavi, D. P. (2011) · Animal Feed Science and Technology · doi:10.1016/j.anifeedsci.2011.04.060 · Cited by 79
Jørgensen, J. T., Persson, M., Madsen, J., & Kjær, A. (2013) · Nuclear Medicine and Biology · doi:10.1016/j.nucmedbio.2013.01.002 · Cited by 79
Pratt, A. G., Swan, D., Richardson, S., Wilson, G., Hilkens, C. M. U., Young, D. A., & Isaacs, J. D. (2012) · Annals of the Rheumatic Diseases · doi:10.1136/annrheumdis-2011-200968 · Cited by 80
Raman, S. N. T., Liu, G., Pyo, H. M., Cui, Y. C., Xu, F., Ayalew, L. E., Tikoo, S. K., & Zhou, Y. (2016) · Journal of Virology · doi:10.1128/jvi.03010-15 · Cited by 79
Hollins, S. L., Zavitsanou, K., Walker, F. R., & Cairns, M. J. (2014) · Translational Psychiatry · doi:10.1038/tp.2014.99 · Cited by 82
Genetic circuit characterization and debugging using RNA‐seq
Gorochowski, T. E., Borujeni, A. E., Park, Y., Nielsen, A. A. K., Zhang, J., Der, B. S., Gordon, D. B., & Voigt, C. A. (2017) · Molecular Systems Biology · doi:10.15252/msb.20167461 · Cited by 78
Tang, S., Orsi, R. H., den Bakker, H. C., Wiedmann, M., Boor, K. J., & Bergholz, T. M. (2015) · Applied and Environmental Microbiology · doi:10.1128/aem.01752-15 · Cited by 77
Staff, S. M., Kujala, P. M., Karhu, R., Rökman, A., Ilvesaro, J. M., Kares, S., & Isola, J. J. (2013) · Journal of Clinical Pathology · doi:10.1136/jclinpath-2012-201283 · Cited by 77
Circular RNAs in the human brain are tailored to neuron identity and neuropsychiatric disease
Dong, X., Bai, Y., Liao, Z., Gritsch, D., Liu, X., Wang, T., Borges-Monroy, R., Ehrlich, A., Serrano, G. E., Feany, M. Β., et al. (2023) · Nature Communications · doi:10.1038/s41467-023-40348-0 · Cited by 83
McCullumsmith, R. E., & Meador‐Woodruff, J. H. (2010) · Biological Psychiatry · doi:10.1016/j.biopsych.2010.09.035 · Cited by 77
A Buffered Alcohol-Based Fixative for Histomorphologic and Molecular Applications
Perry, C. D., Chung, J., Ylaya, K., Choi, C. H., Simpson, A., Matsumoto, K. T., Smith, W. A., & Hewitt, S. M. (2016) · Journal of Histochemistry & Cytochemistry · doi:10.1369/0022155416649579 · Cited by 76
Validation of a Targeted RNA Sequencing Assay for Kinase Fusion Detection in Solid Tumors
Reeser, J. W., Patacsil, D., Miya, J., Kautto, E. A., Lyon, E., Zhu, E. Y., Wing, M. R., Smith, A. M., Reeder, M., Samorodnitsky, E., et al. (2017) · Journal of Molecular Diagnostics · doi:10.1016/j.jmoldx.2017.05.006 · Cited by 77
Costa, P. M., Gosens, I., Williams, A., Farcal, L. R., Pantano, D., Brown, D. M., Stone, V., Cassee, F. R., Halappanavar, S. S., & Fadeel, B. (2017) · Journal of Applied Toxicology · doi:10.1002/jat.3548 · Cited by 76
Lasarzik, I., Kriege, O., Timaru‐Kast, R., Pieter, D., Werner, C. D., Engelhard, K., & Thal, S. C. (2014) · Journal of Neurotrauma · doi:10.1089/neu.2013.3243 · Cited by 76
Bouchard‐Mercier, A., Paradis, A.-M., Rudkowska, I., Lemieux, S., Couture, P., & Vohl, M. (2013) · Nutrition Journal · doi:10.1186/1475-2891-12-24 · Cited by 81
Muller, C. L., Anacker, A. M. J., Rogers, T. D., Goeden, N., Keller, E. H., Forsberg, C. G., Kerr, T. M., Wender, C. L. A., Anderson, G. M., Stanwood, G. D., et al. (2016) · Neuropsychopharmacology · doi:10.1038/npp.2016.166 · Cited by 80
Nonsyntenic Genes Drive Highly Dynamic Complementation of Gene Expression in Maize Hybrids
Paschold, A., Larson, N. B., Marcon, C., Schnable, J. C., Yeh, C., Lanz, C., Nettleton, D. S., Piepho, H., Schnable, P. S., & Hochholdinger, F. (2014) · The Plant Cell · doi:10.1105/tpc.114.130948 · Cited by 75
Kinaret, P., Serra, A., Federico, A., Kohonen, P. J., Nymark, P. E. H., Liampa, I., Ha, M. K., Choi, J., Jagiełło, K., Sanabria, N. M., et al. (2020) · Nanomaterials · doi:10.3390/nano10040750 · Cited by 79
Kourdougli, N., Suresh, A., Liu, B., Juárez, P., Lin, A., Chung, D. T., Sams, A. G., Gandal, M. J., Martínez‐Cerdeño, V., Buonomano, D. V., et al. (2023) · Neuron · doi:10.1016/j.neuron.2023.06.009 · Cited by 73
Pinzon-Rodriguez, A., Bensch, S., & Muheim, R. (2018) · Journal of The Royal Society Interface · doi:10.1098/rsif.2018.0058 · Cited by 75
Cerdà, J., Mercadé, J., Lozano, J. J., Manchado, M., Tingaud‐Sequeira, A., Astola, A., Infante, C., Halm, S., Viñas, J., Castellana, B., et al. (2008) · BMC Genomics · doi:10.1186/1471-2164-9-508 · Cited by 75
Reynoso, M. A., Juntawong, P., Lancia, M., Blanco, F. A., Bailey-Serres, J. N., & Zanetti, M. E. (2015) · Methods in molecular biology · doi:10.1007/978-1-4939-2444-8_9 · Cited by 74
Discovery of physiological and cancer-related regulators of 3′ UTR processing with KAPAC
Gruber, A. J., Schmidt, R., Ghosh, S., Martin, G., Gruber, A. J., van Nimwegen, E., & Zavolan, M. (2018) · Genome biology · doi:10.1186/s13059-018-1415-3 · Cited by 75
Brain progranulin expression in GRN-associated frontotemporal lobar degeneration
Chen‐Plotkin, A. S., Xiao, J., Geser, F., Martinez‐Lage, M., Grossman, M., Unger, T. L., Wood, E. M., Deerlin, V. M. V., Trojanowski, J. Q., & Lee, V. M. ‐. (2009) · Acta Neuropathologica · doi:10.1007/s00401-009-0576-2 · Cited by 72
Brenaut, P., Bangera, R., Bevilacqua, C., Rebours, E., Cebo, C., & Martin, P. (2012) · Journal of Dairy Science · doi:10.3168/jds.2012-5604 · Cited by 73
Biobanking for Personalized Medicine
Liu, A., & Pollard, K. (2015) · Advances in experimental medicine and biology · doi:10.1007/978-3-319-20579-3_5 · Cited by 78
Silica-based solid-phase extraction of cross-linked nucleic acid–bound proteins
Asencio, C., Chatterjee, A., & Hentze, M. W. (2018) · Life Science Alliance · doi:10.26508/lsa.201800088 · Cited by 73
Matsuzaki, S., & Darcha, C. (2013) · PLoS ONE · doi:10.1371/journal.pone.0061690 · Cited by 72
Genetic influences on brain gene expression in rats selected for tameness and aggression
Heyne, H. O., Lautenschläger, S., Nelson, R., Besnier, F., Rotival, M., Cagan, A., Kozhemyakina, R., Plyusnina, I. Z., Trut, L., Carlborg, Ö., et al. (2014) · Genetics · doi:10.1534/genetics.114.168948 · Cited by 72
Reynier, F., Pachot, A., Paye, M., Xu, Q., Turrel-Davin, F., Petit, F., Hot, A., Auffray, C., Bendelac, N., Nicolino, M. P., et al. (2010) · Genes and Immunity · doi:10.1038/gene.2009.112 · Cited by 76
Wei, J., Huang, X., Zhang, Z., Jia, W. P., Zhao, Z., Zhang, Y., Liu, X., & Xu, G. (2013) · Molecular Immunology · doi:10.1016/j.molimm.2013.03.004 · Cited by 75
Progranulin expression is upregulated after spinal contusion in mice
Naphade, S. B., Kigerl, K. A., Jakeman, L. B., Kostyk, S. K., Popovich, P. G., & Kuret, J. (2009) · Acta Neuropathologica · doi:10.1007/s00401-009-0616-y · Cited by 71
Heterozygous OAS1 gain-of-function variants cause an autoinflammatory immunodeficiency
Magg, T., Okano, T., König, L. M., Boehmer, D. F. R., Schwartz, S. L., Inoue, K., Heimall, J. R., Licciardi, F., Ley‐Zaporozhan, J., Ferdman, R. M., et al. (2021) · Science Immunology · doi:10.1126/sciimmunol.abf9564 · Cited by 75
Siow, M. Y., Karen‐Ng, L. P., Vincent–Chong, V. K., Marhazlinda, J., Abraham, M., Rahman, Z. A., Kallarakkal, T. G., Yang, Y., Cheong, S., & Zain, R. B. (2013) · Oral Diseases · doi:10.1111/odi.12118 · Cited by 72
Bao, W.-G., Zhang, X., Zhang, J., Zhou, W., Bi, T., Wang, J., Yan, W., & Lin, A. (2012) · Annals of Surgical Oncology · doi:10.1245/s10434-012-2440-1 · Cited by 71
Núñez‐Sánchez, M. Á., Dávalos, A., González‐Sarrías, A., Casas‐Agustench, P., Visioli, F., Monedero‐Saiz, T., Espin, N. V. G.-T., Gómez‐Sánchez, M. B., Sánchez‐Álvarez, C., García‐Albert, A. M., et al. (2015) · Molecular Nutrition & Food Research · doi:10.1002/mnfr.201500357 · Cited by 71
Tingaud‐Sequeira, A., Chauvigné, F., Lozano, J. J., Agulleiro, M. J., Asensio, E., & Cerdà, J. (2009) · BMC Genomics · doi:10.1186/1471-2164-10-434 · Cited by 70
Dheilly, N. M., Lelong, C., Huvet, A., & Favrel, P. (2011) · BMC Genomics · doi:10.1186/1471-2164-12-468 · Cited by 70
Acetylcholine receptors from human muscle as pharmacological targets for ALS therapy
Palma, E., Reyes‐Ruiz, J. M., Lopergolo, D., Roseti, C., Bertollini, C., Ruffolo, G., Cifelli, P., Onesti, E., Limatola, C., Miledi, R., et al. (2016) · Proceedings of the National Academy of Sciences · doi:10.1073/pnas.1600251113 · Cited by 71
y Fortéa, J. O., Giraud, É., Regnault, B., Coppée, J., Milon, G., Lang, T., & Prina, E. (2009) · BMC Genomics · doi:10.1186/1471-2164-10-119 · Cited by 75
Dai, W., Wang, Q., Zhao, F., Liu, J., & Liu, H. (2018) · BMC Genomics · doi:10.1186/s12864-018-4808-5 · Cited by 69
Differential expression of anti-angiogenic factors and guidance genes in the developing macula.
Kozulin, P., Natoli, R., O’Brien, K. M. B., Madigan, M. C., & Provis, J. M. (2009) · PubMed Central · Cited by 69
Oosthuizen, J. L., Gomez, P., Ruan, J., Hackett, T., Moore, M. M., Knight, D. A., & Tebbutt, S. J. (2011) · PLoS ONE · doi:10.1371/journal.pone.0020527 · Cited by 68
Hanaford, A. R., Archer, T. C., Price, A. C., Kahlert, U. D., Maciaczyk, J., Nikkhah, G., Kim, J. W., Ehrenberger, T., Clemons, P. A., Dančík, V., et al. (2016) · Clinical Cancer Research · doi:10.1158/1078-0432.ccr-15-3011 · Cited by 69
Fleming, M. B., Hill, L. M., & Walters, C. (2018) · Annals of Botany · doi:10.1093/aob/mcy217 · Cited by 68
Expression of Cytokines and Chemokines as Predictors of Stroke Outcomes in Acute Ischemic Stroke
Martha, S. R., Cheng, Q. S., Fraser, J. F., Gong, L., Collier, L. A., Davis, S. M., Lukins, D. E., Alhajeri, A. A., Grupke, S. L., & Pennypacker, K. R. (2020) · Frontiers in Neurology · doi:10.3389/fneur.2019.01391 · Cited by 65
Advances in forensic DNA quantification: A review
Lee, S. B., McCord, B. R., & Buel, E. (2014) · Electrophoresis · doi:10.1002/elps.201400187 · Cited by 68
Time course analysis of RNA stability in human placenta
Fajardy, I., Moitrot, E., Vambergue, A., Vandersippe, M., Deruelle, P., & Rousseaux, J. (2009) · BMC Molecular Biology · doi:10.1186/1471-2199-10-21 · Cited by 68
Interferon-α drives monocyte gene expression in chronic unsuppressed HIV-1 infection
Rempel, H. C., Sun, B., Calosing, C., Pillai, S. K., & Pulliam, L. (2010) · AIDS · doi:10.1097/qad.0b013e32833ac623 · Cited by 69
Metabolic labeling and recovery of nascent RNA to accurately quantify mRNA stability
Russo, J., Heck, A. M., Wilusz, J., & Wilusz, C. J. (2017) · Methods · doi:10.1016/j.ymeth.2017.02.003 · Cited by 72
Lavery, R., Lardenois, A., Jian-Motamedi, F., Pauper, E., Gregoire, E. P., Vigier, C., Moreilhon, C., Primig, M., & Chaboissier, M. (2011) · Developmental Biology · doi:10.1016/j.ydbio.2011.03.029 · Cited by 67
Metzler-Zebeli, B. U., Hollmann, M., Sabitzer, S., Podstatzky, L., Klein, D., & Zebeli, Q. (2013) · Journal of Animal Science · doi:10.2527/jas.2012-5570 · Cited by 67
Metadata
- Authors
- Schroeder, A., Mueller, O., Stocker, S., Salowsky, R., Leiber, M., Gassmann, M., Lightfoot, S., Menzel, W., Granzow, M., & Ragg, T.
- Affiliations
- Agilent Technologies (United States) (US)
- Agilent Technologies (Germany) (DE)
- Karlsruhe Institute of Technology (DE)
- Corresponding author
- Mueller, Odilo
- Ragg, Thomas
- Venue
- BMC Molecular Biology
- Published
- 2006-01-31
- Volume
- 7
- Issue
- 1
- Pages
- 3-3
- ISSN
- 1471-2199 (ISSN-L)
- PMC
- PMC1413964
- OpenAlex
- W1696199194
- Cited by
- 2,623
- References
- 18
- Citations by year
- 2026: 97 · 2025: 106 · 2024: 135 · 2023: 111 · 2022: 132 · 2021: 172 · 2020: 129 · 2019: 108 · 2018: 169 · 2017: 138 · 2016: 166 · 2015: 149 · 2014: 162 · 2013: 180 · 2012: 145
- FWCI
- 33.21
- Type
- journal article
- Language
- en
- Open access
- hybrid
- doi.org
- Licence
- cc-by
- Locations
- BMC Molecular Biology (publishedVersion, cc-by)
- PubMed Central (publishedVersion, cc-by)
- PubMed (publishedVersion)
- DOAJ (DOAJ: Directory of Open Access Journals) (submittedVersion)
- Funders
- Johns Hopkins University
- Topics
- Life Sciences › Biochemistry, Genetics and Molecular Biology › Molecular Biology › Gene expression and cancer classification
- Life Sciences › Biochemistry, Genetics and Molecular Biology › Molecular Biology › Molecular Biology Techniques and Applications
- Life Sciences › Biochemistry, Genetics and Molecular Biology › Molecular Biology › Genomics and Phylogenetic Studies
- Keywords
- RNA integrity number, RNA quality control, Agilent 2100 Bioanalyzer, Bayesian feature selection, regression models, gene expression
- MeSH terms
- Algorithms, Animals, Bayes Theorem, Humans, Quality Control, RNA, Software, Linear Models, Polymerase Chain Reaction, Neural Networks, Computer, Gene Expression Profiling, Electrophoresis, Microchip, Mice, Rats
About these checks
Registry, retraction, Cites and statistics results are computed, not judged, with one exception: a printed reference that no index lists is read once by a model before it counts as a citation error. Claims are extracted by a model and kept only when their quote appears verbatim in the text; each cited source is then checked, with a model’s help, for whether it says what the claim relies on. Those verdicts can be wrong — read the claim’s quote and the cited source before relying on one.
Statistics and arithmetic are recomputed, not judged.
Confidence bands are shown only for fields calibrated on our annotated test set. None is calibrated yet, so no band is shown.
What counts as a claim ›How we measure confidence ›How we check this ›
Are you an author, or do you see a problem with this page? Request a review
