

The DOI matches its Crossref record; 44 of the 45 references it cites were found in a registry or an index, and 1 are not checked yet.
Assessment of regression-based methods to adjust for publication bias through a comprehensive simulation study
Open accessAbstract
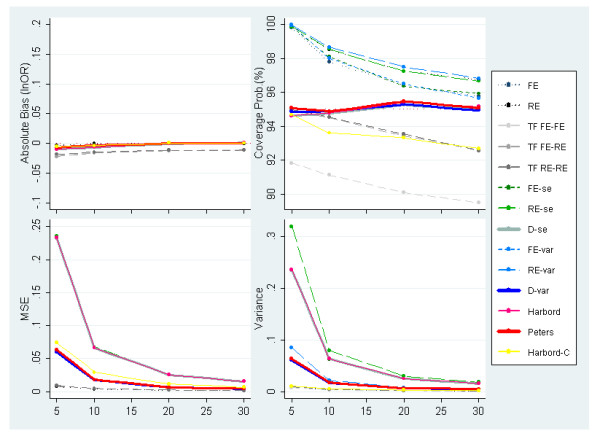
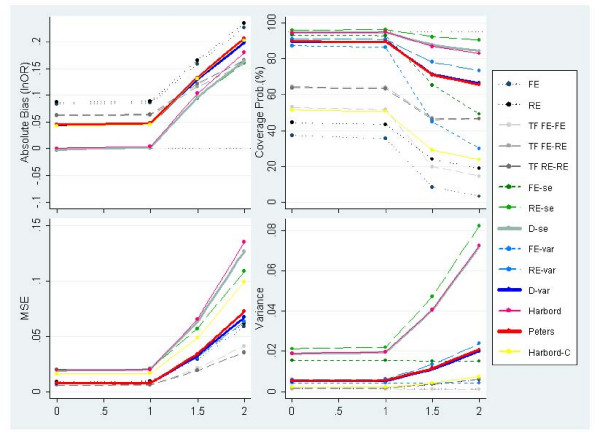
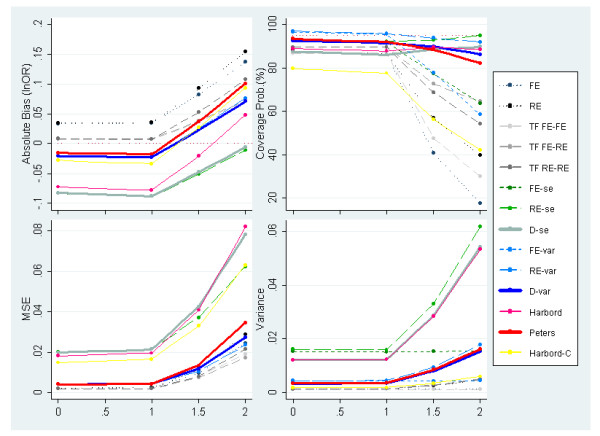
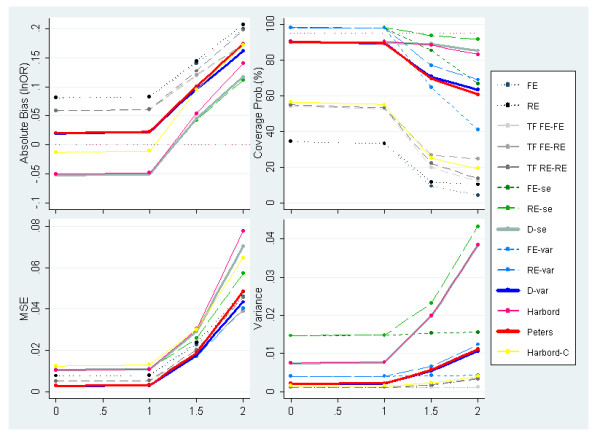
BACKGROUND: In meta-analysis, the presence of funnel plot asymmetry is attributed to publication or other small-study effects, which causes larger effects to be observed in the smaller studies. This issue potentially mean inappropriate conclusions are drawn from a meta-analysis. If meta-analysis is to be used to inform decision-making, a reliable way to adjust pooled estimates for potential funnel plot asymmetry is required. METHODS: A comprehensive simulation study is presented to assess the performance of different adjustment methods including the novel application of several regression-based methods (which are commonly applied to detect publication bias rather than adjust for it) and the popular Trim & Fill algorithm. Meta-analyses with binary outcomes, analysed on the log odds ratio scale, were simulated by considering scenarios with and without i) publication bias and; ii) heterogeneity. Publication bias was induced through two underlying mechanisms assuming the probability of publication depends on i) the study effect size; or ii) the p-value. RESULTS: The performance of all methods tended to worsen as unexplained heterogeneity increased and the number of studies in the meta-analysis decreased. Applying the methods conditional on an initial test for the presence of funnel plot asymmetry generally provided poorer performance than the unconditional use of the adjustment method. Several of the regression based methods consistently outperformed the Trim & Fill estimators. CONCLUSION: Regression-based adjustments for publication bias and other small study effects are easy to conduct and outperformed more established methods over a wide range of simulation scenarios.
Overview
The claims and statistics of this paper haven’t been checked yet.
Run the check — free, no account needed. It reads the open-access text and checks the sources it cites.
Integrity signals
Registry
Cites
Statistics
Figures
Verification
Claims the paper makes
The claims and statistics of this paper haven’t been checked yet.
Run the check — free, no account needed. It reads the open-access text and checks the sources it cites.
Claims other papers make about this one
Each is checked against this paper’s own text: does it say what the citing paper says it does?
The source backs part of the claim, not all of it — or backs it for a different population, condition or comparison.
In the citing paper
“However, more novel and promising methods, such as p-curve (Simonsohn, Nelson, & Simmons, 2014) and variations of Egger's regression (Egger, Smith, Schneider, & Minder, 1997;Moreno et al., 2009), have been found to perform better than the trim and fill method.”
From Working memory training revisited: A multi-level meta-analysis of n-back training studies (2017) · cites this paper as Moreno et al., 2009
Experimental — accuracy not yet measuredThe cited source says what the claim attributes to it.
In the citing paper
“Bias adjustments can improve performance relative to a meta-analysis that does not adjust for publication bias (Carter et al., 2019; McShane et al., 2016; Moreno et al., 2009; Simonsohn et al., 2014).”
From Do Salient Social Norms Moderate Mortality Salience Effects? A (Challenging) Meta-Analysis of Terror Management Studies (2023) · cites this paper as Moreno et al., 2009
Self-check
Percentages, sums and reported differences re-computed from the paper’s own numbers.
The self-check needs the paper’s full text.
Citations
Cites
Bias in meta-analysis detected by a simple, graphical test
Egger, M., Smith, G. D., Schneider, M., & Minder, C. (1997) · BMJ · doi:10.1136/bmj.315.7109.629 · Cited by 56,722
Quantifying heterogeneity in a meta‐analysis
Higgins, J. P. T., & Thompson, S. G. (2002) · Statistics in Medicine · doi:10.1002/sim.1186 · Cited by 36,763
(2005) · Springer eBooks · doi:10.1007/0-387-27255-0_9 · Cited by 20,333
McCullagh, P., & Nelder, J. A. (1989) · doi:10.1007/978-1-4899-3242-6 · Cited by 16,836
Duval, S., & Tweedie, R. (2000) · Biometrics · doi:10.1111/j.0006-341x.2000.00455.x · Cited by 14,099
Funnel plots for detecting bias in meta-analysis
Sterne, J. A. C., & Egger, M. (2001) · Journal of Clinical Epidemiology · doi:10.1016/s0895-4356(01)00377-8 · Cited by 3,779
A Nonparametric “Trim and Fill” Method of Accounting for Publication Bias in Meta-Analysis
Duval, S., & Tweedie, R. (2000) · Journal of the American Statistical Association · doi:10.1080/01621459.2000.10473905 · Cited by 2,955
Selective publication of antidepressant trials and its influence on apparent efficacy
Turner, E. H., Matthews, A. M., Linardatos, E., Tell, R. A., & Rosenthal, R. (2008) · New England Journal of Medicine · doi:10.1056/nejmsa065779 · Cited by 2,435
Publication Bias in Meta‐Analysis: Prevention, Assessment and Adjustments
(2005) · doi:10.1002/0470870168 · Cited by 2,368
Publication and related bias in meta-analysis
Sterne, J. A. C., Gavaghan, D., & Egger, M. (2000) · Journal of Clinical Epidemiology · doi:10.1016/s0895-4356(00)00242-0 · Cited by 2,282
Research works printed but not linked: 2
- Peters JL, Sutton AJ, Jones DR, Abrams KR: Performance of Tests and Adjustments for Publication Bias in the Presence of Heterogeneity. Technical report 05-01. 2005, Department of Health Sciences, University of Leicester
- Stata: Stata Statistical Software: Release 9.2. College Station, Texas. 2008
Cited by
Sorted by citations
Conducting Meta-Analyses in R with the metafor Package
Viechtbauer, W. (2010) · Journal of Statistical Software · doi:10.18637/jss.v036.i03 · Cited by 20,464
Sterne, J. A. C., Sutton, A. J., Ioannidis, J. P. A., Terrin, N., Jones, D. R., Lau, J., Carpenter, J., Rucker, G., Harbord, R. M., Schmid, C. H., et al. (2011) · BMJ · doi:10.1136/bmj.d4002 · Cited by 7,709
Self-citationLeucht, S., Cipriani, A., Spineli, L., Mavridis, D., Örey, D., Richter, F., Samara, M., Barbui, C., Engel, R. R., Geddes, J. R., et al. (2013) · The Lancet · doi:10.1016/s0140-6736(13)60733-3 · Cited by 2,561
An opportunity cost model of subjective effort and task performance
Kurzban, R., Duckworth, A., Kable, J. W., & Myers, J. (2013) · Behavioral and Brain Sciences · doi:10.1017/s0140525x12003196 · Cited by 1,381
Dissemination and publication of research findings: an updated review of related biases
Song, F., Parekh, Hooper, L., Loke, Y., Ryder, J., Sutton, A., Hing, C., Kwok, C., Pang, C., & Harvey, I. (2010) · Health Technology Assessment · doi:10.3310/hta14080 · Cited by 1,039
Self-citationAre Metabolically Healthy Overweight and Obesity Benign Conditions?
Kramer, C. K., Zinman, B., & Retnakaran, R. R. (2013) · Annals of Internal Medicine · doi:10.7326/0003-4819-159-11-201312030-00008 · Cited by 979
Stanley, T. D., & Doucouliagos, H. (2014) · Research Synthesis Methods · doi:10.1002/jrsm.1095 · Cited by 916
Self-citationType 2 diabetes and cancer: umbrella review of meta-analyses of observational studies
Tsilidis, K. K., Kasimis, J. C., López, D. S., Ntzani, E., & Ioannidis, J. P. A. (2015) · BMJ · doi:10.1136/bmj.g7607 · Cited by 885
Shi, L., & Lin, L. (2019) · Medicine · doi:10.1097/md.0000000000015987 · Cited by 818
Hunter, J. P., Saratzis, A., Sutton, A. J., Boucher, R. H., Sayers, R. D., & Bown, M. J. (2014) · Journal of Clinical Epidemiology · doi:10.1016/j.jclinepi.2014.03.003 · Cited by 786
Self-citationRoelfs, D. J., Shor, E., Davidson, K. W., & Schwartz, J. E. (2011) · Social Science & Medicine · doi:10.1016/j.socscimed.2011.01.005 · Cited by 759
O’Dea, R. E., Lagisz, M., Jennions, M. D., Koricheva, J., Noble, D. W. A., Parker, T. H., Gurevitch, J., Page, M. J., Stewart, G. B., Moher, D., et al. (2021) · Biological reviews/Biological reviews of the Cambridge Philosophical Society · doi:10.1111/brv.12721 · Cited by 825
The impact of study size on meta-analyses: examination of underpowered studies in Cochrane reviews
Turner, R. M., Bird, S. M., & Higgins, J. P. T. (2013) · PLoS ONE · doi:10.1371/journal.pone.0059202 · Cited by 672
Is bilingualism associated with enhanced executive functioning in adults? A meta-analytic review.
Lehtonen, M., Soveri, A., Laine, A., Järvenpää, J., de Bruin, A., & Antfolk, J. (2018) · Psychological Bulletin · doi:10.1037/bul0000142 · Cited by 711
Uttl, B., White, C. A., & Gonzalez, D. W. (2017) · Studies in Educational Evaluation · doi:10.1016/j.stueduc.2016.08.007 · Cited by 615
Correcting for Bias in Psychology: A Comparison of Meta-Analytic Methods
Carter, E. C., Schönbrodt, F. D., Gervais, W. M., & Hilgard, J. (2019) · Advances in Methods and Practices in Psychological Science · doi:10.1177/2515245919847196 · Cited by 588
The common sense model of self-regulation: Meta-analysis and test of a process model.
Hagger, M. S., Koch, S., Chatzisarantis, N. L. D., & Orbell, S. (2017) · Psychological Bulletin · doi:10.1037/bul0000118 · Cited by 622
Small study effects in meta-analyses of osteoarthritis trials: meta-epidemiological study
Nuesch, E., Trelle, S., Reichenbach, S., Rutjes, A. W. S., Tschannen, B., Altman, D. G., Egger, M., & Juni, P. (2010) · BMJ · doi:10.1136/bmj.c3515 · Cited by 559
Bowden, J., Tierney, J. F., Copas, A. J., & Burdett, S. (2011) · BMC Medical Research Methodology · doi:10.1186/1471-2288-11-41 · Cited by 555
Carter, E. C., Kofler, L. M., Forster, D. E., & McCullough, M. E. (2015) · Journal of Experimental Psychology: General · doi:10.1037/xge0000083 · Cited by 594
Chaimani, A., & Salanti, G. (2012) · Research Synthesis Methods · doi:10.1002/jrsm.57 · Cited by 521
Al Maqbali, M., Al Sinani, M., & Al-Lenjawi, B. (2021) · Journal of Psychosomatic Research · doi:10.1016/j.jpsychores.2020.110343 · Cited by 501
Evidence Synthesis for Decision Making 3
Dias, S., Sutton, A. J., Welton, N. J., & Ades, A. E. (2013) · Medical Decision Making · doi:10.1177/0272989x13485157 · Cited by 468
Self-citationEmpirical Comparison of Publication Bias Tests in Meta-Analysis
Lin, L., Chu, H., Murad, M. H., Hong, C., Qu, Z., Cole, S. R., & Chen, Y. (2018) · Journal of General Internal Medicine · doi:10.1007/s11606-018-4425-7 · Cited by 464
Methods for testing publication bias in ecological and evolutionary meta‐analyses
Nakagawa, S., Lagisz, M., Jennions, M. D., Koricheva, J., Noble, D. W. A., Parker, T. H., Sánchez‐Tójar, A., Yang, Y., & O'Dea, R. E. (2022) · Methods in Ecology and Evolution · doi:10.1111/2041-210x.13724 · Cited by 399
Disclosure of sensitive behaviors across self-administered survey modes: a meta-analysis
Gnambs, T., & Kaspar, K. (2015) · Behavior Research Methods · doi:10.3758/s13428-014-0533-4 · Cited by 422
Ahmed, I., Sutton, A. J., & Riley, R. D. (2012) · BMJ · doi:10.1136/bmj.d7762 · Cited by 404
Self-citationPublication Bias in the Organizational Sciences
Kepes, S., Banks, G. C., McDaniel, M. A., & Whetzel, D. L. (2012) · Organizational Research Methods · doi:10.1177/1094428112452760 · Cited by 416
Is Ego Depletion Real? An Analysis of Arguments
Friese, M., Loschelder, D. D., Gieseler, K., Frankenbach, J., & Inzlicht, M. (2018) · Personality and Social Psychology Review · doi:10.1177/1088868318762183 · Cited by 438
Consistent age-dependent declines in human semen quality: A systematic review and meta-analysis
Johnson, S. L., Dunleavy, J. E. M., Gemmell, N. J., & Nakagawa, S. (2014) · Ageing Research Reviews · doi:10.1016/j.arr.2014.10.007 · Cited by 397
The effectiveness of R&D subsidies: A meta-regression analysis of the evaluation literature
Dimos, C., & Pugh, G. (2016) · Research Policy · doi:10.1016/j.respol.2016.01.002 · Cited by 383
Carter, E. C., & McCullough, M. E. (2014) · Frontiers in Psychology · doi:10.3389/fpsyg.2014.00823 · Cited by 381
Working memory training revisited: A multi-level meta-analysis of n-back training studies
Soveri, A., Antfolk, J., Karlsson, L., Salo, B., & Laine, M. (2017) · Psychonomic Bulletin & Review · doi:10.3758/s13423-016-1217-0 · Cited by 371
Testing for funnel plot asymmetry of standardized mean differences
Pustejovsky, J. E., & Rodgers, M. A. (2019) · Research Synthesis Methods · doi:10.1002/jrsm.1332 · Cited by 354
Publication bias examined in meta-analyses from psychology and medicine: A meta-meta-analysis
van Aert, R. C. M., Wicherts, J. M., & van Assen, M. A. L. M. (2019) · PLoS ONE · doi:10.1371/journal.pone.0215052 · Cited by 365
Naci, H., Salcher-Konrad, M., Dias, S., Blum, M. R., Sahoo, S. A., Nunan, D., & Ioannidis, J. P. A. (2019) · British Journal of Sports Medicine · doi:10.1136/bjsports-2018-099921 · Cited by 326
Does Self-Control Training Improve Self-Control? A Meta-Analysis
Friese, M., Frankenbach, J., Job, V., & Loschelder, D. D. (2017) · Perspectives on Psychological Science · doi:10.1177/1745691617697076 · Cited by 360
Quality Control in Systematic Reviews and Meta-analyses
Bown, M. J., & Sutton, A. J. (2010) · European Journal of Vascular and Endovascular Surgery · doi:10.1016/j.ejvs.2010.07.011 · Cited by 340
Self-citationWhat meta-analyses reveal about the replicability of psychological research.
Stanley, T. D., Carter, E. C., & Doucouliagos, H. (2018) · Psychological Bulletin · doi:10.1037/bul0000169 · Cited by 307
Self-citationDechartres, A., Boutron, I., Trinquart, L., Charles, P., & Ravaud, P. (2011) · Annals of Internal Medicine · doi:10.7326/0003-4819-155-1-201107050-00006 · Cited by 307
Systematic Review of Randomized Trials on Vasoconstrictor Drugs for Hepatorenal Syndrome
Gluud, L. L., Christensen, K., Christensen, E. I., & Krag, A. A. (2009) · Hepatology · doi:10.1002/hep.23286 · Cited by 295
Koen, J. D., & Yonelinas, A. P. (2014) · Neuropsychology Review · doi:10.1007/s11065-014-9266-5 · Cited by 312
Treatment-effect estimates adjusted for small-study effects via a limit meta-analysis
Rücker, G., Schwarzer, G., Carpenter, J. R., Binder, H., & Schumacher, M. C. (2010) · Biostatistics · doi:10.1093/biostatistics/kxq046 · Cited by 295
Prevalence of Fatigue in Patients With Cancer: A Systematic Review and Meta-Analysis
Al Maqbali, M., Al Sinani, M., Al Naamani, Z., Al Badi, K., & Tanash, M. I. (2021) · Journal of Pain and Symptom Management · doi:10.1016/j.jpainsymman.2020.07.037 · Cited by 288
Detecting Selection Bias in Meta-Analyses with Multiple Outcomes: A Simulation Study
Fernández‐Castilla, B., Declercq, L., Jamshidi, L., Beretvas, S. N., Onghena, P., & Noortgate, W. V. D. (2019) · The Journal of Experimental Education · doi:10.1080/00220973.2019.1582470 · Cited by 312
Home safety education and provision of safety equipment for injury prevention
Kendrick, D., Young, B., Mason‐Jones, A. J., Ilyas, N., Achana, F. A., Cooper, N. J., Hubbard, S., Sutton, A. J., Smith, S. J., Wynn, P. M., et al. (2012) · Cochrane Database of Systematic Reviews · doi:10.1002/14651858.cd005014.pub3 · Cited by 280
Self-citationARE ALL ECONOMIC FACTS GREATLY EXAGGERATED? THEORY COMPETITION AND SELECTIVITY
Doucouliagos, H., & Stanley, T. D. (2011) · Journal of Economic Surveys · doi:10.1111/j.1467-6419.2011.00706.x · Cited by 302
Self-citationCheong-See, F., Schuit, E., Arroyo-Manzano, D., Khalil, A., Barrett, J., Joseph, K. S., Asztalos, E., Hack, K., Lewi, L., Lim, A., et al. (2016) · BMJ · doi:10.1136/bmj.i4353 · Cited by 275
Furlan, A. D., Yazdi, F., Tsertsvadze, A., Gross, A., van Tulder, M. W., Santaguida, L., Gagnier, J. J., Ammendolia, C., Dryden, T., Doucette, S. P., et al. (2011) · Evidence-based Complementary and Alternative Medicine · doi:10.1155/2012/953139 · Cited by 279
Shor, E., Roelfs, D. J., & Yogev, T. (2013) · Social Networks · doi:10.1016/j.socnet.2013.08.004 · Cited by 293
Meta-analysis using effect size distributions of only statistically significant studies.
van Assen, M. A. L. M., van Aert, R. C. M., & Wicherts, J. M. (2015) · Psychological Methods · doi:10.1037/met0000025 · Cited by 265
Contour-Enhanced Funnel Plots for Meta-Analysis
Palmer, T., Sutton, A. J., Peters, J., & Moreno, S. G. (2008) · The Stata Journal Promoting communications on statistics and Stata · doi:10.1177/1536867x0800800206 · Cited by 261
Self-citationNeither fixed nor random: weighted least squares meta‐analysis
Stanley, T. D., & Doucouliagos, H. (2015) · Statistics in Medicine · doi:10.1002/sim.6481 · Cited by 258
Self-citationStatistical methods for dealing with publication bias in meta‐analysis
Jin, Z., Zhou, X., & He, J. (2014) · Statistics in Medicine · doi:10.1002/sim.6342 · Cited by 262
Association Between Analytic Strategy and Estimates of Treatment Outcomes in Meta-analyses
Dechartres, A., Altman, D. G., Trinquart, L., Boutron, I., & Ravaud, P. (2014) · JAMA · doi:10.1001/jama.2014.8166 · Cited by 233
Limitations of PET-PEESE and Other Meta-Analysis Methods
Stanley, T. D. (2017) · Social Psychological and Personality Science · doi:10.1177/1948550617693062 · Cited by 229
Self-citationvan Aert, R. C. M., Wicherts, J. M., & van Assen, M. A. L. M. (2016) · Perspectives on Psychological Science · doi:10.1177/1745691616650874 · Cited by 219
Widowhood and Mortality: A Meta-Analysis and Meta-Regression
Shor, E., Roelfs, D. J., Curreli, M. A., Clemow, L., Burg, M. M., & Schwartz, J. E. (2012) · Demography · doi:10.1007/s13524-012-0096-x · Cited by 223
Debray, T. P. A., Moons, K. G. M., & Riley, R. D. (2018) · Research Synthesis Methods · doi:10.1002/jrsm.1266 · Cited by 212
Neither fixed nor random: weighted least squares meta‐regression
Stanley, T. D., & Doucouliagos, H. (2017) · Research Synthesis Methods · doi:10.1002/jrsm.1211 · Cited by 205
Self-citationWhitfield, T. J., Barnhofer, T., Acabchuk, R. L., Cohen, A., Lee, M., Schlosser, M., Arenaza‐Urquijo, E. M., Böttcher, A., Britton, W. B., Coll‐Padrós, N., et al. (2021) · Neuropsychology Review · doi:10.1007/s11065-021-09519-y · Cited by 247
Nüesch, E., Häuser, W., Bernardy, K., Barth, J., & Jüni, P. (2013) · Annals of the Rheumatic Diseases · doi:10.1136/annrheumdis-2011-201249 · Cited by 225
Borge, T. C., Aase, H., Brantsæter, A. L., & Biele, G. (2017) · BMJ Open · doi:10.1136/bmjopen-2017-016777 · Cited by 186
PICTURE THIS: A SIMPLE GRAPH THAT REVEALS MUCH ADO ABOUT RESEARCH
Stanley, T. D., & Doucouliagos, H. (2009) · Journal of Economic Surveys · doi:10.1111/j.1467-6419.2009.00593.x · Cited by 183
Self-citationMoreno, S. G., Sutton, A. J., Turner, E. H., Abrams, K. R., Cooper, N. J., Palmer, T. M., & Ades, A. E. (2009) · BMJ · doi:10.1136/bmj.b2981 · Cited by 184
Self-citationQureshi, W., Nasir, U., Alqalyoobi, S., O’Neal, W. T., Mawri, S., Sabbagh, S., Soliman, E. Z., & Al-Mallah, M. H. (2015) · The American Journal of Cardiology · doi:10.1016/j.amjcard.2015.08.046 · Cited by 184
Abraha, I., Cherubini, A., Cozzolino, F., De Florio, R., Luchetta, M. L., Rimland, J. M., Folletti, I., Marchesi, M., Germani, A., Orso, M., et al. (2015) · BMJ · doi:10.1136/bmj.h2445 · Cited by 165
Could It Be Better to Discard 90% of the Data? A Statistical Paradox
Stanley, T. D., Jarrell, S. B., & Doucouliagos, H. (2010) · The American Statistician · doi:10.1198/tast.2009.08205 · Cited by 170
Self-citationThe repeatability of cognitive performance: a meta-analysis
Cauchoix, M., Chow, P. K. Y., van Horik, J. O., Atance, C. M., Barbeau, E. J., Barragan‐Jason, G., Bize, P., Boussard, A., Buechel, S. D., Cabirol, A., et al. (2018) · Philosophical Transactions of the Royal Society B Biological Sciences · doi:10.1098/rstb.2017.0281 · Cited by 164
Assessing Publication Bias in Meta-Analyses in the Presence of Between-Study Heterogeneity
Peters, J., Sutton, A. J., Jones, D. R., Abrams, K. R., Rushton, L., & Moreno, S. G. (2010) · Journal of the Royal Statistical Society Series A (Statistics in Society) · doi:10.1111/j.1467-985x.2009.00629.x · Cited by 169
Self-citationPrevalence of sleep disturbance in patients with cancer: a systematic review and meta-analysis
Al Maqbali, M., Al Sinani, M., Alsayed, A., & Gleason, A. M. (2022) · Clinical Nursing Research · doi:10.1177/10547738221092146 · Cited by 167
A historical review of publication bias
Marks‐Anglin, A., & Chen, Y. (2020) · Research Synthesis Methods · doi:10.1002/jrsm.1452 · Cited by 165
Meta-analysis of marital dissolution and mortality: Reevaluating the intersection of gender and age
Shor, E., Roelfs, D. J., Bugyi, P., & Schwartz, J. E. (2012) · Social Science & Medicine · doi:10.1016/j.socscimed.2012.03.010 · Cited by 163
Hilgard, J., Engelhardt, C. R., & Rouder, J. N. (2017) · Psychological Bulletin · doi:10.1037/bul0000074 · Cited by 162
Hemingway, H., Philipson, P., Chen, R., Fitzpatrick, N. K., Damant, J., Shipley, M. J., Abrams, K. R., Moreno, S. G., McAllister, K. S. L., Palmer, S., et al. (2010) · PLoS Medicine · doi:10.1371/journal.pmed.1000286 · Cited by 161
Self-citationDias, S., Sutton, A. J., Welton, N. J., & Ades, A. E. (2011) · Bristol Research (University of Bristol) · Cited by 158
Self-citationTleyjeh, I. M., Abdulhak, A. A. B., Riaz, M. A., Alasmari, F. A., Garbati, M. A., Alghamdi, M. A. A., Khan, A. R., Al-Tannir, M. A., Erwin, P. J., Ibrahim, T., et al. (2012) · PLoS ONE · doi:10.1371/journal.pone.0050836 · Cited by 148
Self-citationAre estimates of the value of a statistical life exaggerated?
Doucouliagos, H., Stanley, T. D., & Giles, M. J. (2011) · Journal of Health Economics · doi:10.1016/j.jhealeco.2011.10.001 · Cited by 143
Self-citationHome safety education and provision of safety equipment for injury prevention (Review)
Kendrick, D., Young, B., Mason‐Jones, A. J., Ilyas, N., Achana, F. A., Cooper, N. J., Hubbard, S., Sutton, A. J., Smith, S. J., Wynn, P. M., et al. (2013) · Evidence-Based Child Health A Cochrane Review Journal · doi:10.1002/ebch.1911 · Cited by 148
Self-citationR&D and productivity in OECD firms and industries: A hierarchical meta-regression analysis
Uğur, M., Trushin, E., Solomon, E. M., & Guidi, F. (2016) · Research Policy · doi:10.1016/j.respol.2016.08.001 · Cited by 146
Detecting and adjusting for small‐study effects in meta‐analysis
Rücker, G., Carpenter, J. R., & Schwarzer, G. (2011) · Biometrical Journal · doi:10.1002/bimj.201000151 · Cited by 132
A kinked meta‐regression model for publication bias correction
Bom, P. R. D., & Rachinger, H. (2019) · Research Synthesis Methods · doi:10.1002/jrsm.1352 · Cited by 133
Dominance and plumage traits: meta-analysis and metaregression analysis
Santos, E. S. A., Scheck, D., & Nakagawa, S. (2011) · Animal Behaviour · doi:10.1016/j.anbehav.2011.03.022 · Cited by 135
Finding the power to reduce publication bias
Stanley, T. D., Doucouliagos, H., & Ioannidis, J. P. A. (2017) · Statistics in Medicine · doi:10.1002/sim.7228 · Cited by 131
Self-citationter Riet, G., Korevaar, D. A., Leenaars, M., Sterk, P. J., Noorden, C. J. F. V., Bouter, L. M., Lutter, R., Elferink, R. P. J. O., & Hooft, L. (2012) · PLoS ONE · doi:10.1371/journal.pone.0043404 · Cited by 134
ROB-MEN: a tool to assess risk of bias due to missing evidence in network meta-analysis
Chiocchia, V., Nikolakopoulou, A., Higgins, J. P. T., Page, M. J., Papakonstantinou, T., Cipriani, A., Furukawa, T. A., Siontis, G. C. M., Egger, M., & Salanti, G. (2021) · BMC Medicine · doi:10.1186/s12916-021-02166-3 · Cited by 129
Yildiz, A., Nikodem, M., Vieta, E., Correll, C. U., & Baldessarini, R. J. (2015) · Psychological Medicine · doi:10.1017/s0033291714001305 · Cited by 128
Poor nutritional condition promotes high‐risk behaviours: a systematic review and meta‐analysis
Moran, N. P., Sánchez‐Tójar, A., Schielzeth, H., & Reinhold, K. (2020) · Biological reviews/Biological reviews of the Cambridge Philosophical Society · doi:10.1111/brv.12655 · Cited by 129
Adjustment for reporting bias in network meta-analysis of antidepressant trials
Trinquart, L., Chatellier, G., & Ravaud, P. (2012) · BMC Medical Research Methodology · doi:10.1186/1471-2288-12-150 · Cited by 122
Cognitive control in media multitaskers: Two replication studies and a meta-Analysis
Wiradhany, W., & Nieuwenstein, M. R. (2017) · Attention, Perception, & Psychophysics · doi:10.3758/s13414-017-1408-4 · Cited by 121
Doleman, B., Freeman, S. C., Lund, J. N., Williams, J. P., & Sutton, A. J. (2020) · Research Synthesis Methods · doi:10.1002/jrsm.1414 · Cited by 123
Self-citationDoes the Alcohol Make Them Do It? Dating Violence Perpetration and Drinking Among Youth
Rothman, E. F., McNaughton Reyes, L., Johnson, R. M., & LaValley, M. (2012) · Epidemiologic Reviews · doi:10.1093/epirev/mxr027 · Cited by 120
Sainz, P. V., Vakil, E., Molina, S., Bassett, R. L., & Ost, D. E. (2019) · CHEST Journal · doi:10.1016/j.chest.2019.10.042 · Cited by 120
The role of the funnel plot in detecting publication and related biases in meta-analysis
Liu, J. L. (2011) · Evidence-Based Dentistry · doi:10.1038/sj.ebd.6400831 · Cited by 118
Evrenoglou, T., Metelli, S., & Chaimani, A. (2021) · Springer eBooks · doi:10.1007/978-3-319-52677-5_287-1 · Cited by 112
Mavranezouli, I., Daly, C., Welton, N. J., Deshpande, S., Berg, L., Bromham, N., Arnold, S. J., Phillippo, D., Wilcock, J., Xu, J., et al. (2022) · British Journal of Dermatology · doi:10.1111/bjd.21739 · Cited by 126
Smoking cessation interventions for adults aged 50 or older: A systematic review and meta-analysis
Chen, D., & Wu, L.-T. T. (2015) · Drug and Alcohol Dependence · doi:10.1016/j.drugalcdep.2015.06.004 · Cited by 109
Is ego depletion too incredible? Evidence for the overestimation of the depletion effect
Carter, E. C., & McCullough, M. E. (2013) · Behavioral and Brain Sciences · doi:10.1017/s0140525x13000952 · Cited by 109
Small-Study Effects in Meta-Analysis
Schwarzer, G., Carpenter, J. R., & Rücker, G. (2015) · Use R! · doi:10.1007/978-3-319-21416-0_5 · Cited by 114
Onasanya, O., Iyer, G. S., Lucas, E. J., Lin, D. H., Singh, S., & Alexander, G. C. (2016) · The Lancet Diabetes & Endocrinology · doi:10.1016/s2213-8587(16)30215-7 · Cited by 104
Metadata
- Authors
- Moreno, S. G., Sutton, A. J., Ades, A., Stanley, T. D., Abrams, K. R., Peters, J. L., & Cooper, N. J.
- Affiliations
- University of Leicester (GB)
- Hendrix College (US)
- Corresponding author
- Moreno, Santiago G
- Venue
- BMC Medical Research Methodology
- Published
- 2009-01-12
- Volume
- 9
- Issue
- 1
- Pages
- 2-2
- ISSN
- 1471-2288 (ISSN-L)
- PMC
- PMC2649158
- OpenAlex
- W1970128129
- Cited by
- 373
- References
- 44
- Citations by year
- 2026: 9 · 2025: 11 · 2024: 11 · 2023: 11 · 2022: 31 · 2021: 28 · 2020: 26 · 2019: 21 · 2018: 39 · 2017: 31 · 2016: 18 · 2015: 26 · 2014: 24 · 2013: 26 · 2012: 19
- FWCI
- 24.04
- Type
- journal article
- Language
- en
- Open access
- gold
- doi.org
- Licence
- Locations
- BMC Medical Research Methodology (publishedVersion, cc-by)
- Europe PMC (PubMed Central) (publishedVersion, cc-by)
- PubMed Central (publishedVersion, cc-by)
- PubMed (publishedVersion)
- DOAJ (DOAJ: Directory of Open Access Journals) (submittedVersion)
- Own your potential (DEAKIN) (submittedVersion)
- Figshare (submittedVersion, cc-by)
- Leicester Research Archive (University of Leicester) (submittedVersion, cc-by)
- Topics
- Social Sciences › Decision Sciences › Statistics, Probability and Uncertainty › Meta-analysis and systematic reviews
- Physical Sciences › Mathematics › Statistics and Probability › Statistical Methods in Epidemiology
- Social Sciences › Library and Information Sciences › scientometrics and bibliometrics research
- Keywords
- publication bias, small-study effects, trim and fill, funnel plot asymmetry, meta-analysis, heterogeneity, binary outcomes, odds ratio, simulation study
- MeSH terms
- Computer Simulation, Humans, Regression Analysis, Meta-Analysis as Topic, Odds Ratio, Randomized Controlled Trials as Topic, Publication Bias
About these checks
Registry, retraction, Cites and statistics results are computed, not judged, with one exception: a printed reference that no index lists is read once by a model before it counts as a citation error. Claims are extracted by a model and kept only when their quote appears verbatim in the text; each cited source is then checked, with a model’s help, for whether it says what the claim relies on. Those verdicts can be wrong — read the claim’s quote and the cited source before relying on one.
Statistics and arithmetic are recomputed, not judged.
Confidence bands are shown only for fields calibrated on our annotated test set. None is calibrated yet, so no band is shown.
What counts as a claim ›How we measure confidence ›How we check this ›
Are you an author, or do you see a problem with this page? Request a review
