

The DOI matches its Crossref record; 66 of the 67 references it cites were found in a registry or an index.
Do low-income neighbourhoods have the least green space? A cross-sectional study of Australia’s most populous cities
Open accessAbstract
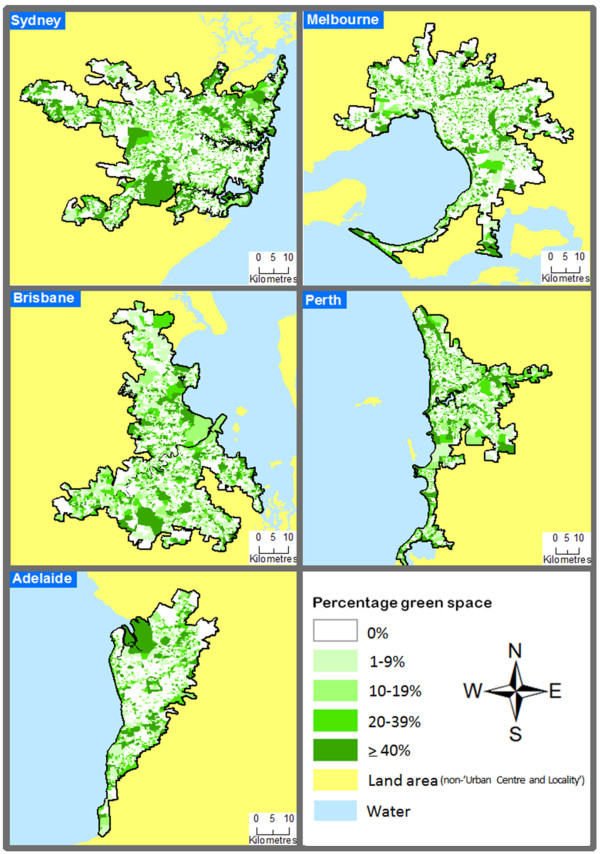
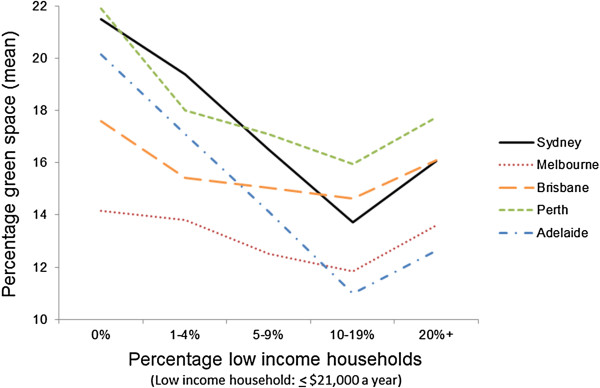
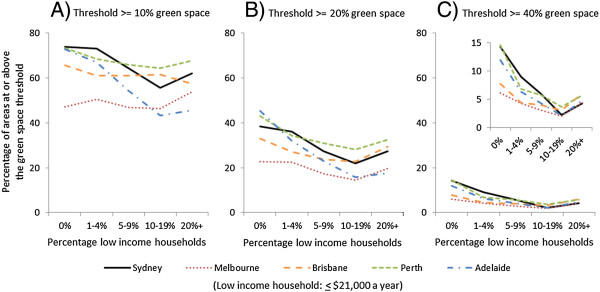
BACKGROUND: An inequitable distribution of parks and other 'green spaces' could exacerbate health inequalities if people on lower incomes, who are already at greater risk of preventable diseases, have poorer access. METHODS: The availability of green space within 1 kilometre of a Statistical Area 1 (SA1) was linked to data from the 2011 Australian census for Sydney (n = 4.6 M residents); Melbourne (n = 4.2 M); Brisbane (n = 2.2 M); Perth (n = 1.8 M); and Adelaide (n = 1.3 M). Socioeconomic circumstances were measured via the percentage population of each SA1 living on < $21,000 per annum. Negative binomial and logit regression models were used to investigate association between the availability of green space in relation to neighbourhood socioeconomic circumstances, adjusting for city and population density. RESULTS: Green space availability was substantively lower in SA1s with a higher percentage of low income residents (e.g. an incidence rate ratio of 0.82 (95% confidence interval (95% CI) 0.75, 0.89) was observed for SA1s containing ≥20% versus 0-1% low income residents). This association varied between cities (p < 0.001). Adelaide reported the least equitable distribution of green space, with approximately 20% greenery in the most affluent areas versus 12% availability in the least affluent. Although Melbourne had a smaller proportion of SA1s in the top quintile of green space availability (13.8%), the distribution of greenery was the most equitable of all the cities, with only a 0.5% difference in the availability of green space between SA1s containing 0-1% low income households versus those with ≥20%. Inequity of access, however, was reported across all cities when using logit regression to examine the availability of at least 20% (odds ratio 0.74, 95% CI 0.59, 0.93) or 40% (0.45, 0.29, 0.69) green space availability in the more disadvantaged versus affluent neighbourhoods. CONCLUSION: Affirmative action on green space planning is required to redress the socioeconomic inequity of access to this important public health resource.
Overview
The claims and statistics of this paper haven’t been checked yet.
Run the check — free, no account needed. It reads the open-access text and checks the sources it cites.
Integrity signals
Registry
Cites
Statistics
Figures
Verification
Claims the paper makes
The claims and statistics of this paper haven’t been checked yet.
Run the check — free, no account needed. It reads the open-access text and checks the sources it cites.
Claims other papers make about this one
Each is checked against this paper’s own text: does it say what the citing paper says it does?
The source backs part of the claim, not all of it — or backs it for a different population, condition or comparison.
In the citing paper
“This may be particularly important for children and adolescents from low socioeconomic backgrounds, who typically engage in greater amounts of ST [48–51] and are also less likely to live in green neighbourhoods [52].”
From Psychological impacts of “screen time” and “green time” for children and adolescents: A systematic scoping review (2020) · cites this paper as [52]
Experimental — accuracy not yet measured
Self-check
Percentages, sums and reported differences re-computed from the paper’s own numbers.
The self-check needs the paper’s full text.
Citations
Cites
Principles of geographical information systems
BURROUGH, P. A., & McDonnell, R. A. (1998) · Cited by 4,082
A Note on Robust Variance Estimation for Cluster‐Correlated Data
Williams, R. L. (2000) · Biometrics · doi:10.1111/j.0006-341x.2000.00645.x · Cited by 2,501
Aesthetic and affective response to natural environment
Ulrich, R. S. (1983) · Behavior and the Natural Environment · doi:10.1007/978-1-4613-3539-9_4 · Cited by 2,241
Tracking restoration in natural and urban field settings
Hartig, T., Evans, G. W., Jamner, L. D., Davis, D. S., & Gärling, T. (2003) · Journal of Environmental Psychology · doi:10.1016/s0272-4944(02)00109-3 · Cited by 2,118
Effect of exposure to natural environment on health inequalities: an observational population study
Mitchell, R., & Popham, F. (2008) · The Lancet · doi:10.1016/s0140-6736(08)61689-x · Cited by 2,099
A systematic review of evidence for the added benefits to health of exposure to natural environments
Bowler, D. E., Buyung-Ali, L. M., Knight, T. M., & Pullin, A. S. (2010) · BMC Public Health · doi:10.1186/1471-2458-10-456 · Cited by 1,993
Green space, urbanity, and health: how strong is the relation?
Maas, J., Verheij, R. A., Groenewegen, P. P., de Vries, S., & Spreeuwenberg, P. (2006) · Journal of Epidemiology and Community Health · doi:10.1136/jech.2005.043125 · Cited by 1,976
The health benefits of urban green spaces: a review of the evidence
Lee, A. C., & Maheswaran, R. (2010) · Journal of Public Health · doi:10.1093/pubmed/fdq068 · Cited by 1,583
Giles‐Corti, B., Broomhall, M. H., Knuiman, M. W., Collins, C. G., Douglas, K., Ng, K., Lange, A., & Donovan, R. J. (2005) · American Journal of Preventive Medicine · doi:10.1016/j.amepre.2004.10.018 · Cited by 1,523
Self-citationThompson Coon, J., Boddy, K., Stein, K., Whear, R., Barton, J., & Depledge, M. H. (2011) · Environmental Science & Technology · doi:10.1021/es102947t · Cited by 1,391
Research works printed but not linked: 8
- The Scottish Government: Good places, better health in Scotland. 2008, The Scottish Government: Edinburgh
- Department of Sustainability and Environment: Victorian Planning Provisions. 2013, Melbourne: Victorian State Government
- Western Australian Planning Commission: Liveable neighbourhoods: a Western Australian Government Sustainable Cities Initiative. 2004, Western Australian Planning Commission: Perth, WA
- Australian Bureau of Statistics: 3218.0 - Regional Population Growth, Australia, 2011: Population estimates and Australia’s new statistical geography. 2012, Canberra: Australian Bureau of Statistics
- Australian Bureau of Statistics: Australian Statistical Geography Standard (ASGS): Volume 4 - Significant Urban Areas, Urban Centres and Localities, Section of State. 2011, Canberra: Australian Bureau of Statistics
- Australian Bureau of Statistics: Australian Statistical Geography Standard (ASGS): Volume 1 - Main Structure and Greater Capital City Statistical Areas. 2011, Canberra:
- Australian Bureau of Statistics: Information paper, Draft Mesh Blocks. 2005, Canberra: Australian Bureau of Statistics
- Pink B: Technical Paper: Socio-Economic Indexes for Areas (SEIFA). 2011, Australian Bureau of Statistics: Canberra
Cited by
Sorted by citations
Items 301–350 of 350
Exploring the Relationship Between Green Space and Academic Performance
Demeaux, A. (2023) · doi:10.15760/honors.1388 · Cited by 1
Stanhope, J., Foley, K. M., Butler, M., Boddy, J., Clanchy, K., George, E., Roberts, R., Rothmore, P., Salter, A. B., Serocki, P., et al. (2024) · SocArXiv (OSF Preprints) · doi:10.31235/osf.io/nv95r · Cited by 1
Pratt, K., & Prahalad, V. N. (2024) · Research Square · doi:10.21203/rs.3.rs-5427912/v1 · Cited by 1
Cooper, N. J. (2015) · Research Online (University of Wollongong)
Planning for Physical Activity
Kent, J., & Thompson, S. M. (2019) · Routledge eBooks · doi:10.4324/9781315524573-6
The Paradox of Urban Greening: Does it Harm the Very People Who Need it the Most?
Maantay, J. A., Maroko, A., Anguelovski, I., & Connolly, J. J. (2020) · The International Journal of the Constructed Environment · doi:10.18848/2154-8587/cgp/v10i04/13-37
Redressing the balance in challenging urban environments
Freeman, C., & van Heezik, Y. (2018) · Routledge eBooks · doi:10.4324/9781315673103-10
Jayalatharachchi, M. (2020) · KTH Publication Database DiVA (KTH Royal Institute of Technology)
Guinaudeau, B. P., Brink, M., Schäffer, B., & Schlaepfer, M. A. (2022) · SSRN Electronic Journal · doi:10.2139/ssrn.4066216
Advances in Green Infrastructure Planning
Kim, H. (2022) · MDPI eBooks · doi:10.3390/books978-3-0365-3711-5
Song, L., Zhang, A., & Zhi, H. (2022) · doi:10.2196/preprints.41174
Researcher, I. (2022) · International Journal of Social Science and Human Research · doi:10.47191/ijsshr/v5-i7-65
The Disparity in Greenspace Quality Between Low and High SES Settings: A Case Study in Victoria
Ghanem, A., & Edirisinghe, R. K. (2022) · IOP Conference Series Earth and Environmental Science · doi:10.1088/1755-1315/1101/5/052032
Identifying Green Gentrification in Chongqing Central Park Based on Price Feature Model
Zhou, Y., & Xie, C. (2022) · BCP Business & Management · doi:10.54691/bcpbm.v33i.2729
Poor Children and Air Pollution Exposure Time for Action
Deguen, S., & Kihal, W. (2022) · Journal of Biomedical Research & Environmental Sciences · doi:10.37871/jbres1624
Do Larger Cities Enjoy Better Urban Green Space Accessibility? Evidence from ChinaPreprint
Chen, Y., Rosa, D. L., Yue, W., Xu, Z., & Zhuo, Y. (2023) · SSRN Electronic Journal · doi:10.2139/ssrn.4588428
Mokrzycki, S. (2023) · Critical approaches to children's literature · doi:10.1007/978-3-031-39888-9_5
(2024) · Frontiers research topics · doi:10.3389/978-2-8325-4665-9
Exploring multi-faceted accessibility of urban greenspaces
Lim, A. Y. M. (2023) · doi:10.32657/10356/174054
El trade-off entre calidad del aire y desigualdad de ingresos
Valle, A. L. (2024) · doi:10.35537/10915/167595
Examining the Impact of Urban Green Space Changes on Public Health
Jombo, S. (2024) · Sustainable development goals series · doi:10.1007/978-3-031-68734-1_8
Hynds, P. D., O’Dwyer, J., Boudou, M., Garvey, P., ÓhAiseadha, C. O., & Khandelwal, S. (2024) · Research Square · doi:10.21203/rs.3.rs-5012868/v1
The racial inequity of park visitation behavior in the post-pandemic era
Wu, X., Lü, Y., Wei, D., & Chen, W. Y. (2025) · Travel Behaviour and Society · doi:10.1016/j.tbs.2025.101105
Snowdon, N., Ratan, Z. A., Olcoń, K., Destry, P., & Allan, J. (2025) · BMC Health Services Research · doi:10.1186/s12913-025-13135-4
CORRELAÇÃO AMBIENTAL E SOCIOECONÔMICA NA CIDADE DE CAMPO GRANDE, MATO GROSSO DO SUL
Lamberti, P. P., dos Santos, A. B. C., Oliveira, D. R., Tieti, M. H., Yui, R. M. D. S., Constantino, M., da Costa, R. B., & Guilherme, D. D. O. (2025) · Revista de Geopolítica · doi:10.56238/revgeov16n5-014
Reduced social support perpetuates disadvantage across the lifespan for Australian women
Robertson, A. M., Knight, E., Proulx, J. D. E., Cruwys, T., Campbell, P., Sheanoda, V., Evans, O., & Reynolds, K. J. (2025) · BMC Women s Health · doi:10.1186/s12905-025-04133-z
Jamalishahni, T., Turrell, G., Foster, S., Davern, M. T., & Villanueva, K. (2024) · Figshare · doi:10.6084/m9.figshare.26579201
Yu, J., Teimouri, R., & Allan, A. (2025) · The urban book series · doi:10.1007/978-3-031-98300-9_13
Zirui, Y. A. O., Schirmer, J., Kanowski, P. J., & Xuemei, B. A. I. (2025) · Urban forestry & urban greening · doi:10.1016/j.ufug.2025.129247
Changing Land Ownership from Private to Public
Scaife, E. J. (2025) · SpringerBriefs in law · doi:10.1007/978-981-95-1857-9_6
BAŞGÜN, Ö. F., & Ünal, M. (2026) · GSI Journals Serie A Advancements in Tourism Recreation and Sports Sciences · doi:10.53353/atrss.1775832
Lee, S., Park, I., & Nam, J. W. (2026) · Research Square · doi:10.21203/rs.3.rs-8778778/v1
Pratt, K., & Prahalad, V. (2026) · Ambio · doi:10.1007/s13280-025-02335-1 · Cited by 1
Reframing nature connectedness as a psychosocial mechanism for youth mental health
Liu, F., Zhang, Z., Huang, Y., Wang, P., Bao, Z., Nou, Y., Zhang, Z., Sun, H., & Song, T. (2026) · Frontiers in Psychiatry · doi:10.3389/fpsyt.2026.1781920
Tackling the Challenges in Greening Our Cities for Health and Wellbeing
Williams, C., Tefera, Y., Kandulu, J., Lowe, M., Croeser, T., Humphrey, J., & Soebarto, V. I. (2026) · Urban sustainability · doi:10.1007/978-981-95-5487-4_3
Ahmed, N., Lee, J., Reining, C. E., Wray, A. J. D., Chu, E., Gilliland, J., & Lemieux, C. J. (2026) · Urban forestry & urban greening · doi:10.1016/j.ufug.2026.129444
Farangi, M. R., & Moorhouse, B. L. (2026) · International Journal of Early Childhood · doi:10.1007/s13158-026-00494-0
Kandulu, J., Soebarto, V. I., Caddy‐Retalic, S., Lowe, A. J., Kumar, P., Tefera, Y., & Williams, C. (2026) · Urban forestry & urban greening · doi:10.1016/j.ufug.2026.129516
Street view-based exposure to greenspace and mortality: the Multi-Ethnic Study of Atherosclerosis
Jimenez, M. P., Chivardi, M., Coull, B. A., Hystad, P., Roux, A. V. D., Kaufman, J. D., & James, P. (2026) · Environment International · doi:10.1016/j.envint.2026.110339 · Cited by 1
(196018), B. J., & Shuduo, L. U. (2026) · Landscape Architecture · doi:10.3724/j.fjyl.la20260127
Reid, R. A., Mavoa, S., Gilmartin‐Thomas, J., Foster, S., & Rachele, J. N. (2026) · Systematic Reviews · doi:10.1186/s13643-026-03237-3
Self-citationSocio-Spatial Inequalities in Access to Urban Public Parks: Implications for Spatial Justice
Omollo, W. O. (2026) · Journal of parks · doi:10.3390/jop1030011
Temel, A., Thiel, P., & Vance, C. (2026) · Cities · doi:10.1016/j.cities.2026.107425
Borujeni, S. C., HUETE, A. R., Pradhan, B., Nouri, H., Abbasi, N., & Nagler, P. L. (2026) · Remote Sensing · doi:10.3390/rs18152531
Greenspace and suicide rate: comparing and contrasting the U.S., England & Wales
Liu, S., & Gibbons, R. D. (2026) · Landscape and Urban Planning · doi:10.1016/j.landurbplan.2026.105780
Kuzich, S., Cherian, N., Izadpanahi, P., Blane, S., & Aniere, C. L. (2026) · Springer international handbooks of education · doi:10.1007/978-981-95-2591-1_46-1
Metadata
- Authors
- Astell-Burt, T., Feng, X., Mavoa, S., Badland, H. M., & Giles-Corti, B.
- Affiliations
- Western Sydney University (AU)
- The University of Melbourne (AU)
- Venue
- BMC Public Health
- Published
- 2014-03-31
- Volume
- 14
- Issue
- 1
- Pages
- 292-292
- ISSN
- 1471-2458 (ISSN-L)
- PMC
- PMC4005631
- OpenAlex
- W2149511701
- Cited by
- 351
- References
- 67
- Citations by year
- 2026: 19 · 2025: 42 · 2024: 55 · 2023: 43 · 2022: 40 · 2021: 53 · 2020: 31 · 2019: 19 · 2018: 16 · 2017: 18 · 2016: 8 · 2015: 6 · 2014: 1
- FWCI
- 7.23
- Type
- journal article
- Language
- en
- Open access
- gold
- doi.org
- Licence
- Locations
- BMC Public Health (publishedVersion, cc-by)
- Europe PMC (PubMed Central) (publishedVersion, cc-by)
- PubMed Central (publishedVersion, cc-by)
- PubMed (publishedVersion)
- Minerva Access (University of Melbourne) (submittedVersion, cc-by)
- Research Online (University of Wollongong) (submittedVersion)
- RMIT Research Repository (RMIT University Library) (submittedVersion)
- Figshare (submittedVersion)
- St Andrews Research Repository (St Andrews Research Repository) (submittedVersion, cc-by)
- Funders
- National Heart Foundation of Australia
- National Health and Medical Research Council (1004900)
- Topics
- Social Sciences › Urban Studies › Urban Green Space and Health
- Social Sciences › Sociology and Political Science › Environmental Justice and Health Disparities
- Social Sciences › Health › Health disparities and outcomes
- Keywords
- green spaces, parks, low-income neighbourhoods, green space accessibility, health disparities, urban vegetation, green space planning, Australian cities, population density
- MeSH terms
- Australia, Cities, Cross-Sectional Studies, Environment Design, Plants, Poverty Areas, Residence Characteristics, Socioeconomic Factors, Urban Population, Logistic Models
About these checks
Registry, retraction, Cites and statistics results are computed, not judged, with one exception: a printed reference that no index lists is read once by a model before it counts as a citation error. Claims are extracted by a model and kept only when their quote appears verbatim in the text; each cited source is then checked, with a model’s help, for whether it says what the claim relies on. Those verdicts can be wrong — read the claim’s quote and the cited source before relying on one.
Statistics and arithmetic are recomputed, not judged.
Confidence bands are shown only for fields calibrated on our annotated test set. None is calibrated yet, so no band is shown.
What counts as a claim ›How we measure confidence ›How we check this ›
Are you an author, or do you see a problem with this page? Request a review
