

The DOI matches its Crossref record; 49 of the 51 references it cites were found in a registry or an index.
Selenium hyperaccumulation offers protection from cell disruptor herbivores
Open accessAbstract
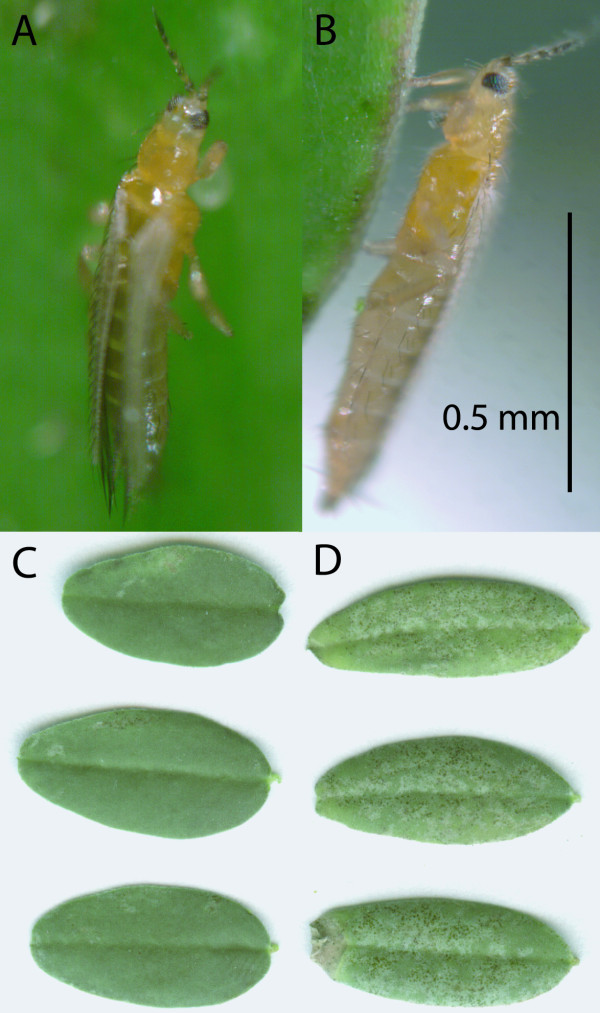
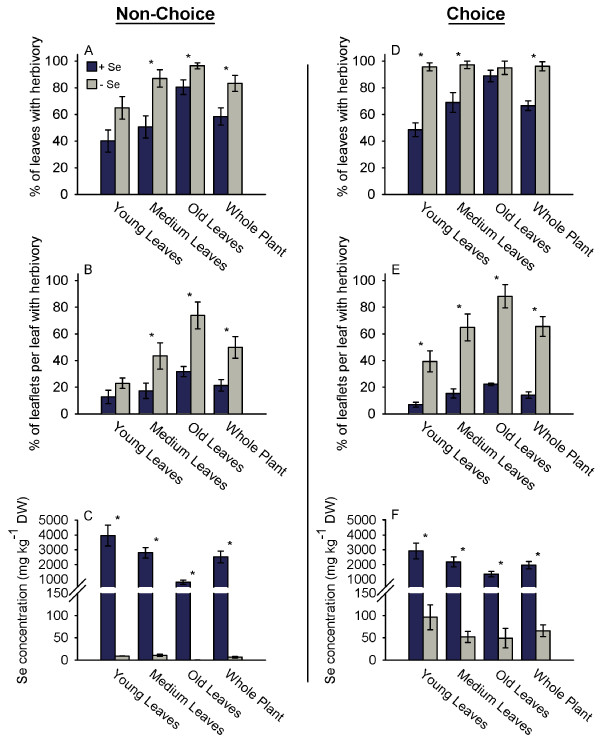
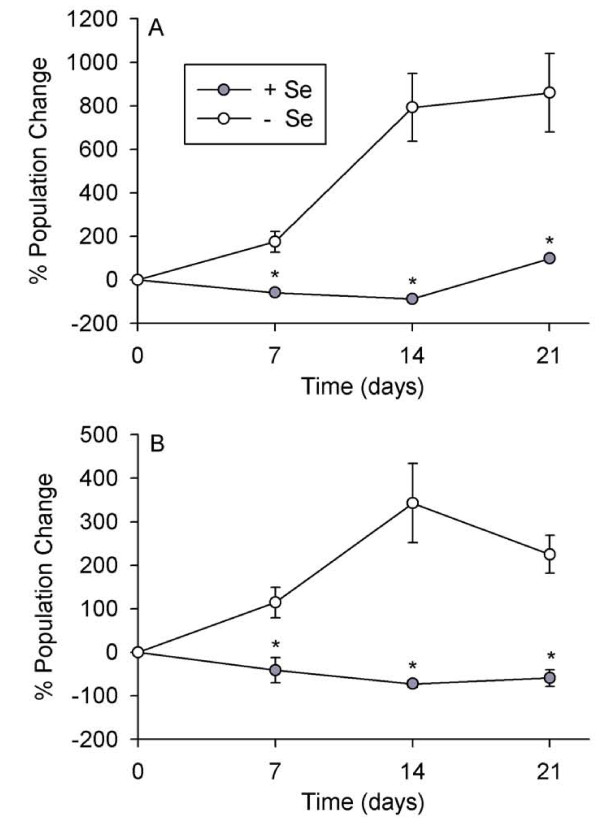
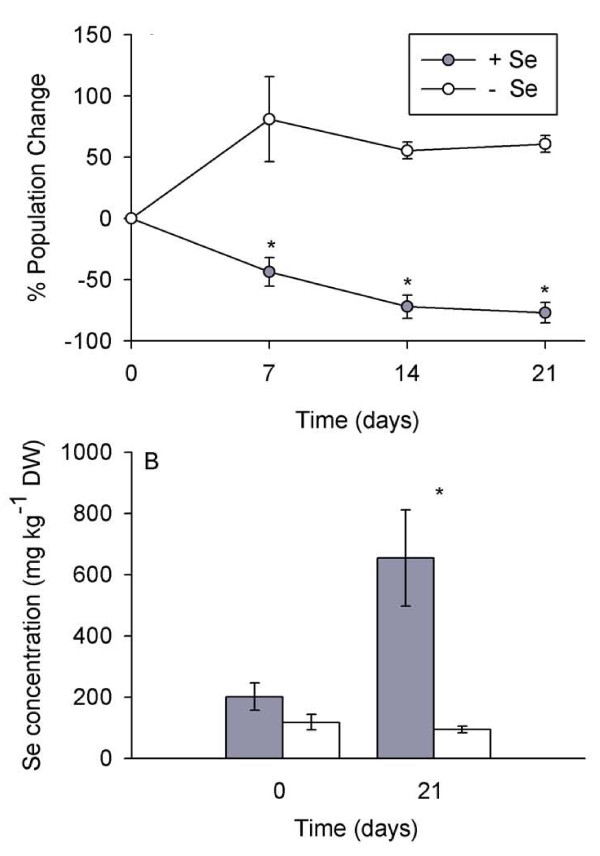
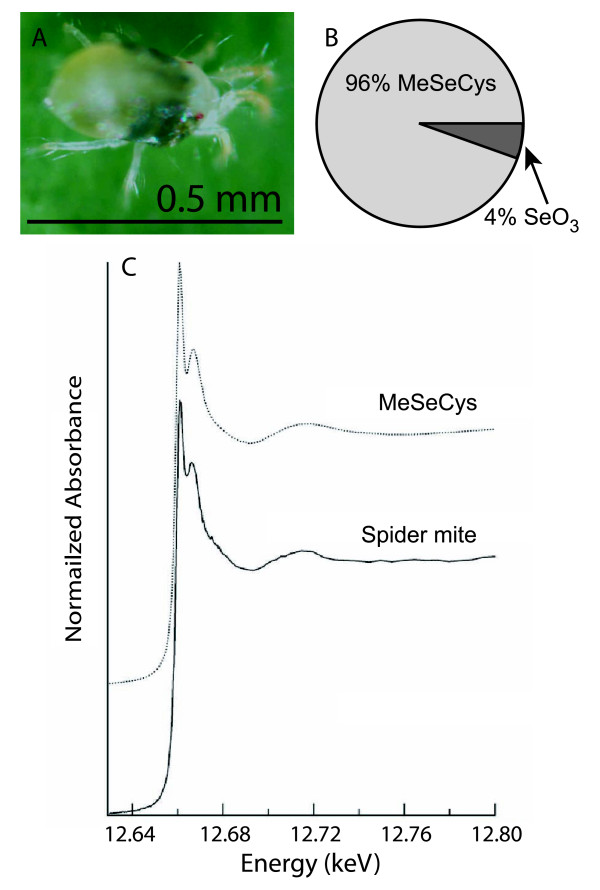
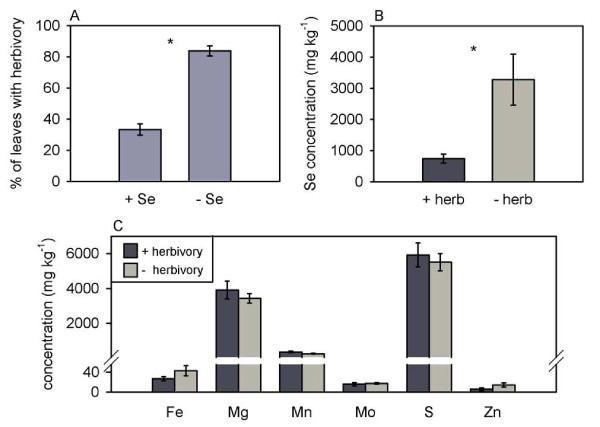
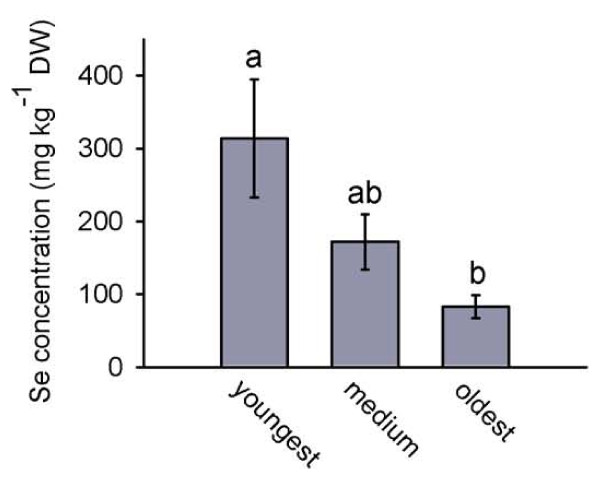
Background: Hyperaccumulation, the rare capacity of certain plant species to accumulate toxic trace elements to levels several orders of magnitude higher than other species growing on the same site, is thought to be an elemental defense mechanism against herbivores and pathogens. Previous research has shown that selenium (Se) hyperaccumulation protects plants from a variety of herbivores and pathogens. Selenium hyperaccumulating plants sequester Se in discrete locations in the leaf periphery, making them potentially more susceptible to some herbivore feeding modes than others. In this study we investigate the protective function of Se in the Se hyperaccumulators Stanleya pinnata and Astragalus bisulcatus against two cell disrupting herbivores, the western flower thrips (Frankliniella occidentalis) and the two-spotted spider mite (Tetranychus urticae). Results: Astragalus bisulcatus and S. pinnata with high Se concentrations (greater than 650 mg Se kg-1) were less subject to thrips herbivory than plants with low Se levels (less than 150 mg Se kg-1). Furthermore, in plants containing elevated Se levels, leaves with higher concentrations of Se suffered less herbivory than leaves with less Se. Spider mites also preferred to feed on low-Se A. bisulcatus and S. pinnata plants rather than high-Se plants. Spider mite populations on A. bisulcatus decreased after plants were given a higher concentration of Se. Interestingly, spider mites could colonize A. bisulcatus plants containing up to 200 mg Se kg-1 dry weight, concentrations which are toxic to many other herbivores. Selenium distribution and speciation studies using micro-focused X-ray fluorescence (μXRF) mapping and Se K-edge X-ray absorption spectroscopy revealed that the spider mites accumulated primarily methylselenocysteine, the relatively non-toxic form of Se that is also the predominant form of Se in hyperaccumulators. Conclusions: This is the first reported study investigating the protective effect of hyperaccumulated Se against cell-disrupting herbivores. The finding that Se protected the two hyperaccumulator species from both cell disruptors lends further support to the elemental defense hypothesis and increases the number of herbivores and feeding modes against which Se has shown a protective effect. Because western flower thrips and two-spotted spider mites are widespread and economically important herbivores, the results from this study also have potential applications in agriculture or horticulture, and implications for the management of Se-rich crops.
Overview
The claims and statistics of this paper haven’t been checked yet.
Run the check — free, no account needed. It reads the open-access text and checks the sources it cites.
Integrity signals
Registry
Cites
Statistics
Figures
Verification
Claims the paper makes
The claims and statistics of this paper haven’t been checked yet.
Run the check — free, no account needed. It reads the open-access text and checks the sources it cites.
Claims other papers make about this one
Each is checked against this paper’s own text: does it say what the citing paper says it does?
The cited source says what the claim attributes to it.
In the citing paper
“There is ample evidence to indicate that Se protects plants from herbivory [208,209,210,211,212,213,214,215,216]”
From Selenium Cycling Across Soil-Plant-Atmosphere Interfaces: A Critical Review (2015) · cites this paper as [213]
Self-check
Percentages, sums and reported differences re-computed from the paper’s own numbers.
The self-check needs the paper’s full text.
Citations
Cites
Effects of Selenium Supplementation for Cancer Prevention in Patients With Carcinoma of the Skin
Clark, L. (1996) · JAMA · doi:10.1001/jama.276.24.1957 · Cited by 2,988
Baker, A. J. M., & Brooks, R. R. (1989) · Cited by 2,213
Phytoremediation of toxic metals : using plants to clean up the environment
Raskin, I., & Ensley, B. D. (2000) · Wiley eBooks · Cited by 2,065
Spider mites: their biology, natural enemies and control
Helle, W., & Sabelis, M. W. (1985) · Cited by 1,711
Nutrient Resorption from Senescing Leaves of Perennials: Are there General Patterns?
Aerts, R. (1996) · Journal of Ecology · doi:10.2307/2261481 · Cited by 1,250
Zarcinas, B. A., Cartwright, B., & Spouncer, L. R. (1987) · Communications in Soil Science and Plant Analysis · doi:10.1080/00103628709367806 · Cited by 873
Plant resistance towards insect herbivores: a dynamic interaction
Gatehouse, J. A. (2002) · New Phytologist · doi:10.1046/j.1469-8137.2002.00519.x · Cited by 704
The Vegetation of Ultramafic (Serpentine) Soils.
Woodell, S. R. J., Baker, A. J. M., Proctor, J., & Reeves, R. D. (1994) · Journal of Ecology · doi:10.2307/2261312 · Cited by 598
Protection against reactive oxygen species by selenoproteins
Steinbrenner, H., & Sies, H. (2009) · Biochimica et Biophysica Acta (BBA) - General Subjects · doi:10.1016/j.bbagen.2009.02.014 · Cited by 522
Stadtman, T. C. (1990) · Annual Review of Biochemistry · doi:10.1146/annurev.bi.59.070190.000551 · Cited by 364
Karban, R., & Agrawal, A. A. (2002) · Annual Review of Ecology and Systematics · doi:10.1146/annurev.ecolsys.33.010802.150443 · Cited by 326
The Tomato crop : a scientific basis for improvement
Atherton, J. G., & Rudich, J. (1986) · Medical Entomology and Zoology · Cited by 316
Immaraju, J. A., Paine, T. D., Bethke, J. A., Robb, K. L., & Newman, J. P. (1992) · Journal of Economic Entomology · doi:10.1093/jee/85.1.9 · Cited by 301
Quantitative Elemental Analyses by Plasma Emission Spectroscopy
Fassel, V. A. (1978) · Science · doi:10.1126/science.202.4364.183 · Cited by 294
Freeman, J. L., Zhang, L. H., Marcus, M. A., Fakra, S., McGrath, S. P., & Pilon-Smits, E. A. H. (2006) · Plant Physiology · doi:10.1104/pp.106.081158 · Cited by 279
Self-citationBeamline 10.3.2 at ALS: a hard X-ray microprobe for environmental and materials sciences
Marcus, M. A., MacDowell, A. A., Celestre, R. S., Manceau, A., Miller, T., Padmore, H. A., & Sublett, R. E. (2004) · Journal of Synchrotron Radiation · doi:10.1107/s0909049504005837 · Cited by 267
Self-citationSelenium accumulation protects Brassica juncea from invertebrate herbivory and fungal infection
Hanson, B., Garifullina, G. F., Lindblom, S. D., Wangeline, A., Ackley, A., Kramer, K., Norton, A. P., Lawrence, C. B., & Pilon‐Smits, E. A. H. (2003) · New Phytologist · doi:10.1046/j.1469-8137.2003.00786.x · Cited by 253
Self-citationGaleas, M. L., Zhang, L. H., Freeman, J. L., Wegner, M., & Pilon‐Smits, E. A. H. (2007) · New Phytologist · doi:10.1111/j.1469-8137.2006.01943.x · Cited by 217
Self-citationSelenium protects plants from phloem‐feeding aphids due to both deterrence and toxicity
Hanson, B., Lindblom, S. D., Loeffler, M. L., & Pilon‐Smits, E. A. H. (2004) · New Phytologist · doi:10.1111/j.1469-8137.2004.01067.x · Cited by 212
Self-citationSors, T. G., Ellis, D. R., Na, G., Lahner, B., Lee, S., Leustek, T., Pickering, I. J., & Salt, D. E. (2005) · The Plant Journal · doi:10.1111/j.1365-313x.2005.02413.x · Cited by 209
Decline of photosynthetic capacity with leaf age and position in two tropical pioneer tree species
Kitajima, K., Mulkey, S. S., Samaniego, M., & Wright, S. J. (2002) · American Journal of Botany · doi:10.3732/ajb.89.12.1925 · Cited by 182
Deterrence of herbivory by zinc hyperaccumulation in Thlaspi caerulescens (Brassicaceae)
Pollard, A. J., & Baker, A. J. M. (1997) · New Phytologist · doi:10.1046/j.1469-8137.1997.00689.x · Cited by 178
Kok, L. J. D., Stulen, I., Rennenberg, H., Brunold, C., & Rauser, W. E. (1993) · SPB Academic Publishing eBooks · Cited by 170
A Multidisciplinary Approach to Management of Tomato Spotted Wilt Virus in Hawaii
Cho, J. J. (1989) · Plant Disease · doi:10.1094/pd-73-0375 · Cited by 153
Exclusion of Selenium from Proteins of Selenium-Tolerant Astragalus Species
Brown, T. A., & Shrift, A. (1981) · PLANT PHYSIOLOGY · doi:10.1104/pp.67.5.1051 · Cited by 146
Frankliniella occidentalis and other thrips harmful to vegetable and ornamental crops in Europe.
Tommasini, M. G., & Maini, S. (1995) · Cited by 140
Selenium-tolerant diamondback moth disarms hyperaccumulator plant defense
Freeman, J. L., Quinn, C. F., Marcus, M. A., Fakra, S., & Pilon-Smits, E. A. H. (2006) · Current Biology · doi:10.1016/j.cub.2006.09.015 · Cited by 128
Self-citationEcotypic variation in selenium accumulation among populations of Stanleya pinnata
Feist, L. J., & Parker, D. R. (2001) · New Phytologist · doi:10.1046/j.1469-8137.2001.00004.x · Cited by 125
Herron, G. A., & James, T. M. (2005) · Australian Journal of Entomology · doi:10.1111/j.1440-6055.2005.00478.x · Cited by 111
Biological control of thrips pests
Loomans, A. J. M., LENTEREN, J. C. V., Tommasini, M. G., Maini, S., & Riudavets, J. (1995) · Socio-Environmental Systems Modeling · Cited by 98
Selenium hyperaccumulation reduces plant arthropod loads in the field
Galeas, M. L., Klamper, E. M., Bennett, L. E., Freeman, J. L., Kondratieff, B. C., Quinn, C. F., & Pilon‐Smits, E. A. H. (2007) · New Phytologist · doi:10.1111/j.1469-8137.2007.02285.x · Cited by 94
Self-citationJhee, E. M., Boyd, R. S., & Eubanks, M. D. (2005) · New Phytologist · doi:10.1111/j.1469-8137.2005.01504.x · Cited by 93
Palatability of Thlaspi caerulescens for snails: influence of zinc and glucosinolates
Noret, N., Meerts, P., Tolrà, R. P., Poschenrieder, C., Barceló, J. A., & Escarré, J. (2004) · New Phytologist · doi:10.1111/j.1469-8137.2004.01286.x · Cited by 90
Integrated pest management for potatoes in the Western United States
van Emden, H. F. (1988) · Agricultural Systems · doi:10.1016/0308-521x(88)90039-x · Cited by 80
Boyd, R. S., Davis, M. A., Wall, M. A., & Balkwill, K. (2002) · Chemoecology · doi:10.1007/s00049-002-8331-3 · Cited by 78
THE USE OF INDICATOR PLANTS IN LOCATING SELENIFEROUS AREAS IN WESTERN UNITED STATES. I. GENERAL
Beath, O. A., Gilbert, C. S., & Eppson, H. F. (1939) · American Journal of Botany · doi:10.1002/j.1537-2197.1939.tb12900.x · Cited by 77
Rathinasabapathi, B., Rangasamy, M., Froeba, J., Cherry, R. H., McAuslane, H. J., Capinera, J. L., Srivastava, M., & Ma, L. Q. (2007) · New Phytologist · doi:10.1111/j.1469-8137.2007.02099.x · Cited by 72
Quinn, C. F., Freeman, J. L., Galeas, M. L., Klamper, E. M., & Pilon-Smits, E. A. H. (2008) · Oecologia · doi:10.1007/s00442-007-0907-8 · Cited by 71
Self-citationFreeman, J. L., Quinn, C. F., Lindblom, S. D., Klamper, E. M., & Pilon‐Smits, E. A. H. (2009) · American Journal of Botany · doi:10.3732/ajb.0800287 · Cited by 64
Self-citationJhee, E. M., Dandridge, K. L., Christy, A. M., & Pollard, A. J. (1999) · Chemoecology · doi:10.1007/s000490050038 · Cited by 63
Brunner, P. C., & Frey, J. E. (2010) · Journal of Evolutionary Biology · doi:10.1111/j.1420-9101.2010.01946.x · Cited by 46
Enhanced lung cancer cell killing by the combination of selenium and ionizing radiation
Shin, S. Y., Yoon, M. Y., Kim, M., Kim, J., Lee, S., Lee, Y., & Bae, S. (2007) · Oncology Reports · doi:10.3892/or.17.1.209 · Cited by 43
Selenium Decreases Thyroid Cancer Cell Growth by Increasing Expression of GADD153 and GADD34
Kato, M. A., Finley, D. J., Lubitz, C. C., Zhu, B., Moo, T.-A. S., Loeven, M. R., Ricci, J. A., Zarnegar, R., Katdare, M., & Fahey, T. J. (2009) · Nutrition and Cancer · doi:10.1080/01635580903191569 · Cited by 42
Flexner, J. L., Westigard, P. H., & Croft, B. A. (1988) · Journal of Economic Entomology · doi:10.1093/jee/81.6.1516 · Cited by 27
Biomass crops can be used for biological disinfestation and remediation of soils and water
Stapleton, J. J., & Bañuelos, G. S. (2008) · California Agriculture · doi:10.3733/ca.v063n01p41 · Cited by 26
Herron, G. A., & James, T. M. (2007) · General and Applied Entomology: The Journal of the Entomological Society of New South Wales · Cited by 19
Hardman, J. M., Franklin, J. L., Jensen, K. I. N., & Moreau, D. L. (2006) · Phytoparasitica · doi:10.1007/bf02981199 · Cited by 17
Enfermidades associadas à intoxicação por selênio em animais
de Oliveira, K. D., França, T. N., Nogueira, V. D. A., & Peixoto, P. V. (2007) · Pesquisa Veterinária Brasileira · doi:10.1590/s0100-736x2007000400001 · Cited by 12
Berlinger, M. J. (1986) · Springer eBooks · doi:10.1007/978-94-009-3137-4_10 · Cited by 10
Research works printed but not linked: 1
- Williams MR: Cotton Insect Losses. Procedings of Beltwide Cotton Production: 3-6 January 2006; Memphis, TN Conference by the National Cotton Council of America, Memphis, TN. 2006, 1151-1204.
Cited by
Sorted by citations
Plant Defense Against Herbivores: Chemical Aspects
Mithöfer, A., & Boland, W. (2012) · Annual Review of Plant Biology · doi:10.1146/annurev-arplant-042110-103854 · Cited by 1,669
An Overview of Selenium Uptake, Metabolism, and Toxicity in Plants
Gupta, M., & Gupta, S. (2017) · Frontiers in Plant Science · doi:10.3389/fpls.2016.02074 · Cited by 917
Selenium Cycling Across Soil-Plant-Atmosphere Interfaces: A Critical Review
Winkel, L., Vriens, B., Jones, G., Schneider, L., Pilon-Smits, E., & Bañuelos, G. (2015) · Nutrients · doi:10.3390/nu7064199 · Cited by 476
Self-citationSchiavon, M., & Pilon‐Smits, E. A. H. (2016) · New Phytologist · doi:10.1111/nph.14378 · Cited by 421
Self-citationAn overview of heavy metal challenge in plants: from roots to shoots
DalCorso, G., Manara, A., & Furini, A. (2013) · Metallomics · doi:10.1039/c3mt00038a · Cited by 325
Metadata
- Authors
- Quinn, C. F., Freeman, J. L., Reynolds, R. J., Cappa, J. J., Fakra, S. C., Marcus, M. A., Lindblom, S. D., Quinn, E. K., Bennett, L. E., & Pilon-Smits, E. A.
- Affiliations
- Colorado State University (US)
- Agricultural Research Service (US)
- Lawrence Berkeley National Laboratory (US)
- Venue
- BMC Ecology
- Published
- 2010-08-27
- Volume
- 10
- Issue
- 1
- Pages
- 19-19
- ISSN
- 1472-6785 (ISSN-L)
- PMC
- PMC2940900
- OpenAlex
- W2073655517
- Cited by
- 112
- References
- 51
- Citations by year
- 2026: 1 · 2025: 1 · 2024: 8 · 2023: 7 · 2022: 10 · 2021: 17 · 2020: 10 · 2019: 5 · 2018: 7 · 2017: 8 · 2016: 5 · 2015: 9 · 2014: 6 · 2013: 4 · 2012: 6
- FWCI
- 5.46
- Type
- journal article
- Language
- en
- Open access
- gold
- doi.org
- Licence
- cc-by
- Locations
- BMC Ecology (publishedVersion, cc-by)
- PubMed Central (publishedVersion, cc-by)
- PubMed (publishedVersion)
- University of North Texas Digital Library (University of North Texas) (submittedVersion)
- OSTI OAI (U.S. Department of Energy Office of Scientific and Technical Information) (submittedVersion)
- DOAJ (DOAJ: Directory of Open Access Journals) (submittedVersion)
- eScholarship (California Digital Library) (submittedVersion)
- Funders
- National Science Foundation (DEAC02-05CH11231, 0444471, 0817748)
- U.S. Department of Energy (-AC02-05CH11231, 05CH11231, DE AC02 05CH11231, DE-AC02-)
- Office of Science (DEAC02–05CH11231, AC02-05CH11231, DE-AC02, 05CH11231)
- Basic Energy Sciences (DE-AC02, DE-AC02-05CH11231., AC02–05CH11231)
- Topics
- Health Sciences › Nursing › Nutrition and Dietetics › Selenium in Biological Systems
- Life Sciences › Agricultural and Biological Sciences › Insect Science › Insect-Plant Interactions and Control
- Life Sciences › Agricultural and Biological Sciences › Plant Science › Plant Micronutrient Interactions and Effects
- Keywords
- selenium hyperaccumulation, plant-herbivore interactions, Stanleya pinnata, Astragalus bisulcatus, Frankliniella occidentalis, Tetranychus urticae, Tetranychidae, Thysanoptera, methylselenocysteine, selenium speciation, herbivore feeding preference
- MeSH terms
- Animals, Cysteine, Food Preferences, Insecta, Selenium, Organoselenium Compounds, Selenocysteine, Brassicaceae, Astragalus Plant, Tetranychidae
About these checks
Registry, retraction, Cites and statistics results are computed, not judged, with one exception: a printed reference that no index lists is read once by a model before it counts as a citation error. Claims are extracted by a model and kept only when their quote appears verbatim in the text; each cited source is then checked, with a model’s help, for whether it says what the claim relies on. Those verdicts can be wrong — read the claim’s quote and the cited source before relying on one.
Statistics and arithmetic are recomputed, not judged.
Confidence bands are shown only for fields calibrated on our annotated test set. None is calibrated yet, so no band is shown.
What counts as a claim ›How we measure confidence ›How we check this ›
Are you an author, or do you see a problem with this page? Request a review
