Cited by 103Neuroinflammation and Neurodegeneration MechanismsTraumatic Brain Injury and Neurovascular DisturbancesTryptophan and brain disorders

The DOI matches its Crossref record; 33 of the 33 references it cites were found in a registry or an index.

Tauroursodeoxycholic acid reduces glial cell activation in an animal model of acute neuroinflammation

Open access
Yanguas-Casás, Natalia, Barreda-Manso, M Asunción, Nieto-Sampedro, Manuel, Romero-Ramírez, Lorenzo·2014·Journal of Neuroinflammation

Abstract

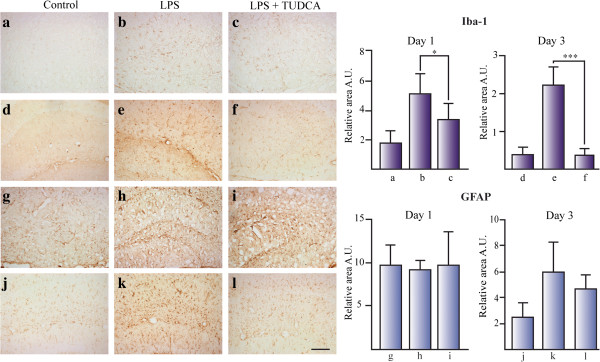
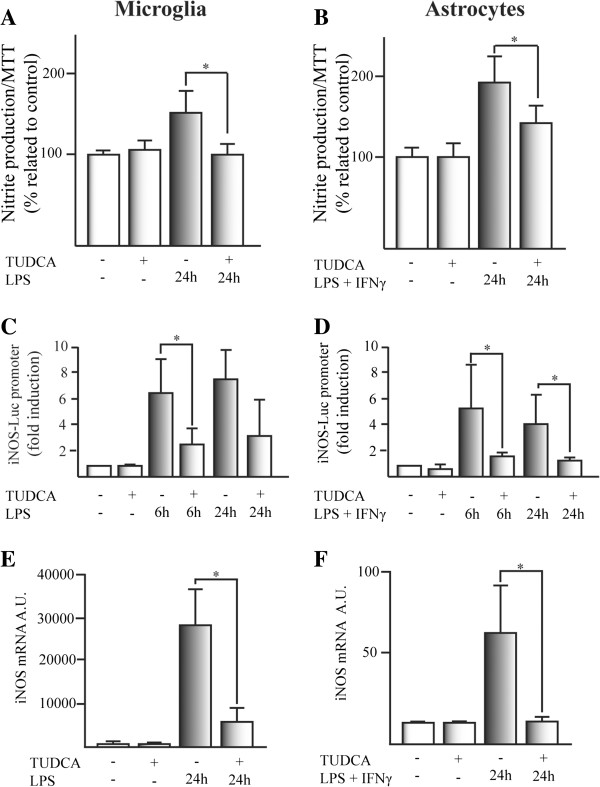
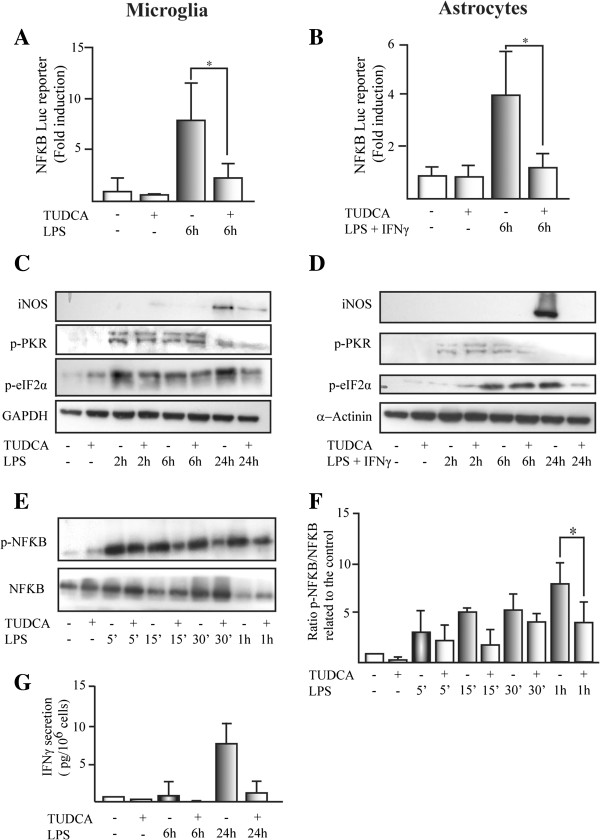
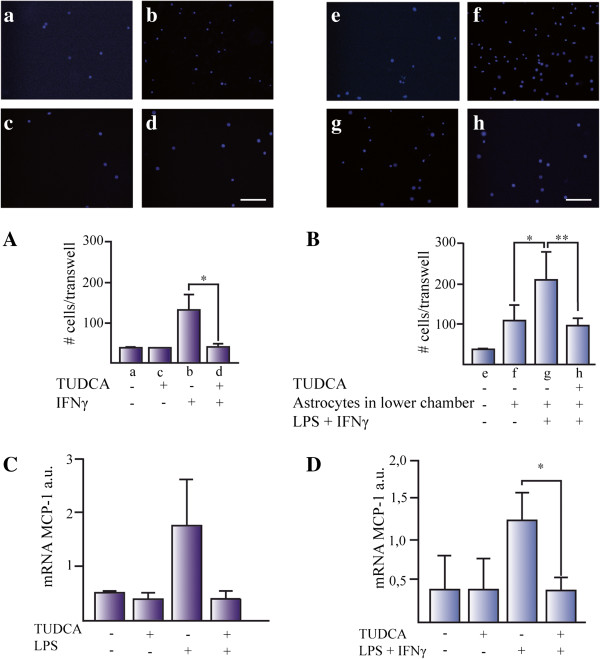
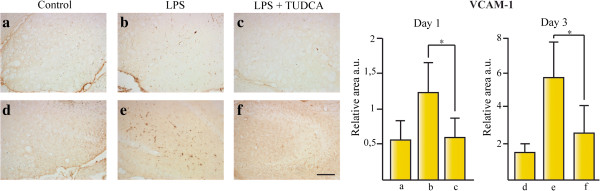
BACKGROUND: Bile acids are steroid acids found predominantly in the bile of mammals. The bile acid conjugate tauroursodeoxycholic acid (TUDCA) is a neuroprotective agent in different animal models of stroke and neurological diseases. However, the anti-inflammatory properties of TUDCA in the central nervous system (CNS) remain unknown. METHODS: The acute neuroinflammation model of intracerebroventricular (icv) injection with bacterial lipopolysaccharide (LPS) in C57BL/6 adult mice was used herein. Immunoreactivity against Iba-1, GFAP, and VCAM-1 was measured in coronal sections in the mice hippocampus. Primary cultures of microglial cells and astrocytes were obtained from neonatal Wistar rats. Glial cells were treated with proinflammatory stimuli to determine the effect of TUDCA on nitrite production and activation of inducible enzyme nitric oxide synthase (iNOS) and NFκB luciferase reporters. We studied the effect of TUDCA on transcriptional induction of iNOS and monocyte chemotactic protein-1 (MCP-1) mRNA as well as induction of protein expression and phosphorylation of different proteins from the NFκB pathway. RESULTS: TUDCA specifically reduces microglial reactivity in the hippocampus of mice treated by icv injection of LPS. TUDCA treatment reduced the production of nitrites by microglial cells and astrocytes induced by proinflammatory stimuli that led to transcriptional and translational diminution of the iNOS. This effect might be due to inhibition of the NFκB pathway, activated by proinflammatory stimuli. TUDCA decreased in vitro microglial migration induced by both IFN-γ and astrocytes treated with LPS plus IFN-γ. TUDCA inhibition of MCP-1 expression induced by proinflammatory stimuli could be in part responsible for this effect. VCAM-1 inmunoreactivity in the hippocampus of animals treated by icv LPS was reduced by TUDCA treatment, compared to animals treated with LPS alone. CONCLUSIONS: We show a triple anti-inflammatory effect of TUDCA on glial cells: i) reduced glial cell activation, ii) reduced microglial cell migratory capacity, and iii) reduced expression of chemoattractants (e.g., MCP-1) and vascular adhesion proteins (e.g., VCAM-1) required for microglial migration and blood monocyte invasion to the CNS inflammation site. Our results present a novel TUDCA anti-inflammatory mechanism, with therapeutic implications for inflammatory CNS diseases.

Overview

The claims and statistics of this paper haven’t been checked yet.

Run the check — free, no account needed. It reads the open-access text and checks the sources it cites.

A few free checks a day · papers already verified open instantly · results are public

Integrity signals

Registry

Crossref · 10.1186/1742-2094-11-50

Cites

33 of 33 references verified0 citation errors · 0 not checkable

Statistics

Figures

Figure 1 TUDCA reduces microglial activation in the hippocampus of LPS treated mice. The effect of TUDCA on glial activation was determined by the immunoreactive area for Iba-1 (for microglial cells) (a–f) and GFAP (for astrocytes) (g–l) related to total area in mice hippocampus icv injected with LPS. Section treatments are as follows: 1 day control (a, g), 1 day icv LPS (b, h), 1 day icv LPS + ip TUDCA (c, i), 3 day control (d, j), 3 day icv LPS (e, k), and 3 day icv LPS + ip TUDCA (f, l).*P <0.05, ***P <0.001. Scale bar represents 100 μm. The results represent the mean ± SD of at least 5 sections of 6 animals per group.
Figure 1 TUDCA reduces microglial activation in the hippocampus of LPS treated mice. The effect of TUDCA on glial activation was determined by the immunoreactive area for Iba-1 (for microglial cells) (a–f) and GFAP (for astrocytes) (g–l) related to total area in mice hippocampus icv injected with LPS. Section treatments are as follows: 1 day control (a, g), 1 day icv LPS (b, h), 1 day icv LPS + ip TUDCA (c, i), 3 day control (d, j), 3 day icv LPS (e, k), and 3 day icv LPS + ip TUDCA (f, l).*P <0.05, ***P <0.001. Scale bar represents 100 μm. The results represent the mean ± SD of at least 5 sections of 6 animals per group.CC BY · PubMed Central
Figure 2 TUDCA reduces proinflammatory stimuli-induced nitrite production in glial cell cultures through transcriptional inhibition of iNOS. Nitrite production was determined in (A) microglial cells and (B) astrocytes. Cells were pretreated with TUDCA for 2 h and the proinflammatory stimuli was added and incubated for an additional 24 h. The results represent the mean of the percentage related to control ± SD of at least six experiments (microglial cells) and at least four experiments (in astrocytes) in triplicate. The effect of TUDCA on proinflammatory stimuli-induced luciferase activation of the rat iNOS-pGL3 firefly reporter was studied in (C) microglial cells and (D) astrocytes. SV40-pRL Renilla reporter was used as a control for transfection efficiency. The results represent the mean of the fold induction related to the control ± SD of at least four experiments in triplicate. The expression of the mRNA for iNOS was determined by qPCR in (E) microglial cells and (F) astrocytes. The expression of mRNA for β-actin and the expression of mRNA for 36B4 were used as loading control for astrocytes and microglial cells, respectively. The results represent the mean of the ratio between the expression of mRNA for iNOS/expression of mRNA for β-actin or 36B4 ± SD of at least three experiments in triplicate.*P <0.05, **P <0.01.
Figure 2 TUDCA reduces proinflammatory stimuli-induced nitrite production in glial cell cultures through transcriptional inhibition of iNOS. Nitrite production was determined in (A) microglial cells and (B) astrocytes. Cells were pretreated with TUDCA for 2 h and the proinflammatory stimuli was added and incubated for an additional 24 h. The results represent the mean of the percentage related to control ± SD of at least six experiments (microglial cells) and at least four experiments (in astrocytes) in triplicate. The effect of TUDCA on proinflammatory stimuli-induced luciferase activation of the rat iNOS-pGL3 firefly reporter was studied in (C) microglial cells and (D) astrocytes. SV40-pRL Renilla reporter was used as a control for transfection efficiency. The results represent the mean of the fold induction related to the control ± SD of at least four experiments in triplicate. The expression of the mRNA for iNOS was determined by qPCR in (E) microglial cells and (F) astrocytes. The expression of mRNA for β-actin and the expression of mRNA for 36B4 were used as loading control for astrocytes and microglial cells, respectively. The results represent the mean of the ratio between the expression of mRNA for iNOS/expression of mRNA for β-actin or 36B4 ± SD of at least three experiments in triplicate.*P <0.05, **P <0.01.CC BY · PubMed Central
Figure 3 TUDCA inhibits proinflammatory stimuli-induced NFκB activation in glial cells. The effect of TUDCA on proinflammatory stimuli-induced luciferase activation of the NFκB-pGL3 firefly reporter was studied in (A) microglial cells and (B) astrocytes. SV40-pRL Renilla reporter was used as a control for transfection efficiency. The results represent the mean of the fold induction related to the control ± SD of at least four experiments in triplicate. The expression of iNOS and the phosphorylation status for PKR (p-PKR) and eIF2α (p-eIF2α) was studied by Western-blot in (C) microglial cells and (D) astrocytes. GAPDH and α-actinin were used as loading control for microglial cells and astrocytes, respectively. For band densitometries see Additional file 3. (E) NFκB activation was determined by the phosphorylation of p65 induced (p-NFκB) by LPS in microglial cells. The ratio between phosphorylated p65 related to the total p65 (NFκB) expression was presented in (F). The results represent the mean of the fold induction related to the control for phosphorylated p65 (NFκB)/total p65 (NFκB) ± SD of four independent experiments. (G) The secretion of the cytokines IFN-γ (pg/106 cells) was studied in the conditioned media of microglial cells. Data represent the mean (pg/106 cells) ± SD of four experiments in triplicate.*P <0.05.
Figure 3 TUDCA inhibits proinflammatory stimuli-induced NFκB activation in glial cells. The effect of TUDCA on proinflammatory stimuli-induced luciferase activation of the NFκB-pGL3 firefly reporter was studied in (A) microglial cells and (B) astrocytes. SV40-pRL Renilla reporter was used as a control for transfection efficiency. The results represent the mean of the fold induction related to the control ± SD of at least four experiments in triplicate. The expression of iNOS and the phosphorylation status for PKR (p-PKR) and eIF2α (p-eIF2α) was studied by Western-blot in (C) microglial cells and (D) astrocytes. GAPDH and α-actinin were used as loading control for microglial cells and astrocytes, respectively. For band densitometries see Additional file 3. (E) NFκB activation was determined by the phosphorylation of p65 induced (p-NFκB) by LPS in microglial cells. The ratio between phosphorylated p65 related to the total p65 (NFκB) expression was presented in (F). The results represent the mean of the fold induction related to the control for phosphorylated p65 (NFκB)/total p65 (NFκB) ± SD of four independent experiments. (G) The secretion of the cytokines IFN-γ (pg/106 cells) was studied in the conditioned media of microglial cells. Data represent the mean (pg/106 cells) ± SD of four experiments in triplicate.*P <0.05.CC BY · PubMed Central
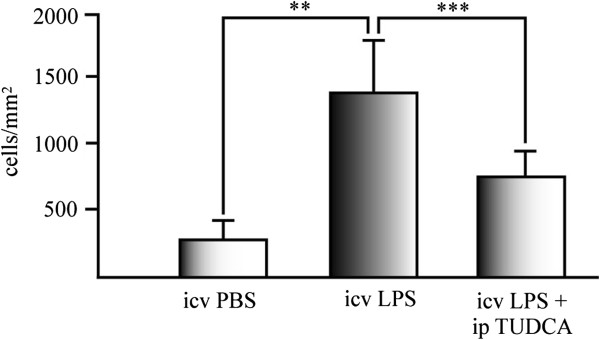
Figure 4 TUDCA reduces activated microglia in the hippocampus of LPS treated mice. Iba-1 positive cells were counted in hippocampal sections of treated mice after 3 days of icv injection of LPS. Data represents the mean of Iba-1 positive cells per mm2 of the mice hippocampus of five sections of at least six animals per experimental group. **P <0.01; ***P <0.001.
Figure 4 TUDCA reduces activated microglia in the hippocampus of LPS treated mice. Iba-1 positive cells were counted in hippocampal sections of treated mice after 3 days of icv injection of LPS. Data represents the mean of Iba-1 positive cells per mm2 of the mice hippocampus of five sections of at least six animals per experimental group. **P <0.01; ***P <0.001.CC BY · PubMed Central
Figure 5 TUDCA reduces microglia cell migration in vitro. Microglial migration was studied using (A) IFN-γ and (B) conditioned media from proinflammatory stimuli-activated astrocytes after 24 h exposure. (A) IFN-γ was added in the lower part of the Transwell and microglial cells were seeded in the upper part. DAPI positive cells attached to the lower part of the Transwell were counted. Data represents the mean of the number of cells ± SD of at least five fields of three Transwells for each experimental group. Representative pictures were taken from cells treated with (a) control media, (b) control plus TUDCA, (c) IFN-γ, and (d) IFN-γ + TUDCA. (B) Microglial migration was studied in media conditioned for 24 h from: (e) control media without astrocytes, (f) untreated astrocytes, (g) astrocytes treated with LPS plus IFN-γ, and (h) astrocytes pretreated with TUDCA and treated with LPS plus IFN-γ. The expression of the mRNA for MCP-1 was determined by qPCR in (C) microglial cells and (D) astrocytes. The expression of mRNA for 36B4 and β-actin were used as loading control for microglial cells and astrocytes, respectively. The results represent the mean of the ratio between the expression of mRNA for iNOS/expression of mRNA for β-actin or 36B4 ± SD of at least three experiments in triplicates. *P <0.05. Scale bars represent 50 μm.
Figure 5 TUDCA reduces microglia cell migration in vitro. Microglial migration was studied using (A) IFN-γ and (B) conditioned media from proinflammatory stimuli-activated astrocytes after 24 h exposure. (A) IFN-γ was added in the lower part of the Transwell and microglial cells were seeded in the upper part. DAPI positive cells attached to the lower part of the Transwell were counted. Data represents the mean of the number of cells ± SD of at least five fields of three Transwells for each experimental group. Representative pictures were taken from cells treated with (a) control media, (b) control plus TUDCA, (c) IFN-γ, and (d) IFN-γ + TUDCA. (B) Microglial migration was studied in media conditioned for 24 h from: (e) control media without astrocytes, (f) untreated astrocytes, (g) astrocytes treated with LPS plus IFN-γ, and (h) astrocytes pretreated with TUDCA and treated with LPS plus IFN-γ. The expression of the mRNA for MCP-1 was determined by qPCR in (C) microglial cells and (D) astrocytes. The expression of mRNA for 36B4 and β-actin were used as loading control for microglial cells and astrocytes, respectively. The results represent the mean of the ratio between the expression of mRNA for iNOS/expression of mRNA for β-actin or 36B4 ± SD of at least three experiments in triplicates. *P <0.05. Scale bars represent 50 μm.CC BY · PubMed Central
Figure 6 TUDCA reduces VCAM-1 expression in the hippocampus of LPS treated mice. The effect of TUDCA on vascular endothelium activation was determined by the immunoreactive area for VCAM-1 at 1 day (a–c) and 3 days (d–f) after icv injection with LPS related to total area in mice hippocampus. Section treatments are as follows: (a) untreated animals control for 1 day treatment, (b) animals sacrificed 1 day after icv injection of LPS, (c) animals sacrificed 1 day after icv injection of LPS and treated with ip injections of TUDCA, (d) untreated animals sacrificed after 3 days, (e) animals sacrificed 3 days after icv injection of LPS, and (f) animals sacrificed 3 days after icv injection of LPS and treated with ip injections of TUDCA.*P <0.05, ***P <0.001. Scale bar represents 100 μm. The results represent the mean ± SD of at least five sections of six animals per group.
Figure 6 TUDCA reduces VCAM-1 expression in the hippocampus of LPS treated mice. The effect of TUDCA on vascular endothelium activation was determined by the immunoreactive area for VCAM-1 at 1 day (a–c) and 3 days (d–f) after icv injection with LPS related to total area in mice hippocampus. Section treatments are as follows: (a) untreated animals control for 1 day treatment, (b) animals sacrificed 1 day after icv injection of LPS, (c) animals sacrificed 1 day after icv injection of LPS and treated with ip injections of TUDCA, (d) untreated animals sacrificed after 3 days, (e) animals sacrificed 3 days after icv injection of LPS, and (f) animals sacrificed 3 days after icv injection of LPS and treated with ip injections of TUDCA.*P <0.05, ***P <0.001. Scale bar represents 100 μm. The results represent the mean ± SD of at least five sections of six animals per group.CC BY · PubMed Central

Verification

Claims the paper makes

The claims and statistics of this paper haven’t been checked yet.

Run the check — free, no account needed. It reads the open-access text and checks the sources it cites.

A few free checks a day · papers already verified open instantly · results are public

Claims other papers make about this one

Each is checked against this paper’s own text: does it say what the citing paper says it does?

Self-check

Percentages, sums and reported differences re-computed from the paper’s own numbers.

The self-check needs the paper’s full text.

Citations

Cites

Show all 33 references

Cited by

Sorted by citations

Items 101–103 of 103

Metadata

Authors
Yanguas-Casás, N., Barreda-Manso, M. A., Nieto-Sampedro, M., & Romero-Ramírez, L.
Affiliations
Instituto Cajal (ES)
Venue
Journal of Neuroinflammation
Published
2014-03-19
Volume
11
Issue
1
Pages
50-50
ISSN
1742-2094 (ISSN-L)
OpenAlex
W2119521536
Cited by
103
References
33
Citations by year
2026: 7 · 2025: 7 · 2024: 12 · 2023: 6 · 2022: 13 · 2021: 13 · 2020: 3 · 2019: 7 · 2018: 6 · 2017: 8 · 2016: 7 · 2015: 8 · 2014: 5
FWCI
4.86
Type
journal article
Language
en
Open access
Licence
cc-by
Locations
  • Journal of Neuroinflammation (publishedVersion, cc-by)
  • Europe PMC (PubMed Central) (publishedVersion, cc-by)
  • PubMed Central (publishedVersion, cc-by)
  • PubMed (publishedVersion)
  • DIGITAL.CSIC (Spanish National Research Council (CSIC)) (submittedVersion, cc-by)
Funders
Ministerio de Ciencia e Innovación (SAF2009-11257, SAF2012-40126)
Topics
  • Life Sciences › Neuroscience › Neurology › Neuroinflammation and Neurodegeneration Mechanisms
  • Health Sciences › Medicine › Clinical Neurology › Traumatic Brain Injury and Neurovascular Disturbances
  • Life Sciences › Neuroscience › Biological Psychiatry › Tryptophan and brain disorders
Keywords
tauroursodeoxycholic acid, bile acids, neuroinflammation, glial activation, microglial activation, astrocytes, lipopolysaccharide, NF-κB signaling, nitric oxide synthase, MCP-1, VCAM-1, microglial migration, hippocampus, anti-inflammatory activity, neuroprotection, blood-brain barrier
MeSH terms
Animals, Animals, Newborn, Calcium-Binding Proteins, Cell Movement, Cells, Cultured, Cholagogues and Choleretics, Disease Models, Animal, Encephalitis, Gene Expression Regulation, Glial Fibrillary Acidic Protein, Hippocampus, Injections, Intraventricular, Lipopolysaccharides, Mice, Inbred C57BL, Microfilament Proteins, Neuroglia, Nitrites, Taurochenodeoxycholic Acid, Rats, Wistar, Vascular Cell Adhesion Molecule-1, Cell Proliferation

About these checks

Registry, retraction, Cites and statistics results are computed, not judged, with one exception: a printed reference that no index lists is read once by a model before it counts as a citation error. Claims are extracted by a model and kept only when their quote appears verbatim in the text; each cited source is then checked, with a model’s help, for whether it says what the claim relies on. Those verdicts can be wrong — read the claim’s quote and the cited source before relying on one.

Statistics and arithmetic are recomputed, not judged.

Confidence bands are shown only for fields calibrated on our annotated test set. None is calibrated yet, so no band is shown.

What counts as a claim ›How we measure confidence ›How we check this ›

Are you an author, or do you see a problem with this page? Request a review