

The DOI matches its Crossref record; 47 of the 48 references it cites were found in a registry or an index.
The acute inflammatory response to intranigral α-synuclein differs significantly from intranigral lipopolysaccharide and is exacerbated by peripheral inflammation
Open accessAbstract
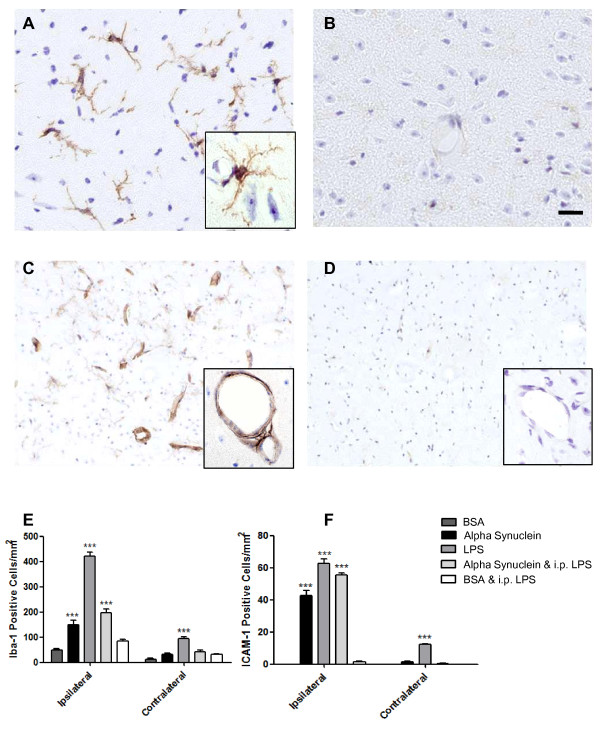
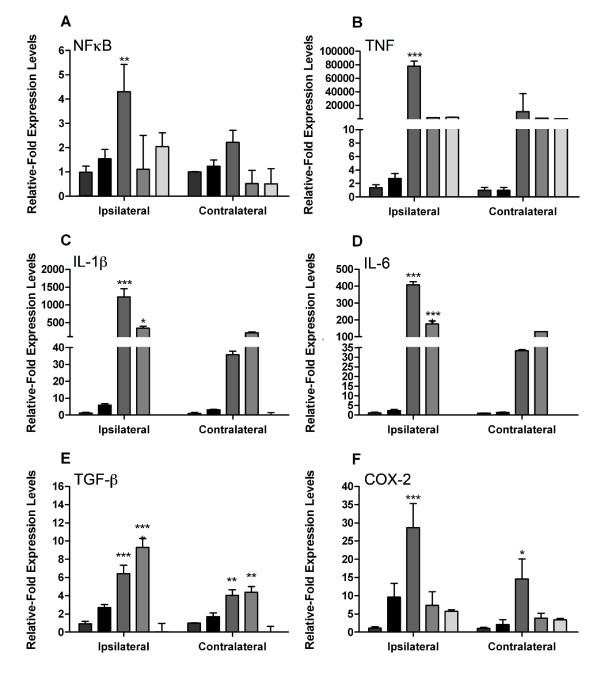
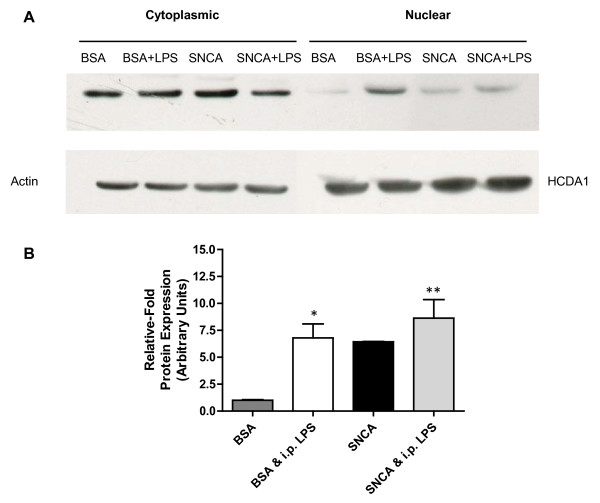
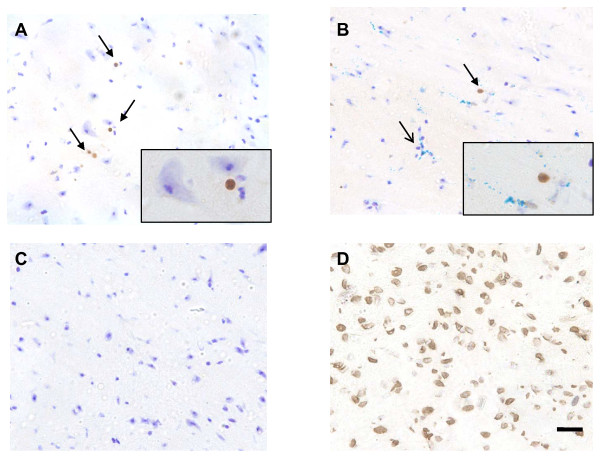
Background: Activated microglia are a feature of the host response to neurodegeneration in Parkinson's disease (PD) and are thought to contribute to disease progression. Recent evidence suggests that extracellular α-synuclein (eSNCA) may play an important role in the pathogenesis of PD and that this may be mediated by a microglial response. Methods: We wished to discover whether the host response to eSNCA would be sufficient to induce significant cytokine production. In vitro cultured BV-2 microglia were used to determine the basic inflammatory response to eSNCA. In vivo , 8-week old Biozzi mice were subjected to a single intranigral injection of either 3 μg SNCA, lipopolysaccharide (LPS) or serum protein (BSA) and allowed to recover for 24 hours. A second cohort of animals were peripherally challenged with LPS (0.5 mg/kg) 6 hours prior to tissue collection. Inflammation was studied by quantitative real-time PCR for a number of pro-inflammatory genes and immunohistochemistry for microglial activation, endothelial activation and cell death. Results: In vitro data showed a robust microglial response to SNCA, including a positive NFĸB response and the production of pro-inflammatory cytokines. Direct injection of SNCA into the substantia nigra resulted in the upregulation of mRNA expression of proinflammatory cytokines, the expression of endothelial markers of inflammation and microglial activation. However, these results were significantly different to those obtained after direct injection of LPS. By contrast, when the animals were injected intracerebrally with SNCA and subsequently challenged with systemic LPS, the level of production of IL-1β in the substantia nigra became comparable to that induced by the direct injection of LPS into the brain. The injection of albumin into the nigra with a peripheral LPS challenge did not provoke the production of a significant inflammatory response. Direct injection of LPS into the substantia nigra also induces cell death in a more robust manner than direct injection of either SNCA or BSA. Conclusion: These results suggest that the presence of eSNCA protein 'primes' microglia, making them susceptible to environmental proinflammatory challenge. For this reason, we hypothesise that where 'inflammation' contributes to the disease progression in PD, it does so in a punctuate manner (on-off) as a result of systemic events.
Overview
The claims and statistics of this paper haven’t been checked yet.
Run the check — free, no account needed. It reads the open-access text and checks the sources it cites.
Integrity signals
Registry
Cites
Statistics
Figures
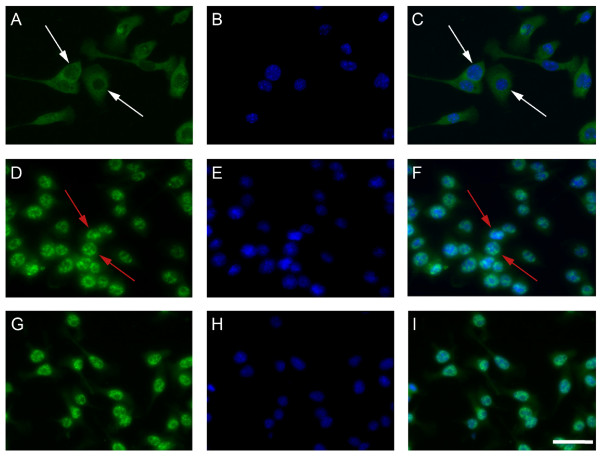
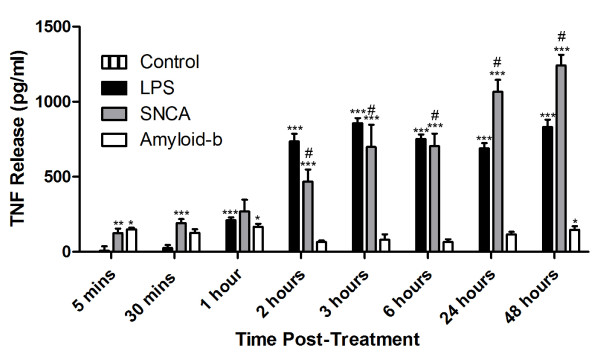
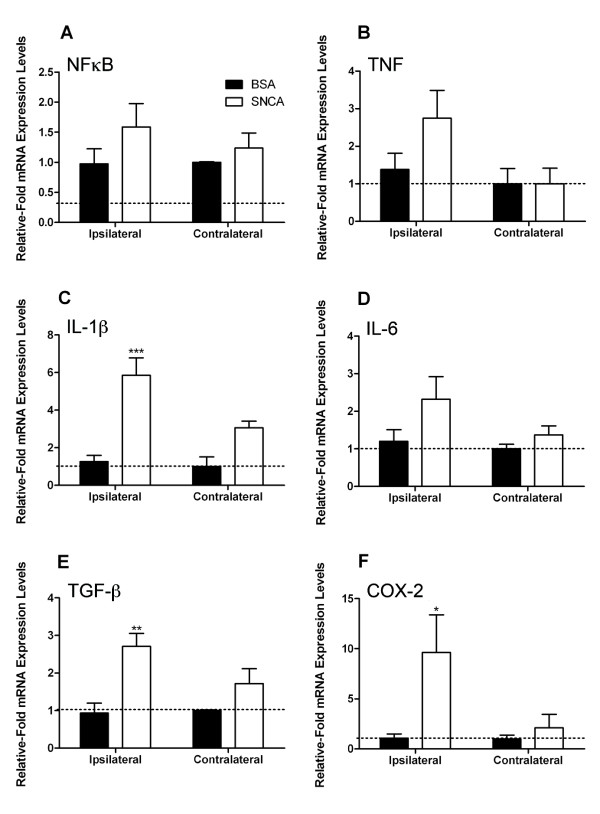
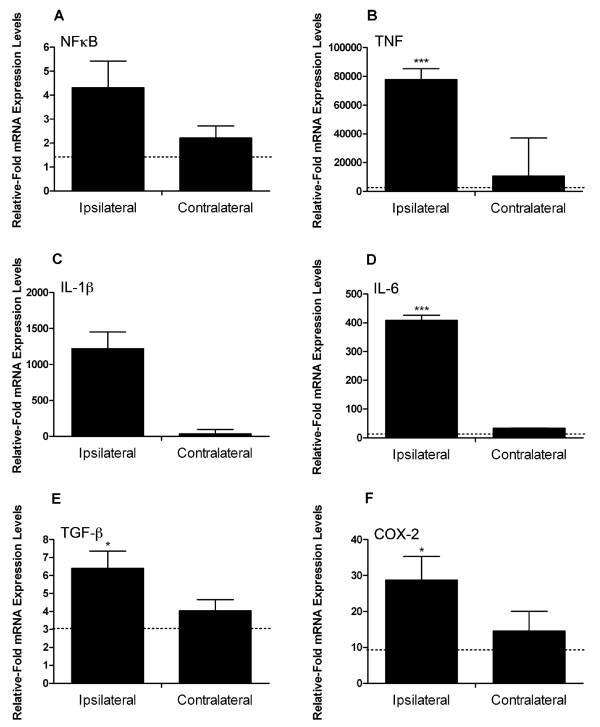
Verification
Claims the paper makes
The claims and statistics of this paper haven’t been checked yet.
Run the check — free, no account needed. It reads the open-access text and checks the sources it cites.
Claims other papers make about this one
Each is checked against this paper’s own text: does it say what the citing paper says it does?
In the citing paper
“Direct injection of LPS into the rodent brain is sufficient to induce neuronal loss [44, 46].”
From The endotoxin hypothesis of neurodegeneration (2019) · cites this paper as [46]
Self-check
Percentages, sums and reported differences re-computed from the paper’s own numbers.
The self-check needs the paper’s full text.
Citations
Cites
The mouse brain in stereotaxic coordinates
Konsman, J. (2003) · Psychoneuroendocrinology · doi:10.1016/s0306-4530(03)00088-x · Cited by 16,796
The Mouse Brain in Stereotaxic Coordinates
Paxinos, G. (2001) · Cited by 12,859
Spillantini, M. G., Crowther, R. A., Jakes, R., Hasegawa, M., & Goedert, M. (1998) · Proceedings of the National Academy of Sciences · doi:10.1073/pnas.95.11.6469 · Cited by 2,868
Systemic LPS causes chronic neuroinflammation and progressive neurodegeneration
Qin, L., Wu, X., Block, M. L., Liu, Y., Breese, G. R., Hong, J., Knapp, D. J., & Crews, F. T. (2007) · Glia · doi:10.1002/glia.20467 · Cited by 2,144
Li, J.-Y., Englund, E., Holton, J. L., Soulet, D., Hagell, P., Lees, A. J., Lashley, T., Quinn, N. P., Rehncrona, S., Björklund, A., et al. (2008) · Nature Medicine · doi:10.1038/nm1746 · Cited by 1,845
Zhang, W., Wang, T., Pei, Z., Miller, D. S., Wu, X., Block, M. L., Wilson, B., Zhang, W., Zhou, Y., Hong, J.-S., et al. (2005) · The FASEB Journal · doi:10.1096/fj.04-2751com · Cited by 1,265
Mogi, M., Harada, M., Riederer, P., Narabayashi, H., Fujita, K., & Nagatsu, T. (1994) · Neuroscience Letters · doi:10.1016/0304-3940(94)90746-3 · Cited by 986
Intravesicular Localization and Exocytosis of α-Synuclein and its Aggregates
Lee, H.-J., Patel, S. S., & Lee, S. (2005) · Journal of Neuroscience · doi:10.1523/jneurosci.0692-05.2005 · Cited by 824
Blum-Degena, D., Müller, T., Kuhn, W., Gerlach, M., Przuntek, H., & Riederer, P. (1995) · Neuroscience Letters · doi:10.1016/0304-3940(95)12192-7 · Cited by 801
Cunningham, C., Wilcockson, D. C., Campion, S., Lunnon, K., & Perry, V. H. (2005) · The Journal of Neuroscience · doi:10.1523/jneurosci.2614-05.2005 · Cited by 768
Human amyloid-β synthesis and clearance rates as measured in cerebrospinal fluid in vivo
Bateman, R. J., Munsell, L. Y., Morris, J. C., Swarm, R., Yarasheski, K. E., & Holtzman, D. M. (2006) · Nature Medicine · doi:10.1038/nm1438 · Cited by 599
Butovsky, O., Talpalar, A. E., Ben‐Yaakov, K., & Schwartz, M. (2005) · Molecular and Cellular Neuroscience · doi:10.1016/j.mcn.2005.03.005 · Cited by 372
Gao, H.-M., Zhang, F., Zhou, H., Kam, W., Wilson, B., & Hong, J.-S. (2011) · Environmental Health Perspectives · doi:10.1289/ehp.1003013 · Cited by 355 · cited 1×
“Recent work by Gao and colleagues has substantiated this finding by using a two-hit approach, systemic inflammation in a transgenic model of PD [36].”
ResultDifferent Mechanisms of Oxidative Stress and Neurotoxicity for Alzheimer‘s Aβ(1−42) and Aβ(25−35)
Varadarajan, S., Kanski, J., Aksenova, M., Lauderback, C., & Butterfield, D. A. (2001) · Journal of the American Chemical Society · doi:10.1021/ja010452r · Cited by 346
Warnke, R., & Levy, R. (1980) · Journal of Histochemistry & Cytochemistry · doi:10.1177/28.8.7003003 · Cited by 338
McColl, B. W., Rothwell, N. J., & Allan, S. M. (2007) · The Journal of Neuroscience · doi:10.1523/jneurosci.5376-06.2007 · Cited by 337
Pott Godoy, M. C., Tarelli, R., Ferrari, C. C., Sarchi, M. I., & Pitossi, F. J. (2008) · Brain · doi:10.1093/brain/awn101 · Cited by 335
THE NEUROPATHOLOGY OF MULTIPLE SCLEROSIS
Ludwin, S. K. (2000) · Neuroimaging Clinics of North America · doi:10.1016/s1052-5149(25)00665-3 · Cited by 331
CpG-free plasmids confer reduced inflammation and sustained pulmonary gene expression
Hyde, S. C., Pringle, I. A., Abdullah, S., Lawton, A. E., Davies, L. A., Varathalingam, A., Nunez-Alonso, G. A., Green, A.-M., Bazzani, R. P., Jones, S., et al. (2008) · Nature Biotechnology · doi:10.1038/nbt1399 · Cited by 308
Castaño, A., Herrera, A. J., Cano, J., & Machado, A. M. (2002) · Journal of Neurochemistry · doi:10.1046/j.1471-4159.2002.00799.x · Cited by 239
Isoquinoline neurotoxins in the brain and Parkinson's disease
Nagatsu, T. (1997) · Neuroscience Research · doi:10.1016/s0168-0102(97)00083-7 · Cited by 229
Villarán, R. F., Espinosa‐Oliva, A. M., Soto, M. S., de Pablos, R. M., Argüelles, S., Delgado‐Cortés, M. J., Sobrino, V., van Rooijen, N., Venero, J. L., Herrera, A. J., et al. (2010) · Journal of Neurochemistry · doi:10.1111/j.1471-4159.2010.06879.x · Cited by 217
Nakashima, Y., Sun, D., Trindade, M. C. D., Maloney, W. J., Goodman, S. B., Schurman, D. J., & Smith, R. L. (1999) · Journal of Bone and Joint Surgery · doi:10.2106/00004623-199905000-00002 · Cited by 209
Nitrated α-Synuclein-Induced Alterations in Microglial Immunity Are Regulated by CD4+ T Cell Subsets
Reynolds, A. D., Stone, D. K., Mosley, R. L., & Gendelman, H. E. (2009) · The Journal of Immunology · doi:10.4049/jimmunol.0803982 · Cited by 199
Induction of macrophage C-C chemokine expression by titanium alloy and bone cement particles
Nakashima, Y., Sun, D., Trindade, M. C. D., Chun, L., Song, Y., Goodman, S. B., Schurman, D. J., Maloney, W. J., & Smith, R. L. (1999) · Journal of Bone and Joint Surgery - British Volume · doi:10.1302/0301-620x.81b1.8884 · Cited by 185
Multiple sclerosis: the environment and causation
Giovannoni, G., & Ebers, G. C. (2007) · Current Opinion in Neurology · doi:10.1097/wco.0b013e32815610c2 · Cited by 169
Meda, L., Baron, P., Prat, E., Scarpini, E. A., Scarlato, G., Cassatella, M. A., & Rossi, F. (1999) · Journal of Neuroimmunology · doi:10.1016/s0165-5728(98)00188-x · Cited by 157
Campbell, S. J., Perry, V. H., Pitossi, F. J., Butchart, A. G., Chertoff, M., Waters, S., Dempster, R., & Anthony, D. C. (2005) · American Journal Of Pathology · doi:10.1016/s0002-9440(10)62365-6 · Cited by 154
Self-citationMultiple Sclerosis and Other Demyelinating Diseases
Bendszus, M., & Storch-Hagenlocher, B. (2013) · Medical radiology · doi:10.1007/174_2012_787 · Cited by 149
Klegeris, A., Giasson, B. I., Zhang, H., Maguire, J. A., Pelech, S., & McGeer, P. L. (2006) · The FASEB Journal · doi:10.1096/fj.06-6183com · Cited by 145
Mutant α-Synuclein Overexpression Mediates Early Proinflammatory Activity
Su, X., Federoff, H. J., & Maguire-Zeiss, K. A. (2009) · Neurotoxicity Research · doi:10.1007/s12640-009-9053-x · Cited by 145
Pesticide Exposure Exacerbates α-Synucleinopathy in an A53T Transgenic Mouse Model
Norris, E. H., Uryu, K., Leight, S., Giasson, B. I., Trojanowski, J. Q., & Lee, V. M. ‐. (2007) · American Journal Of Pathology · doi:10.2353/ajpath.2007.060359 · Cited by 134
Nitrated Alpha-Synuclein and Microglial Neuroregulatory Activities
Reynolds, A. D., Kadiu, I., Garg, S. K., Glanzer, J. G., Nordgren, T. M., Ciborowski, P. S., Banerjee, R. V., & Gendelman, H. E. (2008) · Journal of Neuroimmune Pharmacology · doi:10.1007/s11481-008-9100-z · Cited by 129
Systemic Inflammatory Response Reactivates Immune-Mediated Lesions in Rat Brain
Serres, S., Anthony, D. C., Jiang, Y., Broom, K. A., Campbell, S. J., Tyler, D. J., van Kasteren, S. I., Davis, B. G., & Sibson, N. R. (2009) · Journal of Neuroscience · doi:10.1523/jneurosci.0406-09.2009 · Cited by 112
Self-citationActivation of nuclear factor-κB by β-amyloid peptides and interferon-γ in murine microglia
Bonaiuto, C., McDonald, P. P., Rossi, F., & Cassatella, M. A. (1997) · Journal of Neuroimmunology · doi:10.1016/s0165-5728(97)00054-4 · Cited by 112
Increased sensitivity to MPTP in human α-synuclein A30P transgenic mice
Nieto, M., Gil-Bea, F. J., Dalfó, E., Cuadrado‐Tejedor, M., Cabodevilla, F., Sánchez, B., Catena, S., Sesma, T., Ribé, E. M., Ferrer, I., et al. (2005) · Neurobiology of Aging · doi:10.1016/j.neurobiolaging.2005.04.010 · Cited by 100
Cunningham, C. M., Boche, D., & Perry, V. H. (2002) · Neuropathology and Applied Neurobiology · doi:10.1046/j.1365-2990.2002.00383.x · Cited by 80
Absence of Detectable IL-1β Production in Murine Prion Disease: A Model of Chronic Neurodegeneration
Walsh, D. T., Betmouni, S., & Perry, V. H. (2001) · Journal of Neuropathology & Experimental Neurology · doi:10.1093/jnen/60.2.173 · Cited by 71
Blond, D., Campbell, S. J., Butchart, A. G., Perry, V. H., & Anthony, D. C. (2002) · Brain Research · doi:10.1016/s0006-8993(02)03473-x · Cited by 64
Self-citationHelicobacter Hypothesis for Idiopathic Parkinsonism: Before and Beyond
Dobbs, R. J., Dobbs, S. M., Weller, C., Charlett, A., Bjarnason, I., Curry, A., Ellis, D. S., Ibrahim, M. A. A., McCrossan, M. V., O’Donohue, J., et al. (2008) · Helicobacter · doi:10.1111/j.1523-5378.2008.00622.x · Cited by 62
Tomoda, T., Shirasawa, T., Yahagi, Y., Ishii, K., Takagi, H., Furiya, Y., Arai, K., Mori, H., & Muramatsu, M. (1996) · Developmental Biology · doi:10.1006/dbio.1996.0242 · Cited by 56
Activation of Human Macrophages by Amyloid-β Is Attenuated by Astrocytes
Smits, H. A., van Beelen, A. J., Vos, N., Rijsmus, A., van der Bruggen, T., Verhoef, J., Muiswinkel, F. L. V., & Nottet, H. S. L. M. (2001) · The Journal of Immunology · doi:10.4049/jimmunol.166.11.6869 · Cited by 46
Loss of the atypical inflammatory response in juvenile and aged rats
Campbell, S. J., Carare‐Nnadi, R., Losey, P., & Anthony, D. C. (2006) · Neuropathology and Applied Neurobiology · doi:10.1111/j.1365-2990.2006.00773.x · Cited by 41
Self-citationLewin, S. R., Lambert, P. F., Deacon, N. J., MILLS, J. S., & Crowe, S. M. (1997) · Journal of Virology · doi:10.1128/jvi.71.3.2114-2119.1997 · Cited by 37
Ariza, D., Lima, M. M. S., Moreira, C. G., Dombrowski, P. A., Ávila, T. V., Allemand, A., Mendes, D. A. G. B., Cunha, C. D., & Vital, M. A. B. F. (2010) · Neurochemical Research · doi:10.1007/s11064-010-0222-3 · Cited by 29
Pohlers, D., Siegling, A., Buchner, E., Schmidt‐Weber, C. B., Palombo‐Kinne, E., Emmrich, F., Bräuer, R., & Kinne, R. W. (2005) · Arthritis Research & Therapy · doi:10.1186/ar1689 · Cited by 23
Zujovic (2000) · doi:10.1002/(sici)1098-1136(20000215)29:4
Cited by
Sorted by citations
Microglia and neurodegeneration: The role of systemic inflammation
Cunningham, C. (2013) · Glia · doi:10.1002/glia.22350 · Cited by 769
The gut-brain axis: is intestinal inflammation a silent driver of Parkinson’s disease pathogenesis?
Houser, M. C., & Tansey, M. G. (2017) · npj Parkinson's Disease · doi:10.1038/s41531-016-0002-0 · Cited by 588
Lipopolysaccharide-induced neuroinflammation as a bridge to understand neurodegeneration
Batista, C. R. A., Gomes, G. F., Candelario-Jalil, E., Fiebich, B. L., & de Oliveira, A. C. P. (2019) · International Journal of Molecular Sciences · doi:10.3390/ijms20092293 · Cited by 529
The endotoxin hypothesis of neurodegeneration
Brown, G. C. (2019) · Journal of Neuroinflammation · doi:10.1186/s12974-019-1564-7 · Cited by 457
Linking Neuroinflammation and Neurodegeneration in Parkinson's Disease
Gelders, G., Baekelandt, V., & Van der Perren, A. (2018) · Journal of Immunology Research · doi:10.1155/2018/4784268 · Cited by 430
Metadata
- Authors
- Couch, Y., Alvarez-Erviti, L., Sibson, N. R., Wood, M. J., & Anthony, D. C.
- Affiliations
- University of Oxford (GB)
- Churchill Hospital (GB)
- Corresponding author
- Couch, Yvonne
- Sibson, Nicola R
- Wood, Matthew JA
- Anthony, Daniel C
- Venue
- Journal of Neuroinflammation
- Published
- 2011-11-28
- Volume
- 8
- Issue
- 1
- Pages
- 166-166
- ISSN
- 1742-2094 (ISSN-L)
- PMC
- PMC3239418
- OpenAlex
- W2064344027
- Semantic Scholar
- 8d36da2a381f6e870ef72f2ae121c4a93eb5d6ac
- Cited by
- 155
- References
- 48
- Citations by year
- 2026: 3 · 2025: 7 · 2024: 4 · 2023: 8 · 2022: 15 · 2021: 18 · 2020: 13 · 2019: 10 · 2018: 10 · 2017: 15 · 2016: 12 · 2015: 8 · 2014: 15 · 2013: 10 · 2012: 7
- FWCI
- 5.40
- Type
- journal article
- Language
- en
- Open access
- gold
- doi.org
- Licence
- cc-by
- Locations
- Journal of Neuroinflammation (publishedVersion, cc-by)
- Europe PMC (PubMed Central) (publishedVersion, cc-by)
- PubMed Central (publishedVersion, cc-by)
- PubMed (publishedVersion)
- DOAJ (DOAJ: Directory of Open Access Journals) (submittedVersion)
- UCL Discovery (University College London) (submittedVersion)
- Funders
- Biotechnology and Biological Sciences Research Council
- Topics
- Life Sciences › Neuroscience › Neurology › Neuroinflammation and Neurodegeneration Mechanisms
- Health Sciences › Medicine › Clinical Neurology › Parkinson's Disease Mechanisms and Treatments
- Life Sciences › Biochemistry, Genetics and Molecular Biology › Molecular Biology › Nuclear Receptors and Signaling
- Keywords
- extracellular alpha-synuclein, Parkinson's disease, microglial activation, neuroinflammation, lipopolysaccharide, substantia nigra, inflammatory cytokines, IL-1β, NF-κB, peripheral inflammation, microglial priming, neuronal cell death, endothelial activation, BV-2 cells, neurodegeneration
- MeSH terms
- Animals, Cell Line, Female, Inflammation, Lipopolysaccharides, Parkinson Disease, Serum Albumin, Substantia Nigra, Tumor Necrosis Factor-alpha, Cytokines, Amyloid beta-Peptides, Cell Death, Microglia, Mice, alpha-Synuclein, Transcription Factor RelA, Interleukin-1beta
About these checks
Registry, retraction, Cites and statistics results are computed, not judged, with one exception: a printed reference that no index lists is read once by a model before it counts as a citation error. Claims are extracted by a model and kept only when their quote appears verbatim in the text; each cited source is then checked, with a model’s help, for whether it says what the claim relies on. Those verdicts can be wrong — read the claim’s quote and the cited source before relying on one.
Statistics and arithmetic are recomputed, not judged.
Confidence bands are shown only for fields calibrated on our annotated test set. None is calibrated yet, so no band is shown.
What counts as a claim ›How we measure confidence ›How we check this ›
Are you an author, or do you see a problem with this page? Request a review
