

The DOI matches its Crossref record; 57 of the 57 references it cites were found in a registry or an index.
Loss of the receptor tyrosine kinase Axl leads to enhanced inflammation in the CNS and delayed removal of myelin debris during Experimental Autoimmune Encephalomyelitis
Open accessAbstract
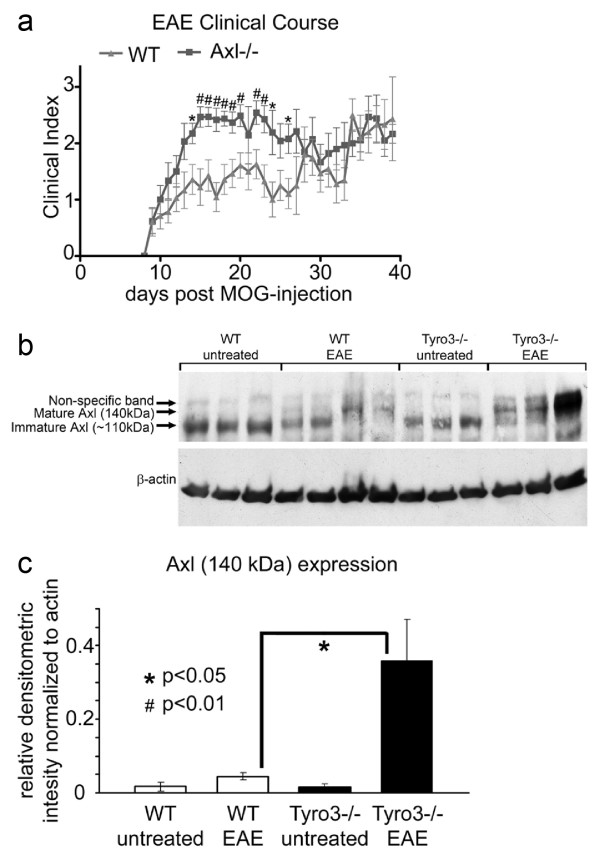
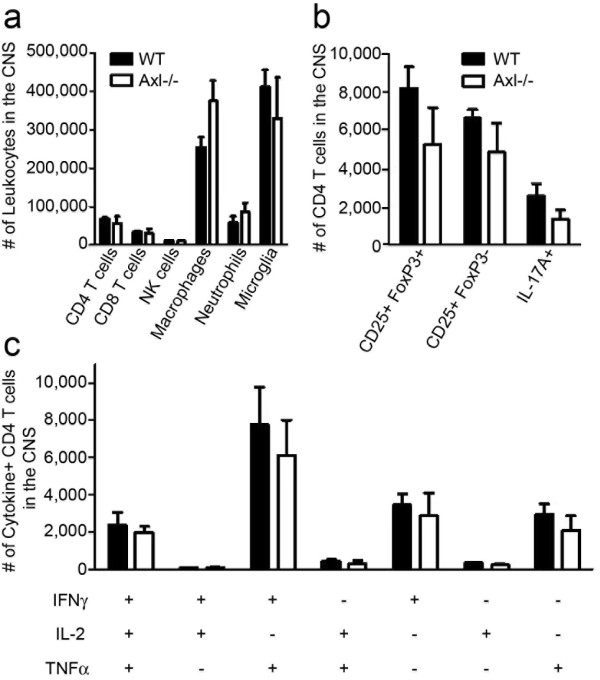
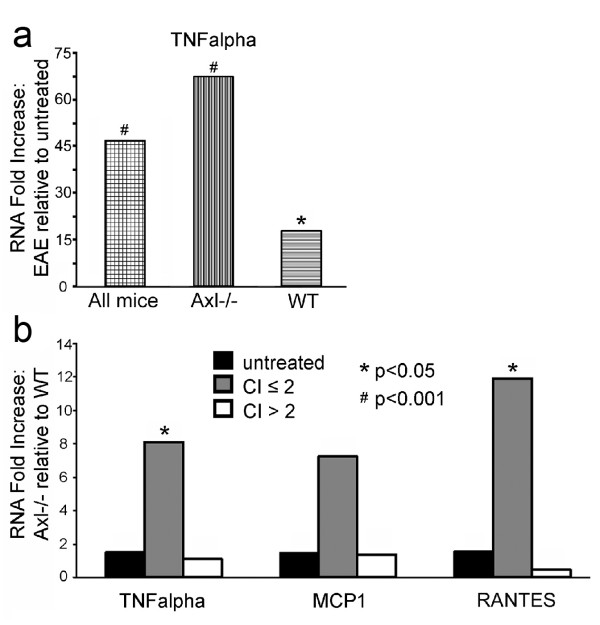
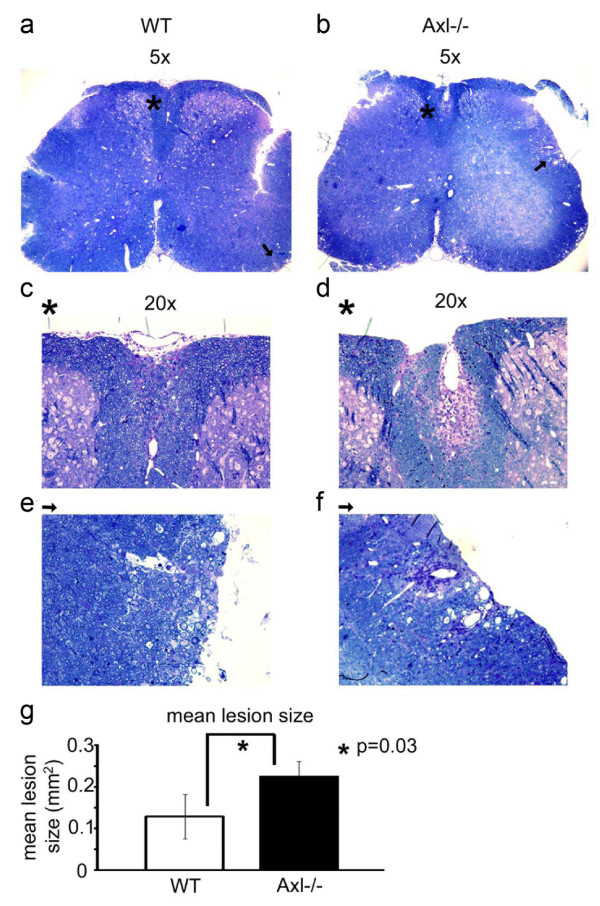
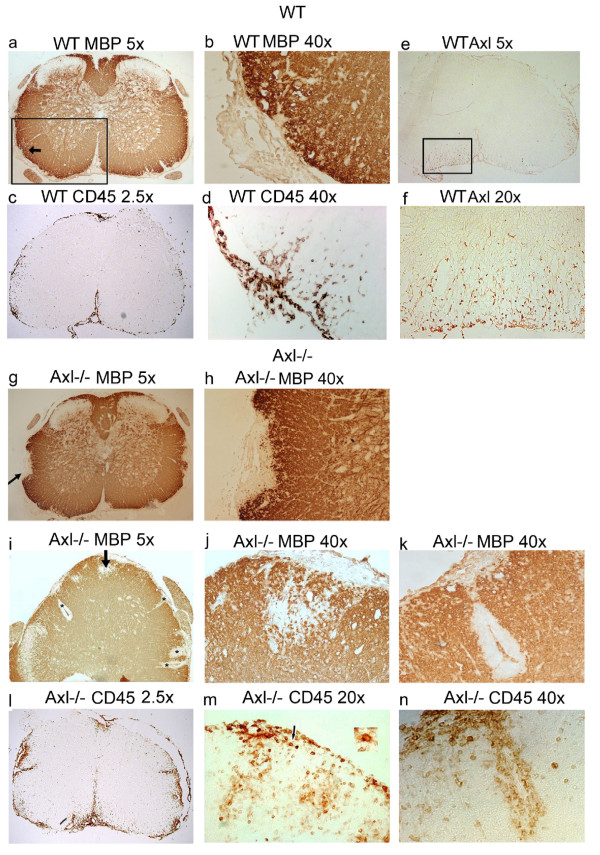
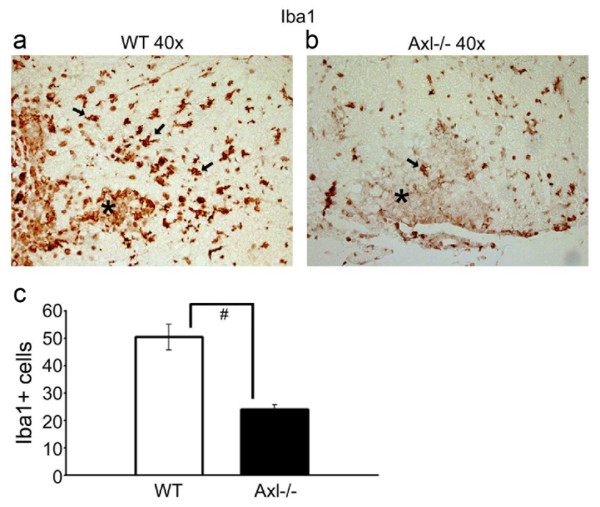
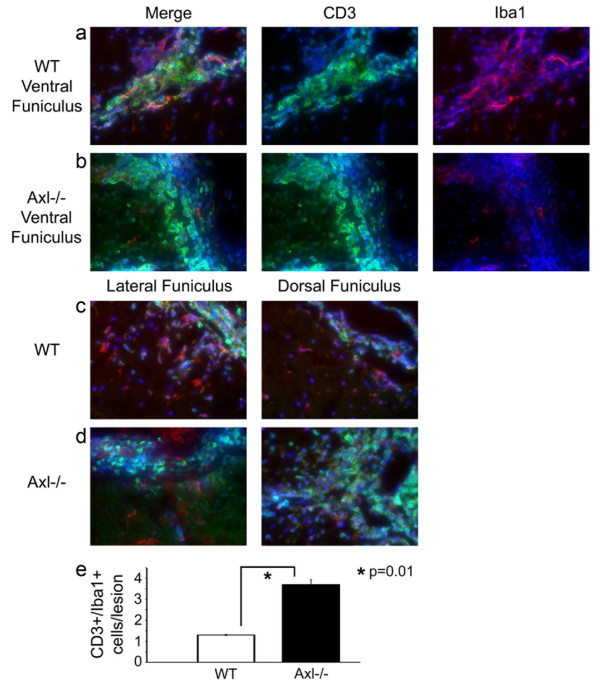
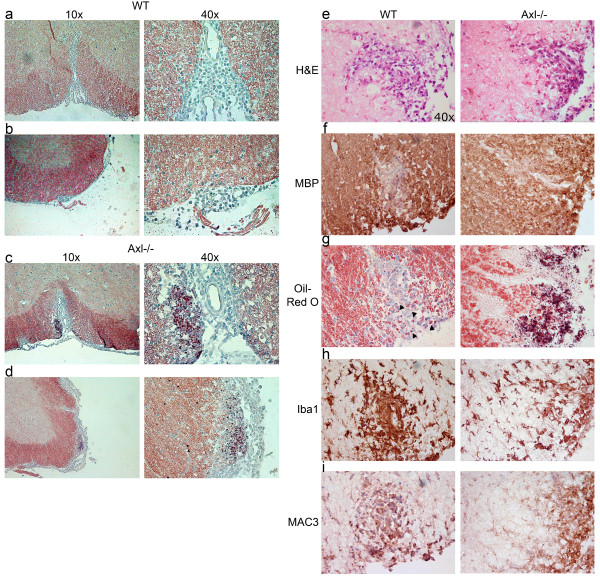
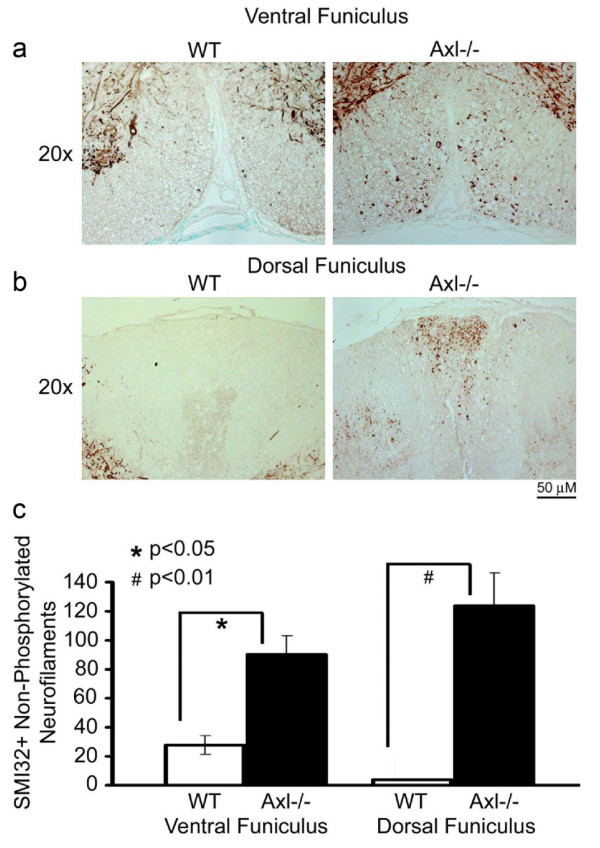
BACKGROUND: Axl, together with Tyro3 and Mer, constitute the TAM family of receptor tyrosine kinases. In the nervous system, Axl and its ligand Growth-arrest-specific protein 6 (Gas6) are expressed on multiple cell types. Axl functions in dampening the immune response, regulating cytokine secretion, clearing apoptotic cells and debris, and maintaining cell survival. Axl is upregulated in various disease states, such as in the cuprizone toxicity-induced model of demyelination and in multiple sclerosis (MS) lesions, suggesting that it plays a role in disease pathogenesis. To test for this, we studied the susceptibility of Axl-/- mice to experimental autoimmune encephalomyelitis (EAE), an animal model for multiple sclerosis. METHODS: WT and Axl-/- mice were immunized with myelin oligodendrocyte glycoprotein (MOG)35-55 peptide emulsified in complete Freund's adjuvant and injected with pertussis toxin on day 0 and day 2. Mice were monitored daily for clinical signs of disease and analyzed for pathology during the acute phase of disease. Immunological responses were monitored by flow cytometry, cytokine analysis and proliferation assays. RESULTS: Axl-/- mice had a significantly more severe acute phase of EAE than WT mice. Axl-/- mice had more spinal cord lesions with larger inflammatory cuffs, more demyelination, and more axonal damage than WT mice during EAE. Strikingly, lesions in Axl-/- mice had more intense Oil-Red-O staining indicative of inefficient clearance of myelin debris. Fewer activated microglia/macrophages (Iba1+) were found in and/or surrounding lesions in Axl-/- mice relative to WT mice. In contrast, no significant differences were noted in immune cell responses between naïve and sensitized animals. CONCLUSIONS: These data show that Axl alleviates EAE disease progression and suggests that in EAE Axl functions in the recruitment of microglia/macrophages and in the clearance of debris following demyelination. In addition, these data provide further support that administration of the Axl ligand Gas6 could be therapeutic for immune-mediated demyelinating diseases.
Overview
The claims and statistics of this paper haven’t been checked yet.
Run the check — free, no account needed. It reads the open-access text and checks the sources it cites.
Integrity signals
Registry
Cites
Statistics
Figures
Verification
Claims the paper makes
The claims and statistics of this paper haven’t been checked yet.
Run the check — free, no account needed. It reads the open-access text and checks the sources it cites.
Claims other papers make about this one
Each is checked against this paper’s own text: does it say what the citing paper says it does?
The source backs part of the claim, not all of it — or backs it for a different population, condition or comparison.
In the citing paper
“Furthermore, microglia at both 14 and 21 dpi up-regulated genes critical for the uptake and degradation of cellular and myelin debris, such as Apoe, Clec7a, and Axl (41–43).”
From Microglia depletion exacerbates demyelination and impairs remyelination in a neurotropic coronavirus infection (2020) · cites this paper as [43]
Experimental — accuracy not yet measuredThe cited source says what the claim attributes to it.
In the citing paper
“In particular, the clearance of myelin debris by microglia is believed to be critically required to limit neuronal damage in EAE (Cignarella et al., 2020; Takahashi et al., 2007; Weinger et al., 2011).”
From SYK coordinates neuroprotective microglial responses in neurodegenerative disease (2022) · cites this paper as Weinger et al., 2011
Self-check
Percentages, sums and reported differences re-computed from the paper’s own numbers.
The self-check needs the paper’s full text.
Citations
Cites
Cleavage of Structural Proteins during the Assembly of the Head of Bacteriophage T4
LAEMMLI, U. K. (1970) · Nature · doi:10.1038/227680a0 · Cited by 249,961
Towbin, H., Staehelin, T., & Gordon, J. (1979) · Proceedings of the National Academy of Sciences · doi:10.1073/pnas.76.9.4350 · Cited by 53,218
Microglia: Active sensor and versatile effector cells in the normal and pathologic brain
Hanisch, U.-K., & Kettenmann, H. (2007) · Nature Neuroscience · doi:10.1038/nn1997 · Cited by 3,676
Bethke, T. D. (2012) · Der Pneumologe · doi:10.1007/s10405-012-0601-3 · Cited by 3,286
Phagocytosis and clearance of apoptotic cells is mediated by MER
Scott, R. S., McMahon, E. J., Pop, S. M., Reap, E. A., Caricchio, R., Cohen, P. L., Earp, H. S., & Matsushima, G. K. (2001) · Nature · doi:10.1038/35075603 · Cited by 1,215
Microglia: Intrinsic immuneffector cell of the brain
Gehrmann, J., Matsumoto, Y., & Kreutzberg, G. W. (1995) · Brain Research Reviews · doi:10.1016/0165-0173(94)00015-h · Cited by 1,111
Debris clearance by microglia: an essential link between degeneration and regeneration
Neumann, H., Kotter, M. R., & Franklin, R. J. M. (2008) · Brain · doi:10.1093/brain/awn109 · Cited by 1,111
Injection of adult neurospheres induces recovery in a chronic model of multiple sclerosis
Pluchino, S., Quattrini, A., Brambilla, E., Gritti, A., Salani, G., Dina, G., Galli, R., Carro, U. D., Amadio, S., Bergami, A., et al. (2003) · Nature · doi:10.1038/nature01552 · Cited by 1,071
Immunobiology of the TAM receptors
Lemke, G., & Rothlin, C. V. (2008) · Nature reviews. Immunology · doi:10.1038/nri2303 · Cited by 893
Kuhlmann, T., Lingfeld, G., Bitsch, A., Schuchardt, J., & Brück, W. (2002) · Brain : a journal of neurology · doi:10.1093/brain/awf235 · Cited by 851
Cited by
Sorted by citations
Items 101–134 of 134
Chen, Y., Chen, J., Lin, Z., Zhang, X., Wu, X., Wang, X., Zhang, Z., Yang, Y., & Deng, C. (2023) · Heliyon · doi:10.1016/j.heliyon.2023.e22787 · Cited by 6
Tyro3 and Gas6 are associated with white matter and myelin integrity in multiple sclerosis
Rosenstein, I., Novakova, L., Kvartsberg, H., Nordin, A., Rasch, S., Rembeza, E., Sandgren, S., Malmeström, C., Fruhwürth, S., Axelsson, M., et al. (2024) · Journal of Neuroinflammation · doi:10.1186/s12974-024-03315-0 · Cited by 5
Locus coeruleus integrity correlates with plasma soluble Axl levels in Alzheimer's disease patients
Galgani, A., Mary, A., Lombardo, F. P., Martini, N., Scotto, M., Tognoni, G., Siciliano, G., Ceravolo, R., Giorgi, F. S., & Heneka, M. T. (2025) · Alzheimer s & Dementia · doi:10.1002/alz.70434 · Cited by 4
Coexpression enables multi-study cellular trajectories of development and diseasePreprint
Hie, B., Cho, H., Bryson, B. D., & Berger, B. (2019) · bioRxiv (Cold Spring Harbor Laboratory) · doi:10.1101/719088 · Cited by 5
Qin, X., Zhang, Y., Liu, J., Xiao, G., Guo, Y., Deng, H., Hao, H., Xu, W., Cheng, X., Zhao, L., et al. (2025) · Journal of Ethnopharmacology · doi:10.1016/j.jep.2025.120520 · Cited by 4
From pathogenesis to therapeutic targeting: new insight into TAM receptors in rheumatoid arthritis
Dai, M., Xuezhi, Y., Yao, F., Ding, J., Fang, Y., Hu, W., Wang, K., Li, S., Zhou, R., Hu, W., et al. (2025) · Cell & Bioscience · doi:10.1186/s13578-025-01503-w · Cited by 4
Silva, E. A. C., Correale, J. D., Rothlin, C. V., & Wilczyñski, J. M. O. (2024) · Journal of Pharmacology and Experimental Therapeutics · doi:10.1124/jpet.124.002254 · Cited by 4
The therapeutic effect of GAS6 in remyelination is dependent upon Tyro3
Asadian, N., Aprico, A., Chen, M. Z., Yuen, D., Johnston, A. P. R., Kilpatrick, T. J., & Binder, M. D. (2024) · Glia · doi:10.1002/glia.24534 · Cited by 4
Therapeutic potential of TAM receptors in autoimmune diseases: insights from original studies
Adedayo, S. I., Gegele, T. A., Adeshina, K. A., Olukade, B. A., Abubakar, R. A., Abdulsalam, A., Oladejo, T. O., Ahmed, M. M., & Ibrahim, K. G. (2026) · Oxford Open Immunology · doi:10.1093/oxfimm/iqag001 · Cited by 3
Insights into receptor tyrosine kinases signaling in neurodegenerative disorders
Randhawa, P. K., Jaggi, A. S., & Bali, A. (2023) · Elsevier eBooks · doi:10.1016/b978-0-443-18677-6.00001-4 · Cited by 3
Systems for Mechanical Sample Lysis and Homogenization for Molecular Biology Applications
Atwood, J. (2016) · Springer protocols handbooks/Springer protocols · doi:10.1007/978-1-4939-3185-9_6 · Cited by 3
Tyro3 deletion is protective in experimental autoimmune encephalomyelitis
Binder, M. D., Asadian, M., Leepel, D., Gerry, Z. M., Aprico, A., Barreto‐Arce, L., Kilpatrick, T. J., & Stone, S. (2025) · Immunology and Cell Biology · doi:10.1111/imcb.70054 · Cited by 2
Moran, S. J., & Starbird, C. A. (2026) · Biochemical Society Transactions · doi:10.1042/bst20250119 · Cited by 2
Munie, A. N., Atkinson, J., Wilkinson, N. M., Jerome, A. D., Bellinger, C. E., Sas, A., & Segal, B. M. (2023) · Journal of Neuroimmunology · doi:10.1016/j.jneuroim.2023.578016 · Cited by 2
Role of Receptor Tyrosine Kinase AXL in Cancer
Kumar, R., Tanwar, P., Bhatia, D. D., & Solanki, R. (2025) · Cancer drug discovery and develogment/Cancer drug discovery and development · doi:10.1007/978-3-031-93894-8_4 · Cited by 1
Gaudet, A. D., & Fonken, L. K. (2026) · Trends in Neurosciences · doi:10.1016/j.tins.2026.01.002 · Cited by 3
Spatafora, M. G., Dubin, J., Domi, T., Lombardi, R., Paolo, C., Bella, E. D., Consonni, M., Quattrini, A., Verri, M., Lauria, G., et al. (2026) · Brain Communications · doi:10.1093/braincomms/fcag086 · Cited by 1
The emerging role of circular RNAs in neurodegenerative diseases and viral infections
Medina, F., & Bellizzi, A. (2026) · Journal of NeuroVirology · doi:10.1007/s13365-026-01324-8 · Cited by 1
Neuropathic pain decoded by microglial heterogeneity
Tsuda, M., & Kohno, K. (2023) · Folia Pharmacologica Japonica · doi:10.1254/fpj.22157 · Cited by 1
The concentration of myelin debris-like particles in the normal rat optic nervePreprint
Kawano, J. (2025) · bioRxiv (Cold Spring Harbor Laboratory) · doi:10.1101/2025.03.19.643597 · Cited by 1
Kawano, J. (2025) · bioRxiv (Cold Spring Harbor Laboratory) · doi:10.1101/2025.03.19.643607 · Cited by 1
Axl RTK and microRNAs in urogenital cancers
Fritz, H. (2015) · Lund University Publications (Lund University)
Gas6/TAM System: A Promising Target in Neuroimmunology
Bellan, M. (2016)
Novel role for Gas6 as a positive regulator of myelination
Goudarzi, S. (2016)
Blauth, K. (2012) · Carolina Digital Repository (University of North Carolina at Chapel Hill) · doi:10.17615/w725-ye08
The Role of MERTK in Central Inflammatory Demyelination
Dwyer, C. (2020) · Minerva Access (University of Melbourne)
Genetics of Multiple Sclerosis
Leppä, V. (2013) · Työväentutkimus Vuosikirja
Myelin pruning by microglia during development
Weikert, U. (2019) · eDiss (Georg-August-Universität Göttingen) · doi:10.53846/goediss-7415
Mikołajczyk, A., Popiel, D., Jastrzębska, K., Wiernicki, B., Mituła, F., Janusz, A., Dominowski, J., Górka, M., Kornatowski, T., Hucz‐Kalitowska, J., et al. (2026) · Frontiers in Pharmacology · doi:10.3389/fphar.2026.1768167
Signalisation et ciblage thérapeutique du récepteur tyrosine kinase AXL dans les cancers
Leconet, W. (2014) · theses.fr (ABES) · doi:10.70675/e91475a6z3b26z42ecza153zdc13a97fb5ec
Axl Kinase in Alzheimer's Disease
Karati, D., & Meur, S. (2026) · BENTHAM SCIENCE PUBLISHERS eBooks · doi:10.2174/9798898815646126010006
Lipid signaling and foam cell formation in atherosclerosis and spinal cord injury
Tan, G., Wang, X., Chen, J., Feng, R., Chu, H., Yang, D., Li, J., Yang, M., Li, J., Huang, Y., et al. (2026) · Journal of Lipid Research · doi:10.1016/j.jlr.2026.101153
Metadata
- Authors
- Weinger, J. G., Brosnan, C. F., Loudig, O., Goldberg, M. F., Macian, F., Arnett, H. A., Prieto, A. L., Tsiperson, V., & Shafit-Zagardo, B.
- Affiliations
- Albert Einstein College of Medicine (US)
- Amgen (United States) (US)
- Indiana University Bloomington (US)
- Venue
- Journal of Neuroinflammation
- Published
- 2011-05-15
- Volume
- 8
- Issue
- 1
- Pages
- 49-49
- ISSN
- 1742-2094 (ISSN-L)
- PMC
- PMC3121615
- OpenAlex
- W2081982964
- Cited by
- 134
- References
- 57
- Citations by year
- 2026: 9 · 2025: 14 · 2024: 10 · 2023: 9 · 2022: 9 · 2021: 10 · 2020: 15 · 2019: 10 · 2018: 13 · 2017: 5 · 2016: 10 · 2015: 6 · 2014: 9 · 2013: 3 · 2012: 2
- FWCI
- 3.14
- Type
- journal article
- Language
- en
- Open access
- gold
- doi.org
- Licence
- cc-by
- Locations
- Journal of Neuroinflammation (publishedVersion, cc-by)
- PubMed Central (publishedVersion, cc-by)
- PubMed (publishedVersion)
- DOAJ (DOAJ: Directory of Open Access Journals) (submittedVersion)
- eScholarship (California Digital Library) (submittedVersion)
- Funders
- National Multiple Sclerosis Society
- Multiple Sclerosis Society
- National Institutes of Health
- National Institute of General Medical Sciences (GM 07491, T32GM007491)
- National Institute of Allergy and Infectious Diseases (R01AI059738)
- National Institute of Neurological Disorders and Stroke (R21NS061128)
- Topics
- Health Sciences › Medicine › Clinical Neurology › Multiple Sclerosis Research Studies
- Life Sciences › Immunology and Microbiology › Immunology › Phagocytosis and Immune Regulation
- Life Sciences › Neuroscience › Neurology › Neuroinflammation and Neurodegeneration Mechanisms
- Keywords
- AXL receptor tyrosine kinase, TAM receptors, Gas6, experimental autoimmune encephalomyelitis, multiple sclerosis, demyelination, myelin debris clearance, neuroinflammation, myelin oligodendrocyte glycoprotein, axonal injury
- MeSH terms
- Axl Receptor Tyrosine Kinase, Animals, Central Nervous System, Encephalomyelitis, Autoimmune, Experimental, Glycoproteins, Inflammation, Macrophages, Myelin Sheath, Peptide Fragments, Proto-Oncogene Proteins, Cytokines, Microglia, Mice, Knockout, Receptor Protein-Tyrosine Kinases, Mice, Myelin-Oligodendrocyte Glycoprotein
About these checks
Registry, retraction, Cites and statistics results are computed, not judged, with one exception: a printed reference that no index lists is read once by a model before it counts as a citation error. Claims are extracted by a model and kept only when their quote appears verbatim in the text; each cited source is then checked, with a model’s help, for whether it says what the claim relies on. Those verdicts can be wrong — read the claim’s quote and the cited source before relying on one.
Statistics and arithmetic are recomputed, not judged.
Confidence bands are shown only for fields calibrated on our annotated test set. None is calibrated yet, so no band is shown.
What counts as a claim ›How we measure confidence ›How we check this ›
Are you an author, or do you see a problem with this page? Request a review
