Cited by 152Pain Mechanisms and TreatmentsNeuropeptides and Animal PhysiologyNeuroscience and Neuropharmacology Research

The DOI matches its Crossref record; 35 of the 35 references it cites were found in a registry or an index.

Oxytocin-Induced Antinociception in the Spinal Cord is Mediated by a Subpopulation of Glutamatergic Neurons in Lamina I-II Which Amplify GABAergic Inhibition

Open access
Breton, Jean-Didier, Veinante, Pierre, Uhl-Bronner, Sandra, Vergnano, Angela Maria, Freund-Mercier, Marie José, Schlichter, Rémy, Poisbeau, Pierrick·2008·Molecular Pain

Abstract

Background: Recent evidence suggests that oxytocin (OT), secreted in the superficial spinal cord dorsal horn by descending axons of paraventricular hypothalamic nucleus (PVN) neurons, produces antinociception and analgesia. The spinal mechanism of OT is, however, still unclear and requires further investigation. We have used patch clamp recording of lamina II neurons in spinal cord slices and immunocytochemistry in order to identify PVN-activated neurons in the superficial layers of the spinal cord and attempted to determine how this neuronal population may lead to OT-mediated antinociception. Results: We show that OT released during PVN stimulation specifically activates a subpopulation of lamina II glutamatergic interneurons which are localized in the most superficial layers of the dorsal horn of the spinal cord (lamina I-II). This OT-specific stimulation of glutamatergic neurons allows the recruitment of all GABAergic interneurons in lamina II which produces a generalized elevation of local inhibition, a phenomenon which might explain the reduction of incoming Aδ and C primary afferent-mediated sensory messages. Conclusion: Our results obtained in lamina II of the spinal cord provide the first clear evidence of a specific local neuronal network that is activated by OT release to induce antinociception. This OT-specific pathway might represent a novel and interesting therapeutic target for the management of neuropathic and inflammatory pain.

Overview

The claims and statistics of this paper haven’t been checked yet.

Run the check — free, no account needed. It reads the open-access text and checks the sources it cites.

A few free checks a day · papers already verified open instantly · results are public

Integrity signals

Registry

Crossref · 10.1186/1744-8069-4-19

Cites

35 of 35 references verified0 citation errors · 0 not checkable

Statistics

Figures

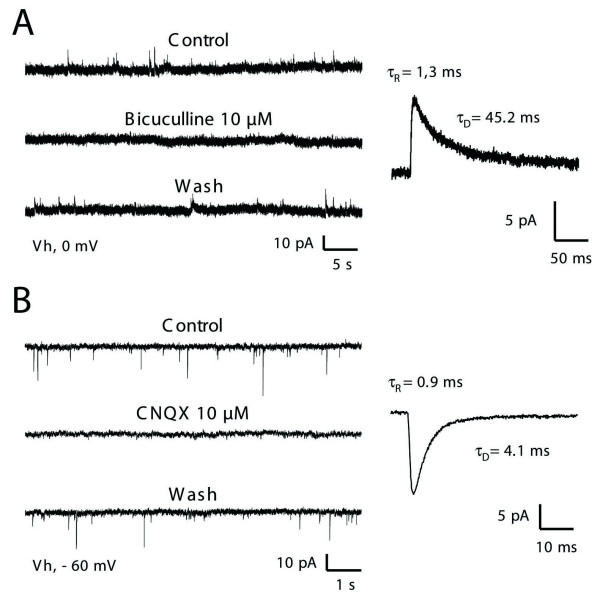
Figure 1 characterization of fast spontaneous inhibitory and excitatory synaptic currents in lamina II. Glycine-receptor-mediated sIPSCs were blocked in these experiments by adding 1 μM strychnine in the general bath perfusion. A: GABAA-receptor-mediated sIPSCs (GABAA-R sIPSCs) were identified as outward currents (left panel) at a holding potential of 0 mV. These sIPSCs were reversibly blocked in the presence of 10 μM bicuculline, a selective antagonist of GABAA-Rs. Panel on the right illustrates an averaged current obtained from 46 individual traces. GABAA-R sIPSCs were best described by a monoexponential decay time constant in both the activation phase (τR = 1.3 ms) and deactivation phase (τD = 45.2 ms). B: At a holding potential of -60 mV (i.e. at the equilibrium potential for Cl- ions), only fast inward currents were detected (left panel). These events were AMPA-type glutamate-receptor-mediated sEPSCs (AMPA-R sEPSCs) since they were reversibly inhibited in the presence of CNQX (10 μM) a specific blocker of AMPA subtype glutamate receptor. The trace on the right was obtained by averaging 168 individual AMPA-R sEPSCs. These sEPSCs were characterized by a τR of 0.9 ms and τD of 4.1 ms).
Figure 1 characterization of fast spontaneous inhibitory and excitatory synaptic currents in lamina II. Glycine-receptor-mediated sIPSCs were blocked in these experiments by adding 1 μM strychnine in the general bath perfusion. A: GABAA-receptor-mediated sIPSCs (GABAA-R sIPSCs) were identified as outward currents (left panel) at a holding potential of 0 mV. These sIPSCs were reversibly blocked in the presence of 10 μM bicuculline, a selective antagonist of GABAA-Rs. Panel on the right illustrates an averaged current obtained from 46 individual traces. GABAA-R sIPSCs were best described by a monoexponential decay time constant in both the activation phase (τR = 1.3 ms) and deactivation phase (τD = 45.2 ms). B: At a holding potential of -60 mV (i.e. at the equilibrium potential for Cl- ions), only fast inward currents were detected (left panel). These events were AMPA-type glutamate-receptor-mediated sEPSCs (AMPA-R sEPSCs) since they were reversibly inhibited in the presence of CNQX (10 μM) a specific blocker of AMPA subtype glutamate receptor. The trace on the right was obtained by averaging 168 individual AMPA-R sEPSCs. These sEPSCs were characterized by a τR of 0.9 ms and τD of 4.1 ms).CC BY · PubMed Central
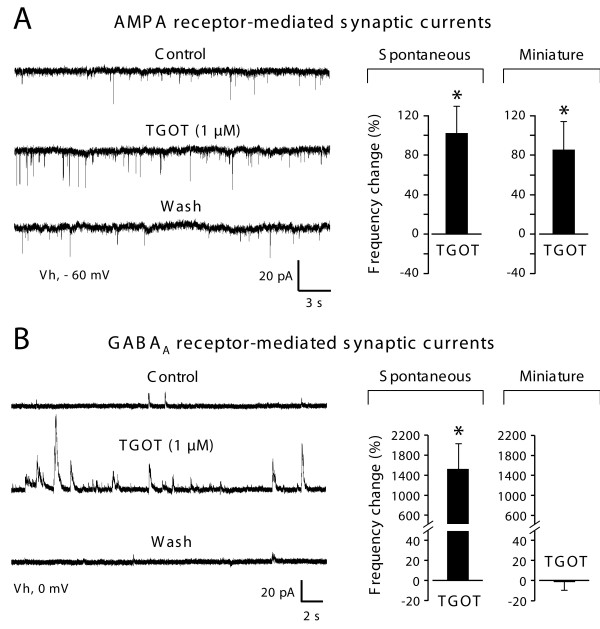
Figure 2 Differential effects of a selective oxytocin receptor (TGOT) on glutamatergic and GABAergic synaptic currents. A: Raw recordings of spontaneous AMPA-R sEPSCs (left traces) illustrate the increase of frequency triggered by the application of TGOT (1 μM). This effect was reversible and observed in 35.7% of the lamina II neurons. Histograms on the right show the mean increase (± SEM) in frequency (with respect to control) of sEPSCs and mEPSCs. B: Elevation in the frequency of occurrence of GABAA-R sIPSCs was observed in all lamina II neurons recorded (n = 6 out of 6; raw traces and histogram on the left). However, TGOT never changed the frequency of miniature GABAA-R events (right histogram). Asterisks indicate statistical significance using Student's t-test, p < 0.05.
Figure 2 Differential effects of a selective oxytocin receptor (TGOT) on glutamatergic and GABAergic synaptic currents. A: Raw recordings of spontaneous AMPA-R sEPSCs (left traces) illustrate the increase of frequency triggered by the application of TGOT (1 μM). This effect was reversible and observed in 35.7% of the lamina II neurons. Histograms on the right show the mean increase (± SEM) in frequency (with respect to control) of sEPSCs and mEPSCs. B: Elevation in the frequency of occurrence of GABAA-R sIPSCs was observed in all lamina II neurons recorded (n = 6 out of 6; raw traces and histogram on the left). However, TGOT never changed the frequency of miniature GABAA-R events (right histogram). Asterisks indicate statistical significance using Student's t-test, p < 0.05.CC BY · PubMed Central
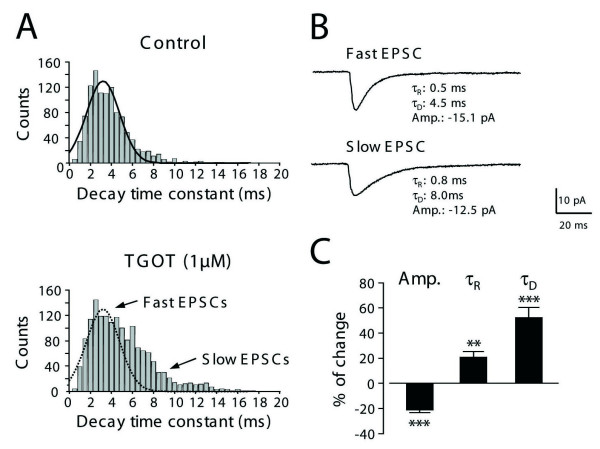
Figure 3 Application of TGOT reveals a population of AMPA-R miniature EPSCs with slow activation and deactivation kinetics. A: The histograms show the distribution of the decay time constants (τD) of miniature AMPA-R EPSCs pooled from 6 cells and detected during an identical time period of 5 minutes before (top, n = 1075 events) and after the application of 1 μM TGOT (bottom, n = 1563 events). In the presence of TGOT, the appearance of slowly decaying mEPSCs was noted in addition to the fast mEPSC population of mEPSCs with faster kinetics also found in the control situation. B: Averaged currents obtained from 91 individual mEPSCs of representative recorded neurons during TGOT treatment. Compared to the fast mEPSCs (upper trace), the averages of slow mEPSCs obtained in the presence of TGOT (lower trace) exhibited longer monoexponential constants for rise time (from τR = 0.5 ms in control to τR = 0.8 ms in TGOT) and decaying phases (from τD = 4.5 ms in control to τD= 8.0 ms in OT). The mean amplitude was also reduced in the presence of TGOT. C: Graph summarizing the changes observed in the mean amplitude (Amp.), rise time (τR), and decay time constants (τD) of AMPA-R mEPSCs during perfusion of TGOT. TGOT-induced increase in frequency was always associated with the appearance of slow rising and decaying currents having lower amplitudes. All changes observed during TGOT application were significant: p < 0.01 (**: τR, n = 6), and p < 0.001 (***: Amp and τD, n = 6) using the Student's t-test.
Figure 3 Application of TGOT reveals a population of AMPA-R miniature EPSCs with slow activation and deactivation kinetics. A: The histograms show the distribution of the decay time constants (τD) of miniature AMPA-R EPSCs pooled from 6 cells and detected during an identical time period of 5 minutes before (top, n = 1075 events) and after the application of 1 μM TGOT (bottom, n = 1563 events). In the presence of TGOT, the appearance of slowly decaying mEPSCs was noted in addition to the fast mEPSC population of mEPSCs with faster kinetics also found in the control situation. B: Averaged currents obtained from 91 individual mEPSCs of representative recorded neurons during TGOT treatment. Compared to the fast mEPSCs (upper trace), the averages of slow mEPSCs obtained in the presence of TGOT (lower trace) exhibited longer monoexponential constants for rise time (from τR = 0.5 ms in control to τR = 0.8 ms in TGOT) and decaying phases (from τD = 4.5 ms in control to τD= 8.0 ms in OT). The mean amplitude was also reduced in the presence of TGOT. C: Graph summarizing the changes observed in the mean amplitude (Amp.), rise time (τR), and decay time constants (τD) of AMPA-R mEPSCs during perfusion of TGOT. TGOT-induced increase in frequency was always associated with the appearance of slow rising and decaying currents having lower amplitudes. All changes observed during TGOT application were significant: p < 0.01 (**: τR, n = 6), and p < 0.001 (***: Amp and τD, n = 6) using the Student's t-test.CC BY · PubMed Central
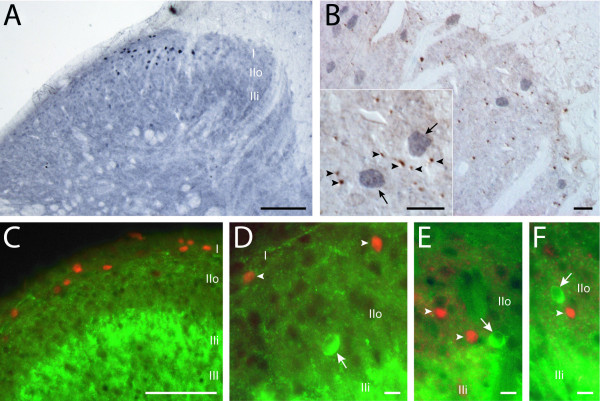
Figure 4 c-Fos expressing cells in the superficial layers of the dorsal horn after electrical stimulation of the ipsilateral PVN. A: Labeled c-Fos positive nuclei were localized in the most superficial layers i.e. lamina I and outer lamina II (IIo). B: Double immunoperoxidase labeling with an antibody against NpOT showed NpOT positive fibers (brown; arrowheads on inset) in the vicinity of c-Fos expressing nuclei (blue grey; arrows on inset). C: Double immunofluorescence labeling with an antibody against glutamic acid-decarboxylase (GAD) showed c-Fos positive nuclei (red cy3 fluorescence) in lamina I and IIo exhibiting a low GAD-immunoreactivity (green FITC fluorescence) whereas lamina IIi was strongly labeled by GAD antibody. D, E, F: In double immunofluorescence, c-Fos positive nuclei (arrowheads) never exhibited GAD labeled cytoplasm, despite the proximity in lamina IIo of GAD-immunoreactive neurons (arrows). A: 25 μm thick section; B: 1.5 μm semi-thin section; C-F: 30 μm thick sections. Sale bars: 100 μm in A and C; 10 μm in B and D-F. Individual colour channels on merged images were adjusted in C-F.
Figure 4 c-Fos expressing cells in the superficial layers of the dorsal horn after electrical stimulation of the ipsilateral PVN. A: Labeled c-Fos positive nuclei were localized in the most superficial layers i.e. lamina I and outer lamina II (IIo). B: Double immunoperoxidase labeling with an antibody against NpOT showed NpOT positive fibers (brown; arrowheads on inset) in the vicinity of c-Fos expressing nuclei (blue grey; arrows on inset). C: Double immunofluorescence labeling with an antibody against glutamic acid-decarboxylase (GAD) showed c-Fos positive nuclei (red cy3 fluorescence) in lamina I and IIo exhibiting a low GAD-immunoreactivity (green FITC fluorescence) whereas lamina IIi was strongly labeled by GAD antibody. D, E, F: In double immunofluorescence, c-Fos positive nuclei (arrowheads) never exhibited GAD labeled cytoplasm, despite the proximity in lamina IIo of GAD-immunoreactive neurons (arrows). A: 25 μm thick section; B: 1.5 μm semi-thin section; C-F: 30 μm thick sections. Sale bars: 100 μm in A and C; 10 μm in B and D-F. Individual colour channels on merged images were adjusted in C-F.CC BY · PubMed Central
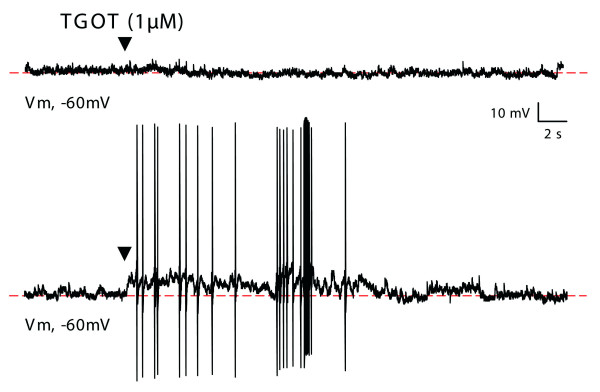
Figure 5 Effect of TGOT on the membrane potential (Em) of lamina II neurons. Raw traces illustrating the effect of TGOT (1 μM, black arrowhead) on two different lamina II neurons. In the vast majority (90%) of lamina II neurons (top trace), TGOT application had no apparent effect on Em. In a small number of neurons (10%), TGOT induced a transient depolarization which reached the threshold value for the emission of action potentials (bottom trace).
Figure 5 Effect of TGOT on the membrane potential (Em) of lamina II neurons. Raw traces illustrating the effect of TGOT (1 μM, black arrowhead) on two different lamina II neurons. In the vast majority (90%) of lamina II neurons (top trace), TGOT application had no apparent effect on Em. In a small number of neurons (10%), TGOT induced a transient depolarization which reached the threshold value for the emission of action potentials (bottom trace).CC BY · PubMed Central
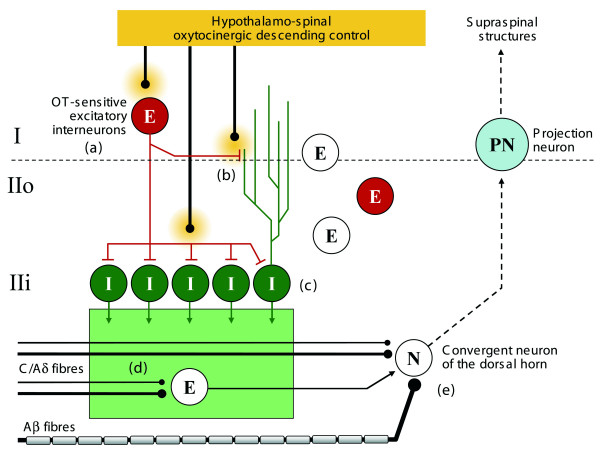
Figure 6 Simplified diagram proposal summarizing the OT effects seen in lamina I-II at the light of our present study. Our results indicate that OT, which is physiologically released by hypothalamospinal fibers terminating in lamina I-II, activates a subpopulation of glutamatergic neurons (a) and, in particular, stimulates receptors present on presynaptic glutamatergic synaptic terminals (b). We also show that population of OT-sensitive glutamatergic neurons recruits the whole population of GABAergic neurons (c) resulting in an elevated GABAergic inhibitory tone in lamina II (represented as a green box). The dissection of the spinal action of OT can now unify previous observations which were in apparent contradiction. First, a network driven increase in GABAergic inhibition is likely to explain the specific inhibition of action potential triggered by the nociceptive activation of C and Aδ fibers [21,24]. In this case, a direct presynaptic inhibition of these fibers may be responsible for this effect (d). Alternatively, it remains possible that a specific C/Aδ network is inhibited through presynaptic fibre of neuronal inhibition (d). It remains that neurons, receiving convergent sensory inputs are not the direct target for OT effect since only C/Aδ fibre activity is reduced (e). Second, our findings and mechanism proposal fully answer to the questions left open after the work of Robinson et al [18], i.e. the presynaptic inhibition of glutamate release after stimulation of the dorsal roots and the postsynaptic effect on Lamina I-II neurons (OT sensitive neurons). Abbreviations: E: excitatory glutamatergic neurons; I: inhibitory GABAergic neurons.
Figure 6 Simplified diagram proposal summarizing the OT effects seen in lamina I-II at the light of our present study. Our results indicate that OT, which is physiologically released by hypothalamospinal fibers terminating in lamina I-II, activates a subpopulation of glutamatergic neurons (a) and, in particular, stimulates receptors present on presynaptic glutamatergic synaptic terminals (b). We also show that population of OT-sensitive glutamatergic neurons recruits the whole population of GABAergic neurons (c) resulting in an elevated GABAergic inhibitory tone in lamina II (represented as a green box). The dissection of the spinal action of OT can now unify previous observations which were in apparent contradiction. First, a network driven increase in GABAergic inhibition is likely to explain the specific inhibition of action potential triggered by the nociceptive activation of C and Aδ fibers [21,24]. In this case, a direct presynaptic inhibition of these fibers may be responsible for this effect (d). Alternatively, it remains possible that a specific C/Aδ network is inhibited through presynaptic fibre of neuronal inhibition (d). It remains that neurons, receiving convergent sensory inputs are not the direct target for OT effect since only C/Aδ fibre activity is reduced (e). Second, our findings and mechanism proposal fully answer to the questions left open after the work of Robinson et al [18], i.e. the presynaptic inhibition of glutamate release after stimulation of the dorsal roots and the postsynaptic effect on Lamina I-II neurons (OT sensitive neurons). Abbreviations: E: excitatory glutamatergic neurons; I: inhibitory GABAergic neurons.CC BY · PubMed Central

Verification

Claims the paper makes

The claims and statistics of this paper haven’t been checked yet.

Run the check — free, no account needed. It reads the open-access text and checks the sources it cites.

A few free checks a day · papers already verified open instantly · results are public

Claims other papers make about this one

Each is checked against this paper’s own text: does it say what the citing paper says it does?

Self-check

Percentages, sums and reported differences re-computed from the paper’s own numbers.

The self-check needs the paper’s full text.

Citations

Cites

1 retracted

Show all 35 references

Research works printed but not linked: 3

  1. Sofroniew MV, 1981, Acta Histochem Suppl, 24, 79
  2. Shiraishi T, 1995, Neurobiology (Bp), 3, 393
  3. Elands J, 1988, Am J Physiol, 254, E31

Cited by

Sorted by citations

See all 152

Metadata

Authors
Breton, J.-D., Veinante, P., Uhl-Bronner, S., Vergnano, A. M., Freund-Mercier, M. J., Schlichter, R., & Poisbeau, P.
Affiliations
  • Centre National de la Recherche Scientifique (FR)
  • Department Nociception and Pain, Institut des Neurosciences Cellulaires et Intégratives, Unité Mixte de Recherche 7168, Centre National de la Recherche Scientifique/Université Louis Pasteur, Strasbourg, France
Corresponding author
  • Breton, Jean-Didier
  • Veinante, Pierre
  • Vergnano, Angela Maria
  • Schlichter, Rémy
  • Poisbeau, Pierrick
Venue
Molecular Pain
Published
2008-01-01
Volume
4
Pages
19-19
ISSN
1744-8069 (ISSN-L)
OpenAlex
W2146655845
Cited by
152
References
35
Citations by year
2026: 4 · 2025: 4 · 2024: 11 · 2023: 8 · 2022: 9 · 2021: 12 · 2020: 8 · 2019: 13 · 2018: 13 · 2017: 11 · 2016: 6 · 2015: 9 · 2014: 9 · 2013: 12 · 2012: 6
FWCI
3.85
Type
journal article
Language
en
Open access
Locations
  • Molecular Pain (publishedVersion, cc-by)
  • PubMed Central (publishedVersion, cc-by)
  • PubMed (publishedVersion)
  • HAL (submittedVersion)
  • DOAJ (DOAJ: Directory of Open Access Journals) (submittedVersion, cc-by-sa)
Funders
  • Fondation pour la Recherche Médicale
  • Centre National de la Recherche Scientifique
  • Institut Universitaire de France
Topics
  • Health Sciences › Medicine › Physiology (medical) › Pain Mechanisms and Treatments
  • Life Sciences › Neuroscience › Cellular and Molecular Neuroscience › Neuropeptides and Animal Physiology
  • Life Sciences › Neuroscience › Cellular and Molecular Neuroscience › Neuroscience and Neuropharmacology Research
Keywords
oxytocin, antinociception, dorsal horn, lamina II, glutamatergic interneurons, GABAergic inhibition, paraventricular nucleus, descending pain modulation, neuropathic pain, inflammatory pain
MeSH terms
Analgesia, Animals, Electrophysiology, gamma-Aminobutyric Acid, Neurons, Oxytocin, Pain, Paraventricular Hypothalamic Nucleus, Spinal Cord, Rats, Wistar, Glutamic Acid, GABA Antagonists, Rats

About these checks

Registry, retraction, Cites and statistics results are computed, not judged, with one exception: a printed reference that no index lists is read once by a model before it counts as a citation error. Claims are extracted by a model and kept only when their quote appears verbatim in the text; each cited source is then checked, with a model’s help, for whether it says what the claim relies on. Those verdicts can be wrong — read the claim’s quote and the cited source before relying on one.

Statistics and arithmetic are recomputed, not judged.

Confidence bands are shown only for fields calibrated on our annotated test set. None is calibrated yet, so no band is shown.

What counts as a claim ›How we measure confidence ›How we check this ›

Are you an author, or do you see a problem with this page? Request a review