

Exceptional error minimization in putative primordial genetic codes
Open accessThe DOI matches its Crossref record; 75 of the 75 references it cites were found in a registry or an index.
Abstract
BACKGROUND: The standard genetic code is redundant and has a highly non-random structure. Codons for the same amino acids typically differ only by the nucleotide in the third position, whereas similar amino acids are encoded, mostly, by codon series that differ by a single base substitution in the third or the first position. As a result, the code is highly albeit not optimally robust to errors of translation, a property that has been interpreted either as a product of selection directed at the minimization of errors or as a non-adaptive by-product of evolution of the code driven by other forces. RESULTS: We investigated the error-minimization properties of putative primordial codes that consisted of 16 supercodons, with the third base being completely redundant, using a previously derived cost function and the error minimization percentage as the measure of a code's robustness to mistranslation. It is shown that, when the 16-supercodon table is populated with 10 putative primordial amino acids, inferred from the results of abiotic synthesis experiments and other evidence independent of the code's evolution, and with minimal assumptions used to assign the remaining supercodons, the resulting 2-letter codes are nearly optimal in terms of the error minimization level. CONCLUSION: The results of the computational experiments with putative primordial genetic codes that contained only two meaningful letters in all codons and encoded 10 to 16 amino acids indicate that such codes are likely to have been nearly optimal with respect to the minimization of translation errors. This near-optimality could be the outcome of extensive early selection during the co-evolution of the code with the primordial, error-prone translation system, or a result of a unique, accidental event. Under this hypothesis, the subsequent expansion of the code resulted in a decrease of the error minimization level that became sustainable owing to the evolution of a high-fidelity translation system. REVIEWERS: This article was reviewed by Paul Higgs (nominated by Arcady Mushegian), Rob Knight, and Sandor Pongor. For the complete reports, go to the Reviewers' Reports section.
Overview
The claims and statistics of this paper haven’t been checked yet.
Free: it reads the open-access text and checks the first 5 claims that cite a source we can check. Create a free account to check every claim.
Integrity signals
Registry
Cites
Statistics
Figures


Verification
Claims the paper makes
The claims and statistics of this paper haven’t been checked yet.
Free: it reads the open-access text and checks the first 5 claims that cite a source we can check. Create a free account to check every claim.
Claims other papers make about this one
Each is checked against this paper’s own text: does it say what the citing paper says it does?
The cited source says what the claim attributes to it.
In the citing paper
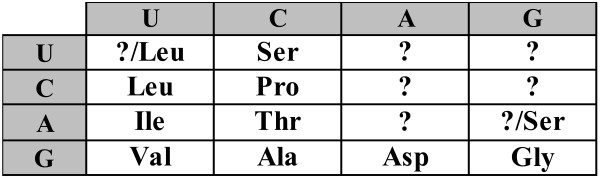
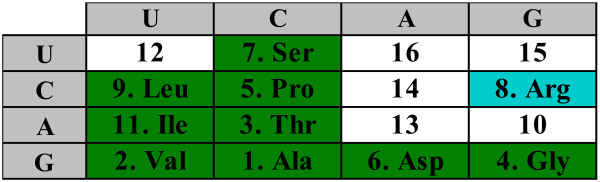
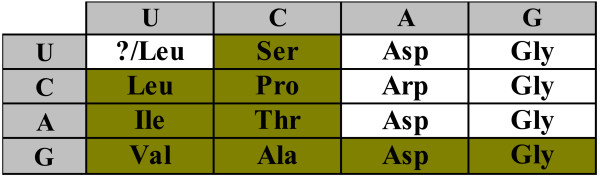
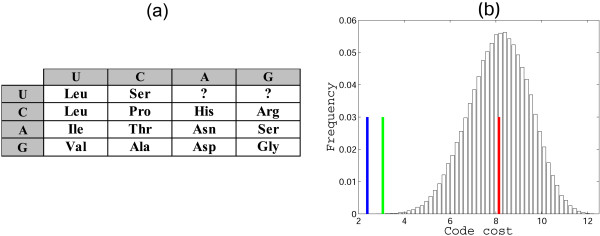
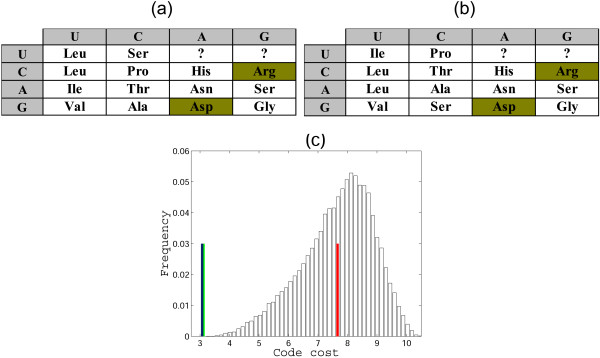
“Postulating that the third letter of the codons was uninformative in the primordial code and reducing the code table to the codons for the 10 early amino acids resulted in the reconstruction of the ancient doublet code, albeit with several codon series remaining ambiguous ( Figure 2 ) (59).”
From Origin and Evolution of the Universal Genetic Code (2017) · cites this paper as [59]
The cited source says what the claim attributes to it.
In the citing paper
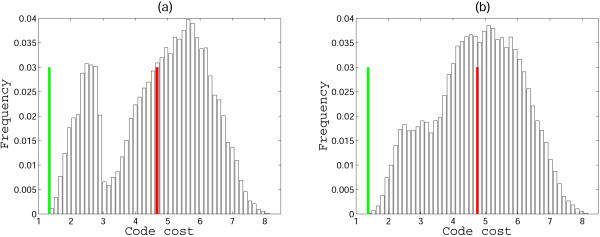
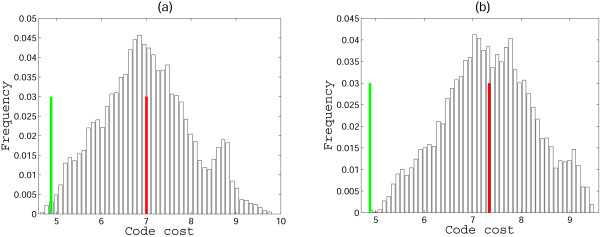
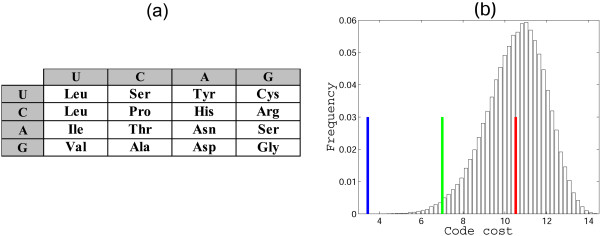
“Notably, this reconstructed primordial code shows an exceptional level of error minimization and is much closer to the global optimum than the SGC.”
From Origin and Evolution of the Universal Genetic Code (2017) · cites this paper as [59]
In the citing paper
“Extensive quantitative analyses that employed cost functions differently derived from physico-chemical properties of amino acids have shown that the code is indeed highly resilient, with the probability to pick an equally robust random code being on the order of 10−7–10−8 [14,15,61,62,63,64,65,66,67,68].”
From Frozen Accident Pushing 50: Stereochemistry, Expansion, and Chance in the Evolution of the Genetic Code (2017) · cites this paper as [65]
Self-check
Percentages, sums and reported differences re-computed from the paper’s own numbers.
The self-check needs the paper’s full text.
Citations
Cites
The Proceedings of the National Academy of Sciences
Richards, J. W. (1915) · Science · doi:10.1126/science.42.1074.161 · Cited by 13,983
Darwin, C., Burndy Library, Darwin, C., Edmonds & Remnants, & Henry Sotheran Ltd. (1859) · J. Murray eBooks · doi:10.5962/bhl.title.59991 · Cited by 6,984
A Production of Amino Acids Under Possible Primitive Earth Conditions
Miller, S. L. (1953) · Science · doi:10.1126/science.117.3046.528 · Cited by 3,522 · cited 12×
“The early ones are taken to be the 10 that are found in Miller and Urey experiments, which have previously been assumed by authors such as Wong [10] and Di Giulio [59].”
InfluentialThe origin of the genetic code
Crick, F. H. C. (1968) · Journal of Molecular Biology · doi:10.1016/0022-2836(68)90392-6 · Cited by 2,320
Miller, S. L., & Urey, H. C. (1959) · Science · doi:10.1126/science.130.3370.245 · Cited by 1,405
Xia, T., SantaLucia, J., Burkard, M. E., Kierzek, R., Schroeder, S. J., Jiao, X., Cox, C., & Turner, D. H. (1998) · Biochemistry · doi:10.1021/bi9809425 · Cited by 1,140 · cited 2×
“1st/2nd base Amino acid DNA melting [30,67] RNA stacking [68] S/W theory [69]”
BackgroundMethodMistranslation-Induced Protein Misfolding as a Dominant Constraint on Coding-Sequence Evolution
Drummond, D. A., & Wilke, C. O. (2008) · Cell · doi:10.1016/j.cell.2008.05.042 · Cited by 1,053
Dueck, G. (1993) · Journal of Computational Physics · doi:10.1006/jcph.1993.1010 · Cited by 765
A co-evolution theory of the genetic code
Wong, J. T.-F. (1975) · Proceedings of the National Academy of Sciences · doi:10.1073/pnas.72.5.1909 · Cited by 649
The genetic code is one in a million
Freeland, S. J., & Hurst, L. D. (1998) · Journal of Molecular Evolution · doi:10.1007/pl00006381 · Cited by 563 · cited 3×
“The errorminimization theory holds that the structure of the code is the result of selection for robustness to mistranslation [11,34,39,53,54].”
BackgroundMethod
Cited by
Origin and Evolution of the Universal Genetic Code
Koonin, E. V., & Novozhilov, A. S. (2017) · Annual Review of Genetics · doi:10.1146/annurev-genet-120116-024713 · Cited by 200
Self-citationKoonin, E. (2017) · Life · doi:10.3390/life7020022 · Cited by 85
“Extensive quantitative analyses that employed cost functions differently derived from physico-chemical properties of amino acids have shown that the code is indeed highly resilient, with the probability to pick an equally robust random code being on the order of 10-7-10-8 [14, 15, 61-68].”
MethodSelf-citationKoonin, E. (2017) · doi:10.20944/preprints201705.0121.v1 · Cited by 85
Self-citationExtraordinarily Adaptive Properties of the Genetically Encoded Amino Acids
Ilardo, M. A., Meringer, M., Freeland, S. J., Rasulev, B., & Cleaves, H. J. (2015) · Scientific Reports · doi:10.1038/srep09414 · Cited by 77
Resource conservation manifests in the genetic code
Shenhav, L., & Zeevi, D. (2020) · Science · doi:10.1126/science.aaz9642 · Cited by 75
Metadata
- Authors
- Novozhilov, A. S., & Koonin, E. V.
- Affiliations
- National Institutes of Health (US)
- Corresponding author
- Koonin, Eugene V
- Venue
- Biology Direct
- Published
- 2009
- Volume
- 4
- Issue
- 1
- Pages
- 44
- ISSN
- 1745-6150 (ISSN-L)
- PMC
- PMC2785773
- OpenAlex
- W2172088040
- Cited by
- 37
- References
- 75
- Citations by year
- 2026: 4 · 2025: 1 · 2024: 2 · 2023: 2 · 2022: 1 · 2021: 2 · 2020: 4 · 2019: 1 · 2018: 3 · 2017: 4 · 2016: 1 · 2015: 3 · 2014: 2 · 2013: 2 · 2012: 1
- FWCI
- 0.67
- Type
- journal article
- Language
- en
- Open access
- gold
- doi.org
- Licence
- cc-by
- Locations
- Biology Direct (publishedVersion, cc-by)
- PubMed Central (publishedVersion, cc-by)
- PubMed (publishedVersion)
- arXiv (Cornell University) (submittedVersion)
- DOAJ (DOAJ: Directory of Open Access Journals) (submittedVersion, cc-by-sa)
- arXiv (Cornell University)
- Funders
- U.S. Department of Health and Human Services
- National Institutes of Health
- U.S. National Library of Medicine
- Topics
- Life Sciences › Biochemistry, Genetics and Molecular Biology › Molecular Biology › RNA and protein synthesis mechanisms
- Physical Sciences › Physics and Astronomy › Astronomy and Astrophysics › Origins and Evolution of Life
- Life Sciences › Biochemistry, Genetics and Molecular Biology › Genetics › Evolution and Genetic Dynamics
- Keywords
- error reduction, translation errors, translation robustness, code evolution, abiotic synthesis, early selection, cost function
- MeSH terms
- Amino Acid Sequence, Amino Acids, Codon, Genetic Code, Models, Genetic, Molecular Sequence Data
About these checks
Registry, retraction, Cites and statistics results are computed, not judged, with one exception: a printed reference that no index lists is read once by a model before it counts as a citation error. Claims are extracted by a model and kept only when their quote appears verbatim in the text; each cited source is then checked, with a model’s help, for whether it says what the claim relies on. Those verdicts can be wrong — read the claim’s quote and the cited source before relying on one.
Statistics and arithmetic are recomputed, not judged.
Confidence bands are shown only for fields calibrated on our annotated test set. None is calibrated yet, so no band is shown.
What counts as a claim ›How we measure confidence ›How we check this ›
Are you an author, or do you see a problem with this page? Request a review
How to cite
Cite CoChat for the checks on this page, and the paper for its own findings.
- This page
- CoChat. (2026). Citation check: Exceptional error minimization in putative primordial genetic codes. https://app.cochat.ai/papers/10.1186/1745-6150-4-44
- The paper
- Novozhilov, A. S., & Koonin, E. V. (2009). Exceptional error minimization in putative primordial genetic codes. Biology Direct. https://doi.org/10.1186/1745-6150-4-44
Data sources
Bibliographic data: Semantic Scholar, OpenAlex, Crossref.
Contains information from the Semantic Scholar Academic Graph Datasets, made available under the ODC Attribution License (ODC-BY 1.0).
Semantic Scholar’s data is described in: Kinney, R., et al. (2023). The Semantic Scholar Open Data Platform. arXiv:2301.10140.
