

Evolution of the genetic code: partial optimization of a random code for robustness to translation error in a rugged fitness landscape
Open accessThe DOI matches its Crossref record; 67 of the 67 references it cites were found in a registry or an index.
Abstract
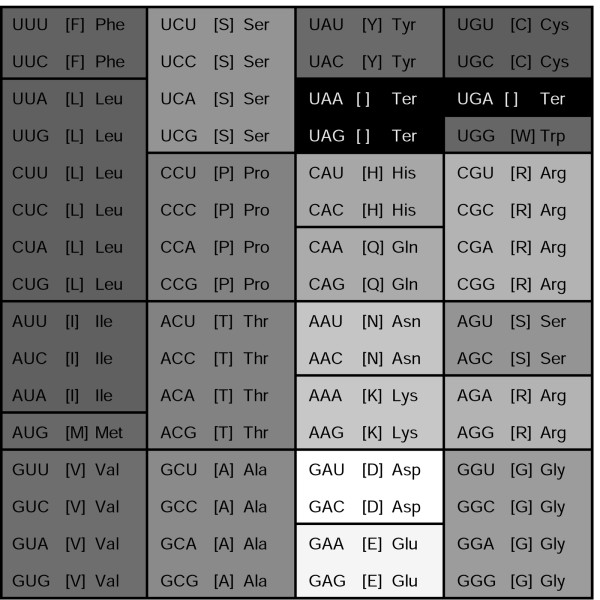
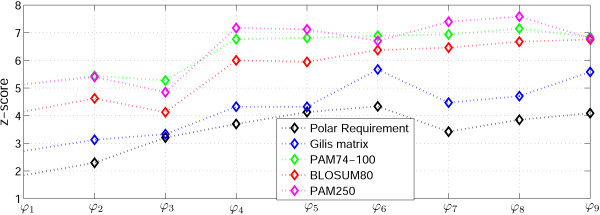
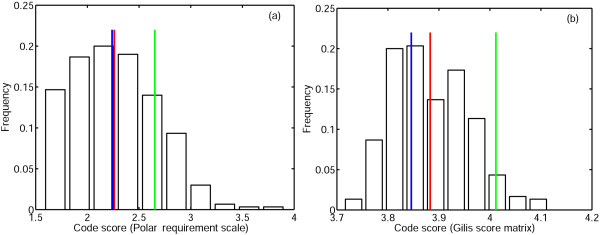
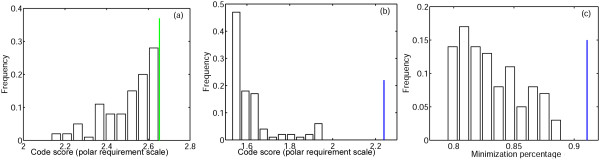
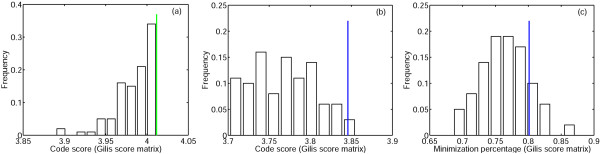
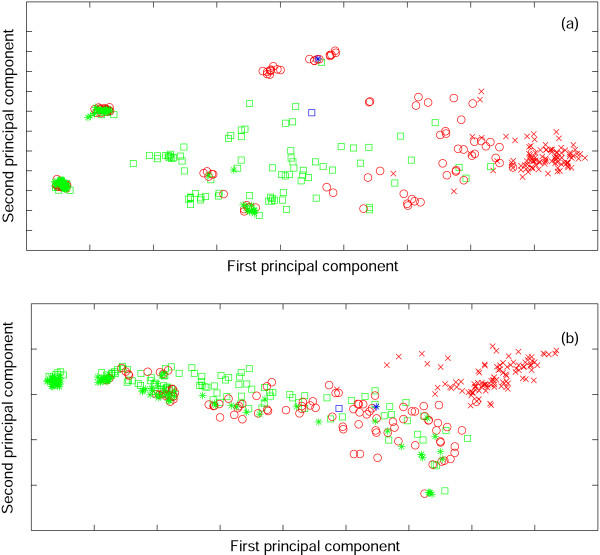
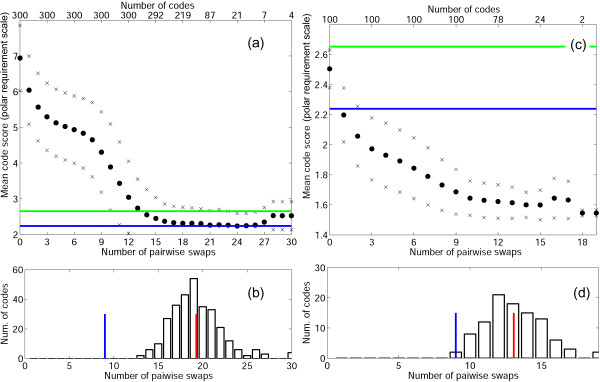
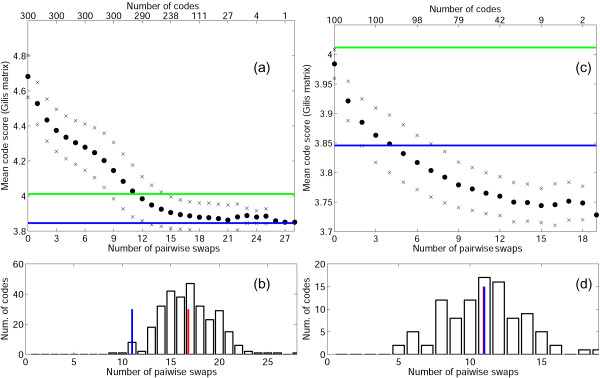
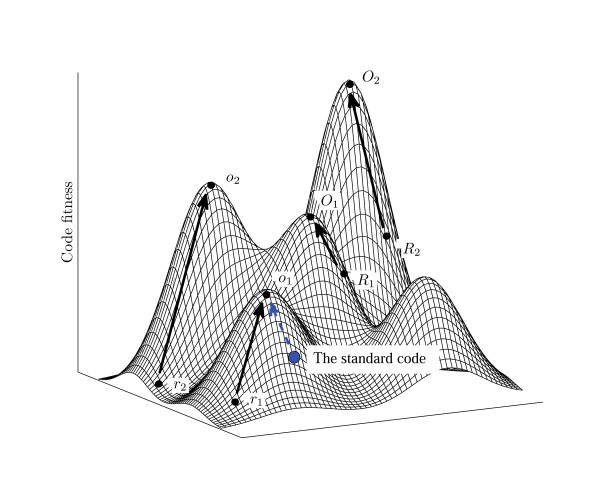
Background: The standard genetic code table has a distinctly non-random structure, with similar amino acids often encoded by codons series that differ by a single nucleotide substitution, typically, in the third or the first position of the codon. It has been repeatedly argued that this structure of the code results from selective optimization for robustness to translation errors such that translational misreading has the minimal adverse effect. Indeed, it has been shown in several studies that the standard code is more robust than a substantial majority of random codes. However, it remains unclear how much evolution the standard code underwent, what is the level of optimization, and what is the likely starting point. Results: We explored possible evolutionary trajectories of the genetic code within a limited domain of the vast space of possible codes. Only those codes were analyzed for robustness to translation error that possess the same block structure and the same degree of degeneracy as the standard code. This choice of a small part of the vast space of possible codes is based on the notion that the block structure of the standard code is a consequence of the structure of the complex between the cognate tRNA and the codon in mRNA where the third base of the codon plays a minimum role as a specificity determinant. Within this part of the fitness landscape, a simple evolutionary algorithm, with elementary evolutionary steps comprising swaps of four-codon or two-codon series, was employed to investigate the optimization of codes for the maximum attainable robustness. The properties of the standard code were compared to the properties of four sets of codes, namely, purely random codes, random codes that are more robust than the standard code, and two sets of codes that resulted from optimization of the first two sets. The comparison of these sets of codes with the standard code and its locally optimized version showed that, on average, optimization of random codes yielded evolutionary trajectories that converged at the same level of robustness to translation errors as the optimization path of the standard code; however, the standard code required considerably fewer steps to reach that level than an average random code. When evolution starts from random codes whose fitness is comparable to that of the standard code, they typically reach much higher level of optimization than the standard code, i.e., the standard code is much closer to its local minimum (fitness peak) than most of the random codes with similar levels of robustness. Thus, the standard genetic code appears to be a point on an evolutionary trajectory from a random point (code) about half the way to the summit of the local peak. The fitness landscape of code evolution appears to be extremely rugged, containing numerous peaks with a broad distribution of heights, and the standard code is relatively unremarkable, being located on the slope of a moderate-height peak. Conclusion: The standard code appears to be the result of partial optimization of a random code for robustness to errors of translation. The reason the code is not fully optimized could be the trade-off between the beneficial effect of increasing robustness to translation errors and the deleterious effect of codon series reassignment that becomes increasingly severe with growing complexity of the evolving system. Thus, evolution of the code can be represented as a combination of adaptation and frozen accident. Reviewers: This article was reviewed by David Ardell, Allan Drummond (nominated by Laura Landweber), and Rob Knight. Open Peer Review: This article was reviewed by David Ardell, Allan Drummond (nominated by Laura Landweber), and Rob Knight.
Overview
The claims and statistics of this paper haven’t been checked yet.
Free: it reads the open-access text and checks the first 5 claims that cite a source we can check. Create a free account to check every claim.
Integrity signals
Registry
Cites
Statistics
Figures
Verification
Claims the paper makes
The claims and statistics of this paper haven’t been checked yet.
Free: it reads the open-access text and checks the first 5 claims that cite a source we can check. Create a free account to check every claim.
Claims other papers make about this one
Each is checked against this paper’s own text: does it say what the citing paper says it does?
The source backs part of the claim, not all of it — or backs it for a different population, condition or comparison.
In the citing paper
“Using the language of fitness landscapes, the frozen accident perspective implies that there can be many different codes occupying fitness peaks, but these are separated by deep valleys of low fitness (60).”
From Origin and Evolution of the Universal Genetic Code (2017) · cites this paper as [60]
Experimental — accuracy not yet measuredThe source backs part of the claim, not all of it — or backs it for a different population, condition or comparison.
In the citing paper
“Using the language of fitness landscapes, the frozen accident perspective implies that there can be many different codes occupying fitness peaks, but they are separated by deep valleys of low fitness [15] (Figure 1).”
From Frozen Accident Pushing 50: Stereochemistry, Expansion, and Chance in the Evolution of the Genetic Code (2017) · cites this paper as [15]
Experimental — accuracy not yet measuredThe source backs part of the claim, not all of it — or backs it for a different population, condition or comparison.
In the citing paper
“Quantitative analyses of the code using cost functions derived from physico-chemical properties of amino acids or their evolutionary exchangeability have confirmed the exceptional robustness of the standard genetic code (SGC): the probability to reach the same level of error minimization as in the SGC by random permutation of codons is below 10−6 [10,13,14,15].”
From Frozen Accident Pushing 50: Stereochemistry, Expansion, and Chance in the Evolution of the Genetic Code (2017) · cites this paper as [15]
Experimental — accuracy not yet measuredThe cited source says what the claim attributes to it.
In the citing paper
“a quantitative estimate has shown that the SGC is positioned roughly halfway from an average random code to the summit of the corresponding local peak (60).”
From Origin and Evolution of the Universal Genetic Code (2017) · cites this paper as [60]
The cited source says what the claim attributes to it.
In the citing paper
“Obviously, however, among the ~1084 possible random codes, there is a huge number with a higher degree of error minimization than the SGC.”
From Frozen Accident Pushing 50: Stereochemistry, Expansion, and Chance in the Evolution of the Genetic Code (2017) · cites this paper as [15]
2 more claims about this paper
Create a free account to see every claim other papers make about this one.
Self-check
Percentages, sums and reported differences re-computed from the paper’s own numbers.
The self-check needs the paper’s full text.
Citations
Cites
The origin of the genetic code
Crick, F. H. C. (1968) · Journal of Molecular Biology · doi:10.1016/0022-2836(68)90392-6 · Cited by 2,320
Codon—anticodon pairing: The wobble hypothesis
Crick, F. H. C. (1966) · Journal of Molecular Biology · doi:10.1016/s0022-2836(66)80022-0 · Cited by 2,029
King, J. L., & Jukes, T. H. (1969) · Science · doi:10.1126/science.164.3881.788 · Cited by 1,768
MICROBIOLOGY AND MOLECULAR BIOLOGY REVIEWS: 2011 INSTRUCTIONS TO AUTHORS
(2011) · Microbiology and Molecular Biology Reviews · doi:10.1128/mmbr.00038-10 · Cited by 1,313
Recognition of Cognate Transfer RNA by the 30 S Ribosomal Subunit
Ogle, J. M., Brodersen, D. E., Clemons, W. M., Tarry, M. J., Carter, A. P., & Ramakrishnan, V. (2001) · Science · doi:10.1126/science.1060612 · Cited by 1,162
A co-evolution theory of the genetic code
Wong, J. T.-F. (1975) · Proceedings of the National Academy of Sciences · doi:10.1073/pnas.72.5.1909 · Cited by 649 · cited 1×
“The coevolution hypothesis [34-38] posits that the structure of the standard code reflects the biosynthetic pathways of amino acid formation.”
BackgroundSTRUCTURAL INSIGHTS INTO TRANSLATIONAL FIDELITY
Ogle, J. M., & Ramakrishnan, V. (2005) · Annual Review of Biochemistry · doi:10.1146/annurev.biochem.74.061903.155440 · Cited by 588
The genetic code is one in a million
Freeland, S. J., & Hurst, L. D. (1998) · Journal of Molecular Evolution · doi:10.1007/pl00006381 · Cited by 563 · cited 11×
“Haig and Hurst [12] let p ( c '| c ) = 1 for any two codons that differ by one base and p ( c '| c ) = 0 otherwise, not taking into account that transitions (i.e., translational misreading between two purines or two pyrimidines) might occur more often than transversions (interchange between purines and pyrimidines) [4…”
BackgroundMethodInfluentialOn the evolution of the genetic code.
Woese, C. R. (1965) · Proceedings of the National Academy of Sciences · doi:10.1073/pnas.54.6.1546 · Cited by 487
STREPTOMYCIN, SUPPRESSION, AND THE CODE
Davies, J., Gilbert, W., & Gorini, L. (1964) · Proceedings of the National Academy of Sciences · doi:10.1073/pnas.51.5.883 · Cited by 474 · cited 1×
“The initial evidence for the translation-error hypothesis consists of the aforementioned fact that related codons (codons that differ by one base only), typically, code for related amino acids (amino acids with similar physicochemical properties) and the experimental observations that translational errors occur more f…”
Background
Cited by
Origin and evolution of the genetic code: The universal enigma
Koonin, E. V., & Novozhilov, A. S. (2009) · IUBMB Life · doi:10.1002/iub.146 · Cited by 392
“Recently, we explored possible evolutionary trajectories of the genetic code within a limited domain of the vast space of possible codes (only codes that possess the same block structure and the same level of degeneracy as the standard code were analyzed) (86).”
BackgroundSelf-citationOrigin and Evolution of the Universal Genetic Code
Koonin, E. V., & Novozhilov, A. S. (2017) · Annual Review of Genetics · doi:10.1146/annurev-genet-120116-024713 · Cited by 200
Self-citationHiggs, P. G. (2009) · Biology Direct · doi:10.1186/1745-6150-4-16 · Cited by 137
“Dynamical models have also been studied [12,13] in which the code changes by swapping the amino acids assigned to two codon blocks.”
BackgroundMethodKoonin, E. (2017) · Life · doi:10.3390/life7020022 · Cited by 85
“Usi g the language of fitness landscapes, the frozen accident perspective implie that there can b many different codes occupying fitness peaks, but they are separated by deep valleys of low fitness [15] (Figure 1).”
BackgroundInfluentialSelf-citationKoonin, E. (2017) · doi:10.20944/preprints201705.0121.v1 · Cited by 85
Self-citation
Metadata
- Authors
- Novozhilov, A. S., Wolf, Y. I., & Koonin, E. V.
- Affiliations
- National Institutes of Health (US)
- Corresponding author
- Koonin, Eugene V
- Venue
- Biology Direct
- Published
- 2007-10-23
- Volume
- 2
- Issue
- 1
- Pages
- 24-24
- ISSN
- 1745-6150 (ISSN-L)
- PMC
- PMC2211284
- OpenAlex
- W2163198599
- Cited by
- 122
- References
- 67
- Citations by year
- 2026: 13 · 2025: 3 · 2024: 1 · 2023: 7 · 2022: 10 · 2021: 8 · 2020: 5 · 2019: 7 · 2018: 13 · 2017: 9 · 2016: 7 · 2015: 4 · 2014: 6 · 2013: 6 · 2012: 2
- FWCI
- 2.39
- Type
- journal article
- Language
- en
- Open access
- gold
- doi.org
- Licence
- cc-by
- Locations
- Biology Direct (publishedVersion, cc-by)
- PubMed Central (publishedVersion, cc-by)
- PubMed (publishedVersion)
- DOAJ (DOAJ: Directory of Open Access Journals) (submittedVersion, cc-by-sa)
- Funders
- U.S. Department of Health and Human Services
- National Institutes of Health
- U.S. National Library of Medicine
- Topics
- Life Sciences › Biochemistry, Genetics and Molecular Biology › Molecular Biology › RNA and protein synthesis mechanisms
- Life Sciences › Biochemistry, Genetics and Molecular Biology › Genetics › Evolution and Genetic Dynamics
- Physical Sciences › Physics and Astronomy › Astronomy and Astrophysics › Origins and Evolution of Life
- Keywords
- genetic code evolution, codon degeneracy, fitness landscape ruggedness, evolutionary trajectories, evolutionary algorithms, origin of the genetic code, codon usage bias
- MeSH terms
- Algorithms, Codon, Genetic Code, RNA, Messenger, RNA, Transfer, Selection, Genetic, Protein Biosynthesis, Evolution, Molecular
About these checks
Registry, retraction, Cites and statistics results are computed, not judged, with one exception: a printed reference that no index lists is read once by a model before it counts as a citation error. Claims are extracted by a model and kept only when their quote appears verbatim in the text; each cited source is then checked, with a model’s help, for whether it says what the claim relies on. Those verdicts can be wrong — read the claim’s quote and the cited source before relying on one.
Statistics and arithmetic are recomputed, not judged.
Confidence bands are shown only for fields calibrated on our annotated test set. None is calibrated yet, so no band is shown.
What counts as a claim ›How we measure confidence ›How we check this ›
Are you an author, or do you see a problem with this page? Request a review
How to cite
Cite CoChat for the checks on this page, and the paper for its own findings.
- This page
- CoChat. (2026). Citation check: Evolution of the genetic code: partial optimization of a random code for robustness to translation error in a rugged fitness landscape. https://app.cochat.ai/papers/10.1186/1745-6150-2-24
- The paper
- Novozhilov, A. S., Wolf, Y. I., & Koonin, E. V. (2007). Evolution of the genetic code: partial optimization of a random code for robustness to translation error in a rugged fitness landscape. Biology Direct. https://doi.org/10.1186/1745-6150-2-24
Data sources
Bibliographic data: Semantic Scholar, OpenAlex, Crossref.
Contains information from the Semantic Scholar Academic Graph Datasets, made available under the ODC Attribution License (ODC-BY 1.0).
Semantic Scholar’s data is described in: Kinney, R., et al. (2023). The Semantic Scholar Open Data Platform. arXiv:2301.10140.
