

The DOI matches its Crossref record; 140 of the 140 references it cites were found in a registry or an index.
Mapping anhedonia onto reinforcement learning: a behavioural meta-analysis
Open accessAbstract
BACKGROUND: Depression is characterised partly by blunted reactions to reward. However, tasks probing this deficiency have not distinguished insensitivity to reward from insensitivity to the prediction errors for reward that determine learning and are putatively reported by the phasic activity of dopamine neurons. We attempted to disentangle these factors with respect to anhedonia in the context of stress, Major Depressive Disorder (MDD), Bipolar Disorder (BPD) and a dopaminergic challenge. METHODS: Six behavioural datasets involving 392 experimental sessions were subjected to a model-based, Bayesian meta-analysis. Participants across all six studies performed a probabilistic reward task that used an asymmetric reinforcement schedule to assess reward learning. Healthy controls were tested under baseline conditions, stress or after receiving the dopamine D2 agonist pramipexole. In addition, participants with current or past MDD or BPD were evaluated. Reinforcement learning models isolated the contributions of variation in reward sensitivity and learning rate. RESULTS: MDD and anhedonia reduced reward sensitivity more than they affected the learning rate, while a low dose of the dopamine D2 agonist pramipexole showed the opposite pattern. Stress led to a pattern consistent with a mixed effect on reward sensitivity and learning rate. CONCLUSION: Reward-related learning reflected at least two partially separable contributions. The first related to phasic prediction error signalling, and was preferentially modulated by a low dose of the dopamine agonist pramipexole. The second related directly to reward sensitivity, and was preferentially reduced in MDD and anhedonia. Stress altered both components. Collectively, these findings highlight the contribution of model-based reinforcement learning meta-analysis for dissecting anhedonic behavior.
Overview
The claims and statistics of this paper haven’t been checked yet.
Run the check — free, no account needed. It reads the open-access text and checks the sources it cites.
Integrity signals
Registry
Cites
Statistics
Figures
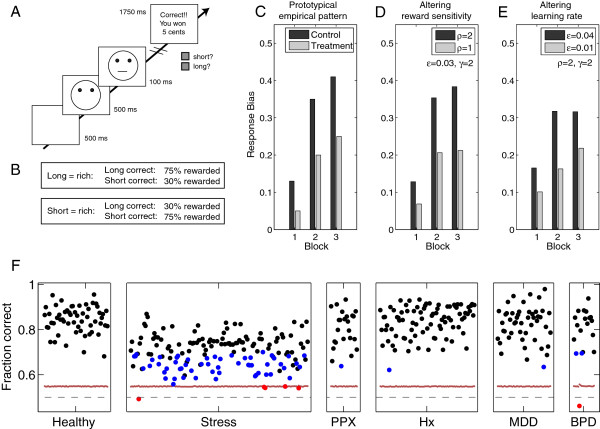
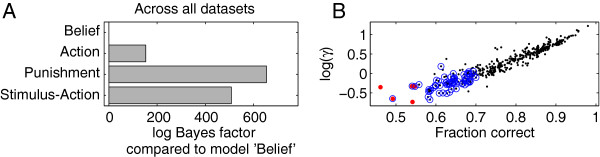
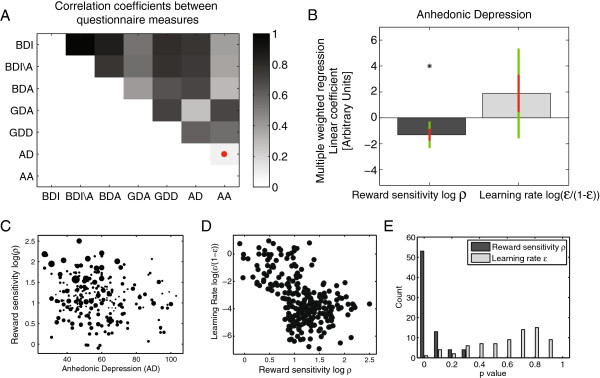
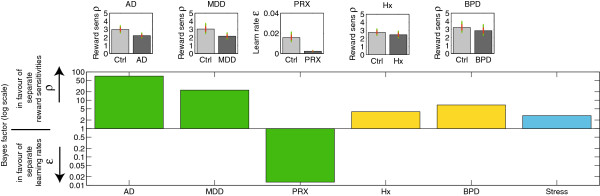
Verification
Claims the paper makes
The claims and statistics of this paper haven’t been checked yet.
Run the check — free, no account needed. It reads the open-access text and checks the sources it cites.
Claims other papers make about this one
Each is checked against this paper’s own text: does it say what the citing paper says it does?
In the citing paper
“Their study was consistent with evidence that reward sensitivity and not learning rates are reduced in anhedonic depression (Huys et al., 2013; Chen et al., 2015).”
From The orbitofrontal cortex: reward, emotion and depression (2020) · cites this paper as Huys et al., 2013
Self-check
Percentages, sums and reported differences re-computed from the paper’s own numbers.
The self-check needs the paper’s full text.
Citations
Cites
Diagnostic and Statistical Manual of Mental Disorders
Williams, J. B. W., & First, M. B. (2013) · Oxford University Press eBooks · doi:10.1093/acrefore/9780199975839.013.104 · Cited by 109,845
Maximum Likelihood from Incomplete Data Via the EM Algorithm
Dempster, A. P., Laird, N. M., & Rubin, D. B. (1977) · Journal of the Royal Statistical Society Series B: Statistical Methodology · doi:10.1111/j.2517-6161.1977.tb01600.x · Cited by 50,444
Hamilton, M. (1960) · Journal of Neurology, Neurosurgery & Psychiatry · doi:10.1136/jnnp.23.1.56 · Cited by 32,817
Gelman, A., Carlin, J. B., Stern, H. S., & Rubin, D. B. (2003) · doi:10.1201/9780429258480 · Cited by 27,276
Reinforcement Learning: An Introduction
Sutton, R. S., & Barto, A. G. (1998) · IEEE Transactions on Neural Networks · doi:10.1109/tnn.1998.712192 · Cited by 27,225
Reinforcement Learning: An Introduction
Sutton, R. S., & Barto, A. (2005) · IEEE Transactions on Neural Networks · doi:10.1109/tnn.2004.842673 · Cited by 25,268
Advances in neural information processing systems 7
Cios, K. J., & Shields, M. E. (1997) · Neurocomputing · doi:10.1016/s0925-2312(97)90018-7 · Cited by 22,093
Kass, R. E., & Raftery, A. E. (1995) · Journal of the American Statistical Association · doi:10.1080/01621459.1995.10476572 · Cited by 12,558
(1966) · Medical Entomology and Zoology · Cited by 10,293
A Rating Scale for Mania: Reliability, Validity and Sensitivity
Young, R. C., Biggs, J. T., Ziegler, V. E., & Meyer, D. A. (1978) · British Journal of Psychiatry · doi:10.1192/bjp.133.5.429 · Cited by 8,744
Research works printed but not linked: 3
- Beck A, Steer R, Brown G: Manual for the Beck Depression Inventory-II. 1996, San Antonio: Psychological Corporation
- Daw N: Decision Making, Affect, and Learning: Attention and Performance XXIII. Edited by: Delgado MR, Phelps EA, Robbins TW. 2009, OUP
- Dutra S, Brooks N, Lempert K, Guardado A, Goetz E, Pizzagalli D: Reward responsiveness in a remitted depressed sample: Effects of gender and trait negative affect. 23rd Annual Meeting of the Society for Research in Psychopathology. 2009, Minneapolis:
Cited by
Sorted by citations
Items 401–491 of 491
Kious, B. M., & Renshaw, P. F. (2021) · Cambridge University Press eBooks · doi:10.1017/9781108623018.009
Neuroimaging Brain Inflammation in Mood Disorders
Meyer, J. H. (2021) · Cambridge University Press eBooks · doi:10.1017/9781108623018.011
Functional Near-Infrared Spectroscopy Studies in Mood Disorders
Matsuo, K., & Matsubara, T. (2021) · Cambridge University Press eBooks · doi:10.1017/9781108623018.014
Neuroanatomical Findings in Unipolar Depression and the Role of the Hippocampus
Arnone, D. (2021) · Cambridge University Press eBooks · doi:10.1017/9781108623018.003
Neuroimaging Biomarkers in Pediatric Mood Disorders
West, M. P., Tang, W. J., & Singh, M. K. (2021) · Cambridge University Press eBooks · doi:10.1017/9781108623018.005
fMRI Neurofeedback as Treatment for Depression
Skottnik, L., & Linden, D. E. J. (2021) · Cambridge University Press eBooks · doi:10.1017/9781108623018.013
Neuroanatomical Findings in Bipolar Disorder
Tronchin, G., & McDonald, C. (2021) · Cambridge University Press eBooks · doi:10.1017/9781108623018.004
Imaging Glutamatergic and GABAergic Abnormalities in Mood Disorders
Scotti-Muzzi, E., Otaduy, M. C. G., Soeiro‐de‐Souza, M. G., & Machado‐Vieira, R. (2021) · Cambridge University Press eBooks · doi:10.1017/9781108623018.010
Molecular Imaging of Dopamine and Antipsychotics in Bipolar Disorder
Jauhar, S. (2021) · Cambridge University Press eBooks · doi:10.1017/9781108623018.019
Magnetoencephalography Studies in Mood Disorders
Nugent, A. C. (2021) · Cambridge University Press eBooks · doi:10.1017/9781108623018.016
Compton, W. M., & Blanco, C. (2020) · Cambridge University Press eBooks · doi:10.1017/9781108632591.001
Novel Psychoactive Substances: A New Challenge for Prevention and Treatment
Kapitány‐Fövény, M., Corazza, O., Marrinan, S., & Demetrovics, Z. (2020) · Cambridge University Press eBooks · doi:10.1017/9781108632591.032
Human Laboratory Paradigms in Addictions Research
Morris, V. L., Arshad, F., Balodis, I. M., Reed, D. D., MacKillop, J. M., & Amlung, M. T. (2020) · Cambridge University Press eBooks · doi:10.1017/9781108632591.010
Anhedonia in Addictive Behaviors
Dyer, W. G., Leventhal, A. M., Goldenson, N. I., & Bello, M. S. (2020) · Cambridge University Press eBooks · doi:10.1017/9781108632591.039
American Legal Issues in Addiction Treatment and Research
Willick, D. H. (2020) · Cambridge University Press eBooks · doi:10.1017/9781108632591.041
Strack, R. W., Orsini, M. M., Ewald, D. R., & Scheier, L. M. (2020) · Cambridge University Press eBooks · doi:10.1017/9781108632591.019
Linking gene regions jointly with environment and depression
Gard, A. M., & Ware, E. B. (2021) · Elsevier eBooks · doi:10.1016/b978-0-12-817935-2.00003-9
Mood dynamics are associated with learning and not choicePreprint
Blain, B., & Rutledge, R. B. (2019) · PsyArXiv (OSF Preprints) · doi:10.31234/osf.io/mbnca
Terpstra, A. R., & Todd, R. M. (2020) · PsyArXiv (OSF Preprints) · doi:10.31234/osf.io/zdt36
Cui, Z. (2021) · VTechWorks (Virginia Tech)
Clinical and Research Methods in the Addictions
Sussman, S. Y. (2020) · Cambridge University Press eBooks · doi:10.1017/9781108632591.008
Selvaraj, S., Brambilla, P., & Soares, J. C. (2021) · Cambridge University Press eBooks · doi:10.1017/9781108623018.022
Levels of Analysis and Etiology
(2020) · Cambridge University Press eBooks · doi:10.1017/9781108632591.014
Ongoing and Future Research Directions
(2020) · Cambridge University Press eBooks · doi:10.1017/9781108632591.030
Sussman, S. Y. (2020) · Cambridge University Press eBooks · doi:10.1017/9781108632591.002
Srivastava, A. B., & Gold, M. S. (2020) · Cambridge University Press eBooks · doi:10.1017/9781108632591.033
Selvaraj, S., Brambilla, P., & Soares, J. C. (2021) · Cambridge University Press eBooks · doi:10.1017/9781108623018.001
Sussman, S. Y. (2020) · Cambridge University Press eBooks · doi:10.1017/9781108632591.042
Computational Modeling in Various Cognitive Fields
(2023) · Cambridge University Press eBooks · doi:10.1017/9781108755610.027
Computational Modeling in Psychiatry
Walters, C. J., Vinogradov, S., & Redish, A. D. (2023) · Cambridge University Press eBooks · doi:10.1017/9781108755610.031
Simeonov, L., Valton, V., Hindocha, C., Raja, A., Cagatayli, S., Bono, D., Klein, N., Freeman, T. P., Roiser, J. P., Curran, V., et al. (2023) · PsyArXiv (OSF Preprints) · doi:10.31234/osf.io/vpbf5
Hoskin, R., Pernet, C. R., & Talmi, D. (2023) · SSRN Electronic Journal · doi:10.1101/2023.07.20.549309
Andersen, M. H., & Arenfeldt, S. K. (2023) · PsyArXiv (OSF Preprints) · doi:10.31234/osf.io/hyp87
A series of unfortunate events: Do those who catastrophize learn more after negative outcomes?
Harada‐Laszlo, M., Talwar, A., Robinson, O. J., & Pike, A. C. (2023) · Mental Health Science · doi:10.1002/mhs2.49
Computational modeling and autonomic control
Suksasilp, C., Friston, K. J., & Garfinkel, S. N. (2024) · Elsevier eBooks · doi:10.1016/b978-0-12-820480-1.00076-0
Innovative Pharmacometric Approaches to Inform Drug Development and Clinical Use
(2024) · Frontiers research topics · doi:10.3389/978-2-8325-4503-4
Computational principles of adaptive coding in healthy and impaired reinforcement learning
Bavard, S. (2021) · theses.fr (ABES) · doi:10.70675/23e9dabcz6cc1z4188z9646z5a919495ba54
Falck, J., Lindenberg, K., Schwarzer, G., Straube, B., & Shing, Y. L. (2024) · OSF Preprints (OSF Preprints) · doi:10.31219/osf.io/zu7pr
Macaulay, T., Buscemi, J., Tran, S. T., Miller, S. A., & Greenley, R. N. (2024) · Journal of Pediatric Psychology · doi:10.1093/jpepsy/jsae079
Cross-species dissection of the modular role of the ventral tegmental area in depressive disorders
Morris, L. S., Beltran, J., Murrough, J. W., & Morel, C. (2025) · Neuroscience · doi:10.1016/j.neuroscience.2025.02.008
Anhedonic Traits Do Not Impair Performance in a 3-Arm Bandit Task
Ramaswamy, A., Yamamori, Y., Vivekananda, U., Vladimir Litvak, A., & Roiser, J. P. (2026) · Computational Psychiatry · doi:10.5334/cpsy.135
Kind, A. (2024) · transcript Verlag eBooks · doi:10.1515/9783839476741-009
Nist, A. N., Walsh, S. J., & Shahan, T. A. (2025) · Psychopharmacology · doi:10.1007/s00213-025-06794-y
Computational Link Between Motivational Factors and Cognitive Deficits in Depression
Stolicyn, A., Romaniuk, L., Lawrie, S. M., & Seriès, P. (2026) · Cognitive Computation · doi:10.1101/2025.05.30.25328678
Prior learning shapes effort choice, revealing valence asymmetries and disruption in anhedoniaPreprint
Guinea, C., Xiao, B., & Lawson, R. P. (2025) · bioRxiv (Cold Spring Harbor Laboratory) · doi:10.1101/2025.07.24.666522
Yasevioğlu, Ş. Ö., & Burkovik, H. Y. (2025) · Uluslararası Sosyal Bilimler Akademik Araştırmalar Dergisi · doi:10.58201/utsobilder.1667797
Granwald, T., Triolo, F., Lengyel, M., Dayan, P., & Guitart‐Masip, M. (2025) · Biological Psychiatry Cognitive Neuroscience and Neuroimaging · doi:10.1016/j.bpsc.2025.09.013
Self-citationValue-Based Decision-Making in the Wild: Opportunities and Challenges
Kühnel, A., Thurn, L., Steward, T., & Kroemer, N. B. (2025) · Studies in neuroscience, psychology and behavioral economics · doi:10.1007/978-3-032-00880-0_10
Does Reward Insensitivity in Anhedonia Result From Limitations in Cognitive Capacity?
Brown, V. M. (2025) · Biological Psychiatry Cognitive Neuroscience and Neuroimaging · doi:10.1016/j.bpsc.2025.09.008
Joint modeling for learning decision-making dynamics in behavioral experiments
Bian, Y., Guo, X., & Wang, Y. (2025) · The Annals of Applied Statistics · doi:10.1214/25-aoas2112
Mechanisms of apathy in health and Parkinson's disease
Hezemans, F. H. (2020) · Apollo (University of Cambridge) · doi:10.17863/cam.63928
Raslescu, A. (2024) · Oxford University Research Archive (ORA) (University of Oxford) · doi:10.5287/ora-pv8avbxdq
How Does the Psychiatrist Know?
Kind, A. (2025) · BiblioBoard Library Catalog (Open Research Library) · doi:10.18452/31243
Epilepsy from a network perspective
Sala‐Padró, J. (2024) · Tesis Doctorals en Xarxa (Consorci de Serveis Universitaris de Catalunya)
Senta, J. (2024) · eScholarship (California Digital Library)
Crawley, D. (2023) · UCL Discovery (University College London)
Berkovitch, L., Vinckier, F., Salvador, A., Pessiglione, M., Deakin, J. F. W., DAWSON, G. E., Harmer, C. J., Goodwin, G. M., & Gaillard, R. (2026) · medRxiv · doi:10.64898/2025.12.30.25342896
Karamancı, C. (2025) · UCL Discovery (University College London)
Neuroscientific Approach to Artificial Intelligence for Psychopathologies
Celik, K., & Çelik, S. (2026) · Advances in computational intelligence and robotics book series · doi:10.4018/979-8-3373-1325-2.ch006
Cheng, A., Konova, A. B., Powers, A. R., Corlett, P., Levy, I., Gu, X., Huys, Q. J. M., Pushkarskaya, H., Fineberg, S. K., Hauser, T. U., et al. (2026) · Biological Psychiatry Cognitive Neuroscience and Neuroimaging · doi:10.1016/j.bpsc.2026.02.009
Self-citationDinh-Williams, L.-A. (2022) · TSpace (University of Toronto)
Learning how we learn:Feedback-learning models to understand development
Schaaf, J. V. (2023) · UvA-DARE (University of Amsterdam)
Investigating the Behavioural and Electrophysiological Consequences of Early Life Stress
Wilkinson, M. P. (2021) · Bristol Research (University of Bristol)
藤田, 和. (2023) · Institutional Repositories DataBase (IRDB)
Skvortsova, V. (2015) · theses.fr (ABES) · doi:10.70675/689de32az1e54z4d0cz9034ze64320166cdf
A computational account of how affective states influence economic decisions
Heerema, R. (2023) · theses.fr (ABES) · doi:10.70675/a319dd46z4623z4805z9223zb939a0acf611
Caractérisation neuro-computationnelle de l'humeur : causes et conséquences
Carrillo, P. (2024) · theses.fr (ABES) · doi:10.70675/181aec0cz429dz4bccz83f0za479cbef52f7
Computational Psychiatry and Transdiagnostic Models of Mental Disorders
Hallquist, M. N., Allen, T. A., Okan, A., Paolizzi, S. G., & Dombrovski, A. Y. (2026) · Oxford University Press eBooks · doi:10.1093/9780197769676.003.0018
The interpretation of behavior-model correlations in unidentified cognitive modelsPreprint
Miletić, S., & van Maanen, L. (2022) · OSF Preprints (OSF Preprints)
Balcazar, J., Albanese, B. J., Rymer, T., Davis, M., Campos, S., Polimerou, M., Abel, E., Shapley, J., Algranatti, I., Wood, H., et al. (2026) · medRxiv · doi:10.64898/2026.05.14.26353209
Delattre, B., Griffin, J. D., Pulcu, E., Watton, F., Gillespie, A., Buckman, J. E. J., Murphy, S. E., & Harmer, C. J. (2026) · Journal of Affective Disorders Reports · doi:10.1016/j.jadr.2026.101162
The Reinforcement Effect of Social Media Likes in Depression
Mirea, D.-M., Chen, S., Ding, J., Palacio-Soto, K., Mildner, J. N., Kelley, S. W., Gillan, C. M., Nook, E. C., & Niv, Y. (2026) · JAMA Psychiatry · doi:10.1001/jamapsychiatry.2026.1430
Increased Aperiodic Exponents Track Depressive Symptom Severity in Refractory Epilepsy
Libowitz, M. R., Sun, W., Rabinovich, R. J., Du, J., Campbell, J. M., Cowan, R. L., Shahdoust, N., Price, T. A., Davis, T. S., Buckner, R. L., et al. (2026) · Biological Psychiatry Cognitive Neuroscience and Neuroimaging · doi:10.1016/j.bpsc.2026.06.017
Gone fishin’… for distinct patterns of belief-updating in late-life worry and rumination
Ianni, A. M., Brown, V. M., Weinstein, A. M., Li, M., Andreescu, C., & Gerlach, A. (2026) · Frontiers in Psychiatry · doi:10.3389/fpsyt.2026.1824838
Anhedonia and Reward Learning in Major Depression: State or Trait?
Gürcan, A., Başar, K., & Karahan, S. (2026) · Neuropsychobiology · doi:10.1159/000553592
Wang, W. (2026) · UNSWorks (University of New South Wales, Sydney, Australia) · doi:10.26190/unsworks/32548
Neurosurgery for treatment-resistant depression: valuation and decision making
Suveges, S., Gilbertson, T., & Steele, J. D. (2026) · Brain · doi:10.1093/brain/awag258
Vares, M. (2026) · DSpace repository (University of Tartu)
Transdiagnostic latent factors dissociating depression and anxiety through reinforcement learning
Huang, X., Ni, Y., Wang, Y., Peng, Y., & Li, J. (2026) · BMC Psychiatry · doi:10.1186/s12888-026-08592-y
A dimensional link between gain–loss economic preferences and psychopathologyPreprint
Feng, Y.-Y., & Monosov, I. E. (2026) · bioRxiv (Cold Spring Harbor Laboratory) · doi:10.64898/2026.09.09.750300
Reward prediction error and reward components in interactive virtual reality for anhedonia
Kosa, M., Barnes‐Horowitz, N. M., & Craske, M. G. (2026) · Nature Mental Health · doi:10.1038/s44220-026-00731-4
Reward learning in prolonged grief: Evidence from the probabilistic reward task
Azevedo, S., & Bryant, R. A. (2026) · Behaviour Research and Therapy · doi:10.1016/j.brat.2026.105164
What is Computational Psychiatry? An introductory narrative review
Antonucci, L. A., Corponi, F., Folesani, F., Jannini, T. B., Montemitro, C., Muscettola, A., Achilli, F., Ossola, P., Pigoni, A., Raio, A., et al. (2026) · Giornale italiano di psicopatologia/Journal of psychopathology/Italian journal of psychopathology
Disorders of social functioning
Votinov, M. (2026) · Elsevier eBooks · doi:10.1016/b978-0-443-34080-2.00013-5
Did I do that? Efficacy estimation distinguishes rumination and anhedonia symptomatology
Migó, M., Brown, V. M., Cooper, J. A., Ryan, J., Hitchcock, P., & Treadway, M. T. (2026) · Biological Psychiatry Cognitive Neuroscience and Neuroimaging · doi:10.1016/j.bpsc.2026.10.010
Assessing reinforcement learning and vigor with an online decision-making batteryPreprint
Wenke, Š., Granwald, T., Ferrante, A., Nilsson, M., Ekström, I., Papenberg, G., & Guitart‐Masip, M. (2026) · bioRxiv (Cold Spring Harbor Laboratory) · doi:10.64898/2026.10.30.763028
Metadata
- Authors
- Huys, Q. J., Pizzagalli, D. A., Bogdan, R., & Dayan, P.
- Affiliations
- Gatsby Computational Neuroscience Unit (GB)
- Harvard University (US)
- Duke University (US)
- Corresponding author
- Huys, Quentin JM
- Venue
- Biology of Mood & Anxiety Disorders
- Published
- 2013-06-19
- Volume
- 3
- Issue
- 1
- Pages
- 12-12
- ISSN
- 2045-5380 (ISSN-L)
- PMC
- PMC3701611
- OpenAlex
- W2157813419
- Cited by
- 480
- References
- 139
- Citations by year
- 2026: 27 · 2025: 42 · 2024: 35 · 2023: 54 · 2022: 50 · 2021: 57 · 2020: 78 · 2019: 20 · 2018: 35 · 2017: 38 · 2016: 14 · 2015: 19 · 2014: 9 · 2013: 2
- FWCI
- 7.20
- Type
- journal article
- Language
- en
- Open access
- hybrid
- doi.org
- Licence
- Locations
- Biology of Mood & Anxiety Disorders (publishedVersion, cc-by)
- Europe PMC (PubMed Central) (publishedVersion, cc-by)
- PubMed Central (publishedVersion, cc-by)
- PubMed (publishedVersion)
- Zurich Open Repository and Archive (University of Zurich) (acceptedVersion, other-oa)
- Digital Access to Scholarship at Harvard (DASH) (Harvard University) (submittedVersion, cc-by)
- UCL Discovery (University College London) (submittedVersion)
- MPG.PuRe (Max Planck Society) (submittedVersion)
- Repository for Publications and Research Data (ETH Zurich) (submittedVersion, cc-by)
- Zurich Open Repository and Archive (University of Zurich) (submittedVersion, cc-by)
- ETH Zürich Research Collection
- Zurich Open Repository and Archive (University of Zurich)
- Funders
- AstraZeneca
- Gatsby Charitable Foundation
- Deutsche Forschungsgemeinschaft
- Servier
- National Institute of Mental Health (R01MH101521, R01MH095809, MH095809, R01MH068376, R21MH078979, MH068376)
- National Center for Complementary and Integrative Health (R21AT002974)
- Topics
- Life Sciences › Neuroscience › Cellular and Molecular Neuroscience › Neurotransmitter Receptor Influence on Behavior
- Life Sciences › Neuroscience › Cognitive Neuroscience › Neural and Behavioral Psychology Studies
- Social Sciences › Psychology › Experimental and Cognitive Psychology › Anxiety, Depression, Psychometrics, Treatment, Cognitive Processes
- Keywords
- anhedonia, reinforcement learning, reward sensitivity, prediction error, dopamine, pramipexole, major depressive disorder, bipolar disorder, stress, learning rate, probabilistic reward task, model-based reinforcement learning
About these checks
Registry, retraction, Cites and statistics results are computed, not judged, with one exception: a printed reference that no index lists is read once by a model before it counts as a citation error. Claims are extracted by a model and kept only when their quote appears verbatim in the text; each cited source is then checked, with a model’s help, for whether it says what the claim relies on. Those verdicts can be wrong — read the claim’s quote and the cited source before relying on one.
Statistics and arithmetic are recomputed, not judged.
Confidence bands are shown only for fields calibrated on our annotated test set. None is calibrated yet, so no band is shown.
What counts as a claim ›How we measure confidence ›How we check this ›
Are you an author, or do you see a problem with this page? Request a review
